Dashboard
The Dashboard page is divided into two tabs: Overview and Historic Cluster Monitoring.
Overview
The Overview tab provides a Service Monitor that displays the services running in the TigerGraph system and their dependencies.
You can view services in either Dependency view or Table view.
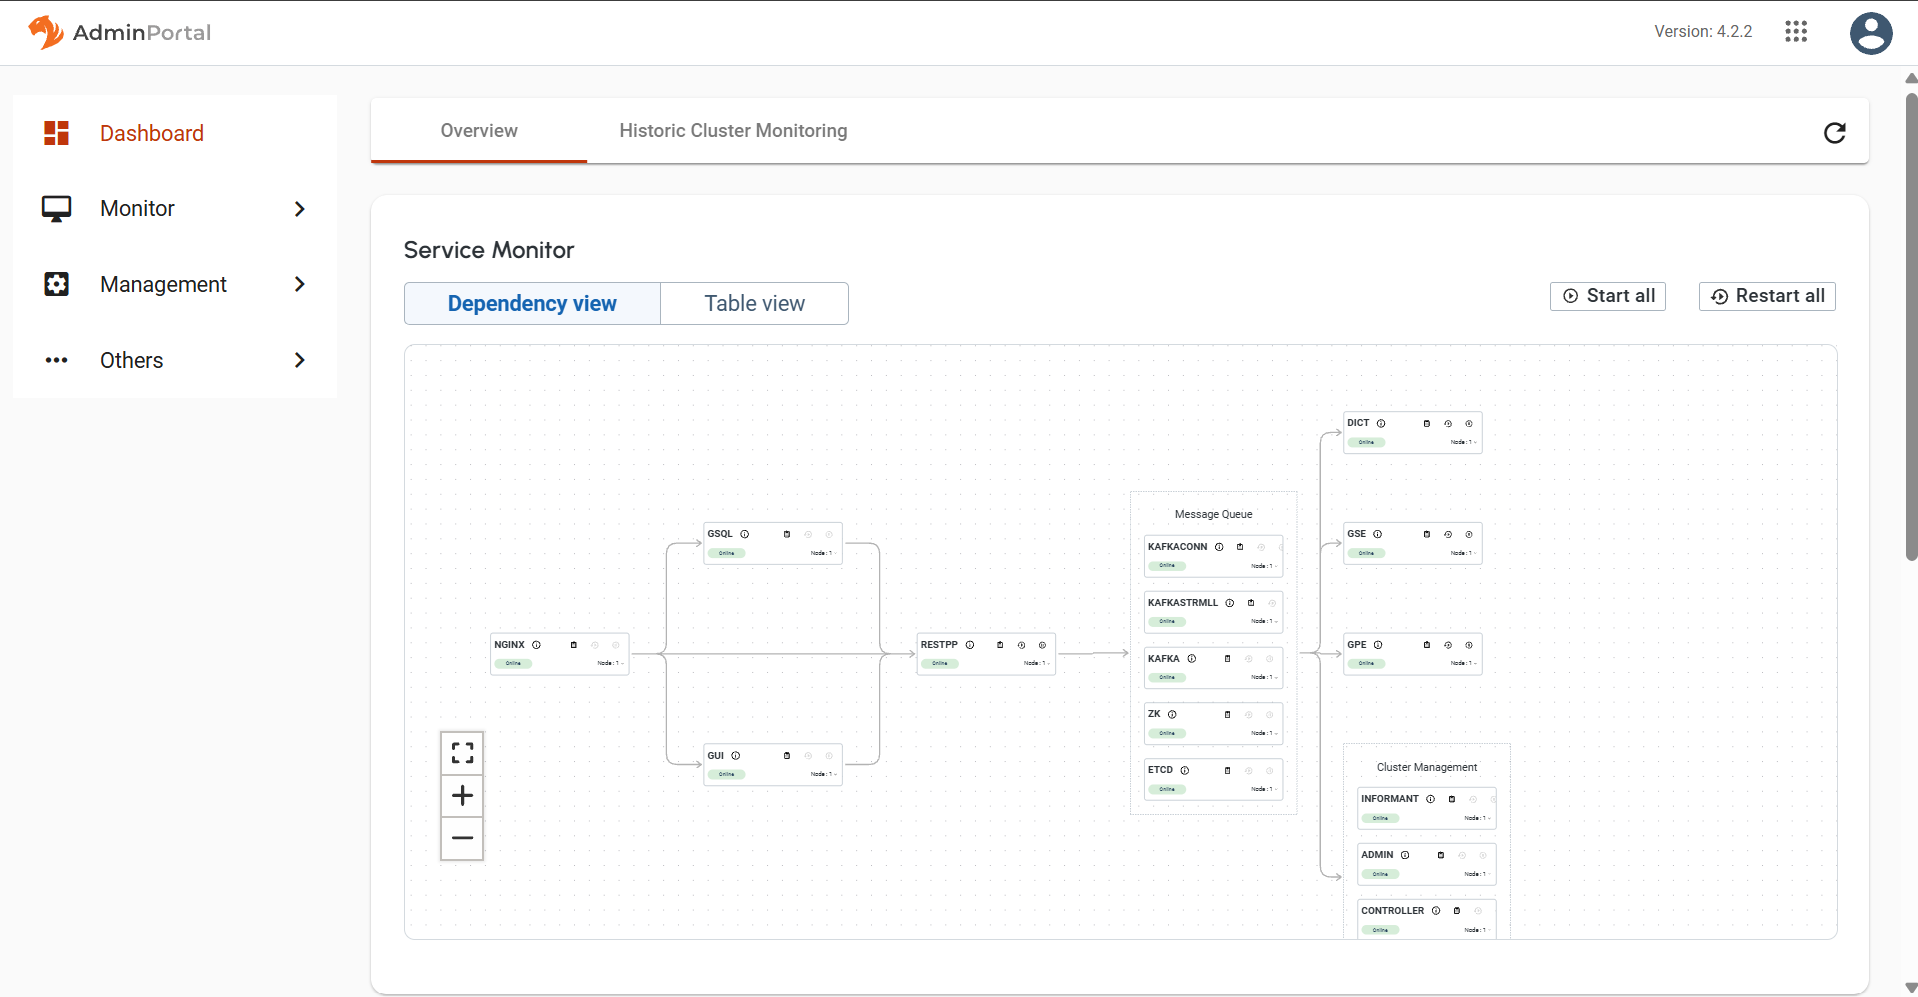
Service monitoring map
Each service can be restarted individually or all at once. This is equivalent to the start, stop, and restart commands in the gadmin Command Glossary.
Click the Table view button to display service status, CPU usage, memory usage, and available actions in a tabular format.
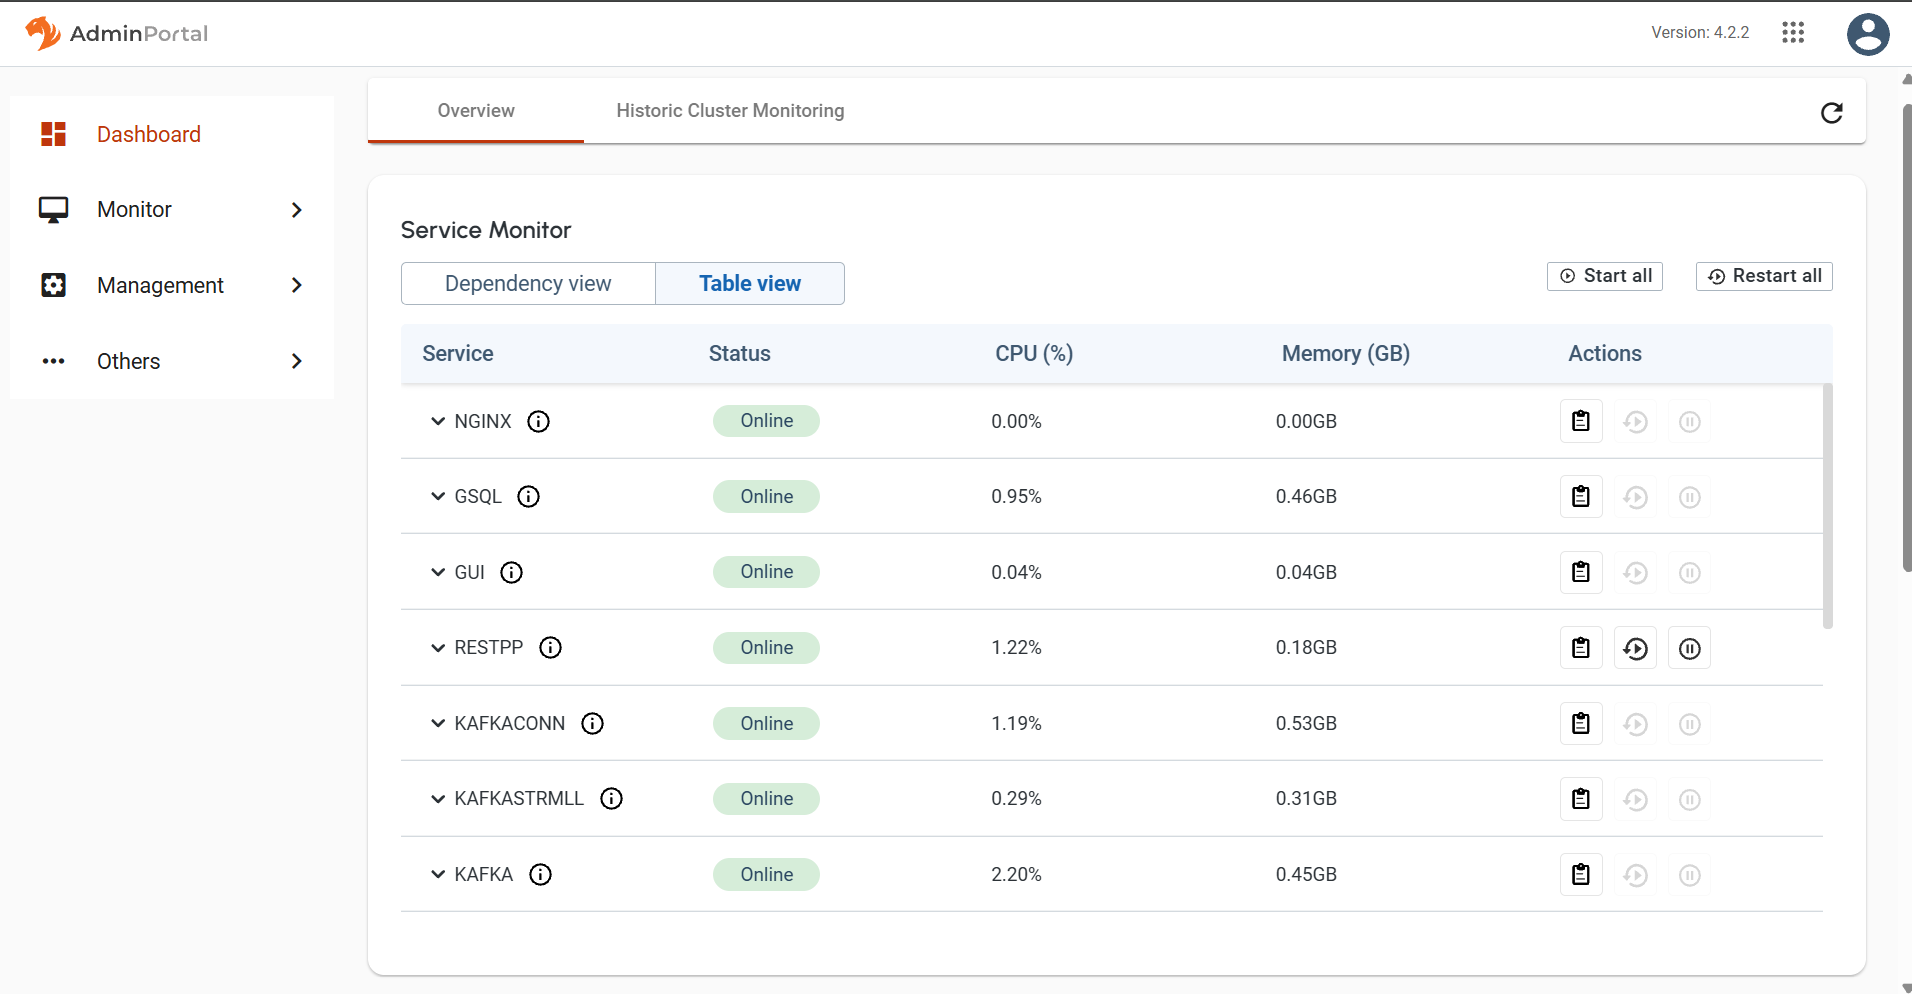
Service monitoring table
Historic cluster monitoring
The Historic Cluster Monitoring tab displays resource utilization and service statistics over time.
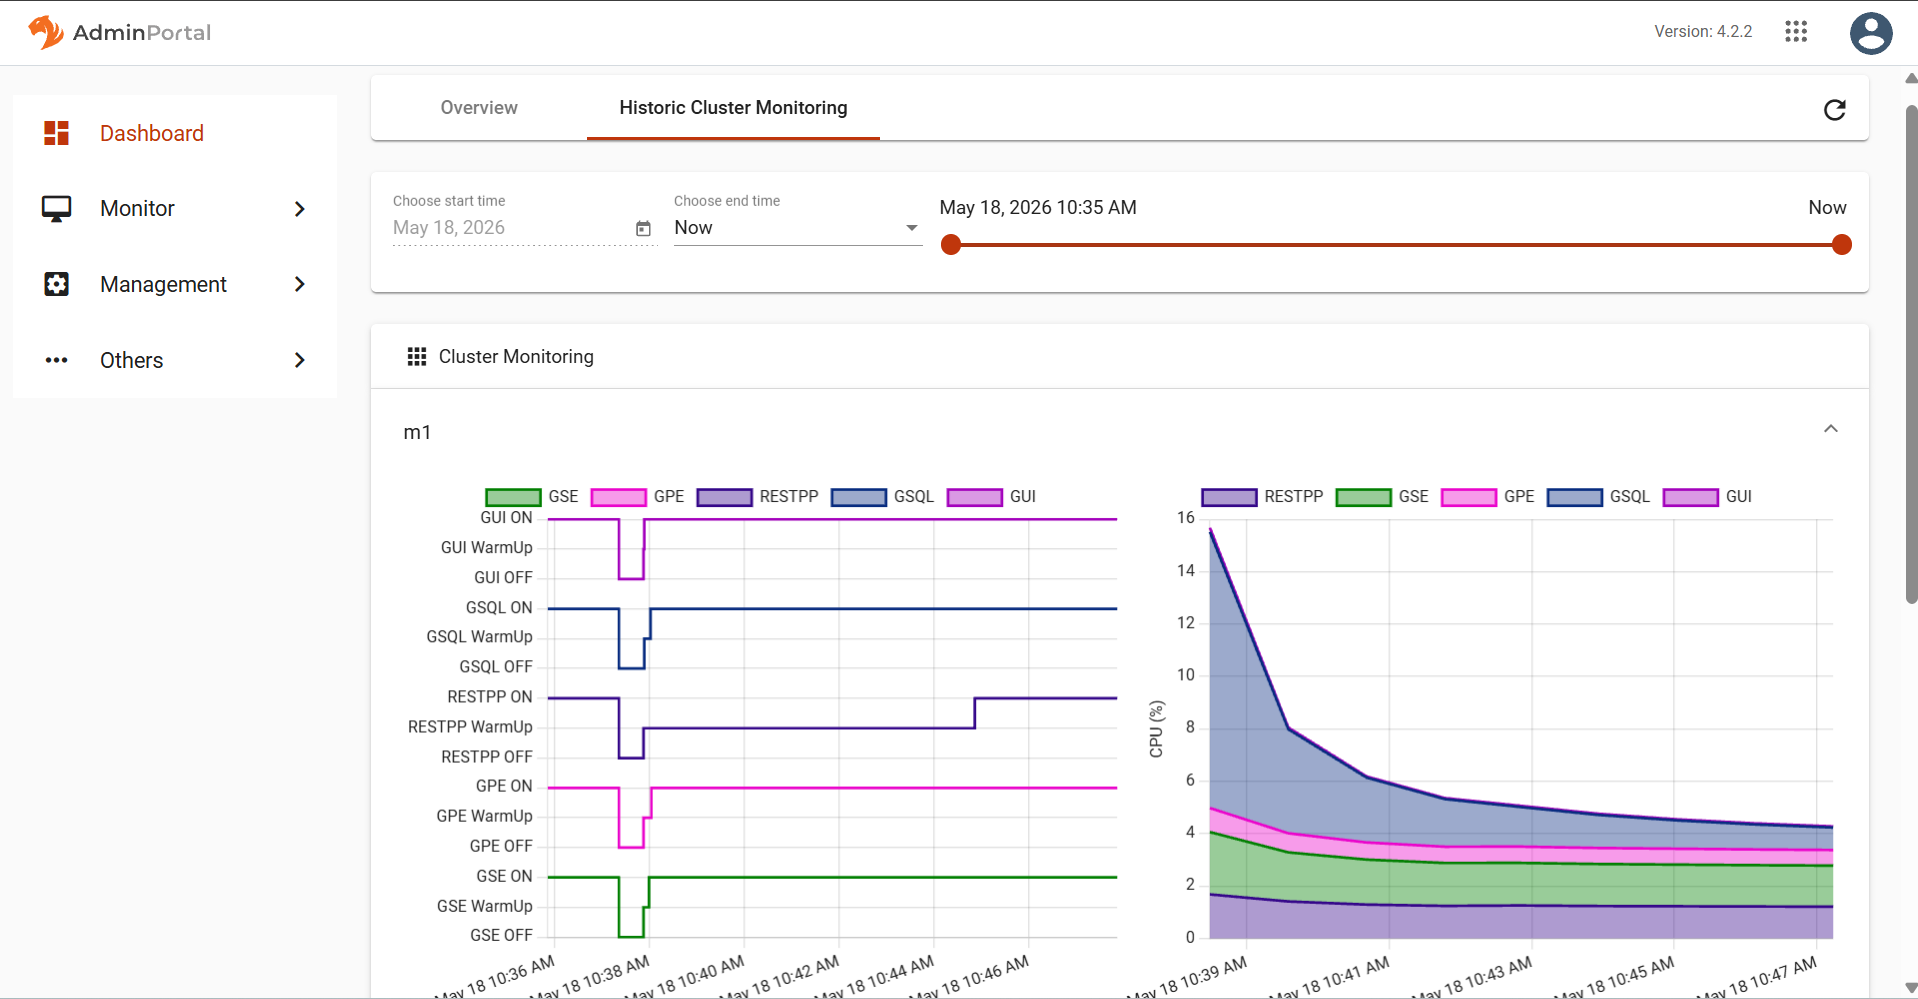
Cluster monitoring page
Selecting the time range
Use the time range picker at the top to set the time range to be used for the statistics in the charts. Selecting "Now" as the end time will keep the statistics regularly updated.
Changing any of these selections will trigger a request for statistics data and the chart will be re-rendered accordingly. You may need to wait several seconds for the screen to update. If the screen does not update after a while, try resizing the browser window to trigger a refresh.
The GSQL Query Performance section lists all queries accessible to the current user. If you click on a query name, the display will expand to show detailed charts about that query.
.png)
.png)
Query monitoring panel
Machine Monitor
The Machine Monitoring panel includes four charts.
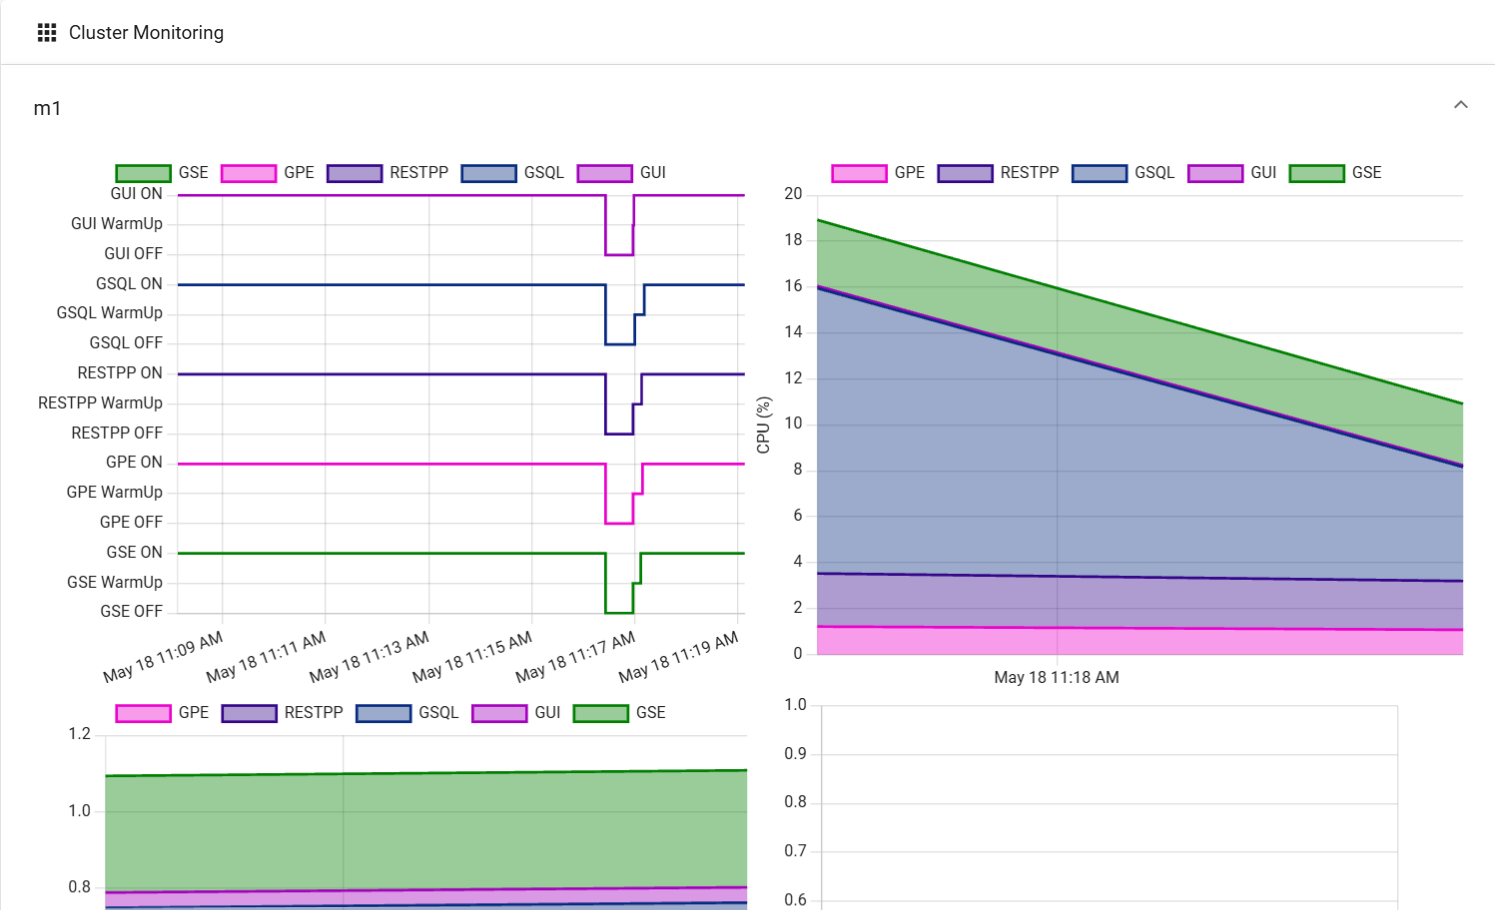
Machine monitoring panel
-
Service status: ON, Warm Up, or OFF status for the selected component.
-
CPU Usage: Percentage of available CPU time used by the selected component.
-
Memory Usage: Amount of memory used by the selected component, measured in GB.
-
Disk Usage: Amount of disk space used by the selected component, measured in GB.
The first three charts break down information among the core TigerGraph services (GSE, GPE, RESTPP, GSQL, and GUI).
The Disk Usage chart shows storage utilization for components that typically consume disk space, such as GStore, log files, and Apache Kafka.