Logs
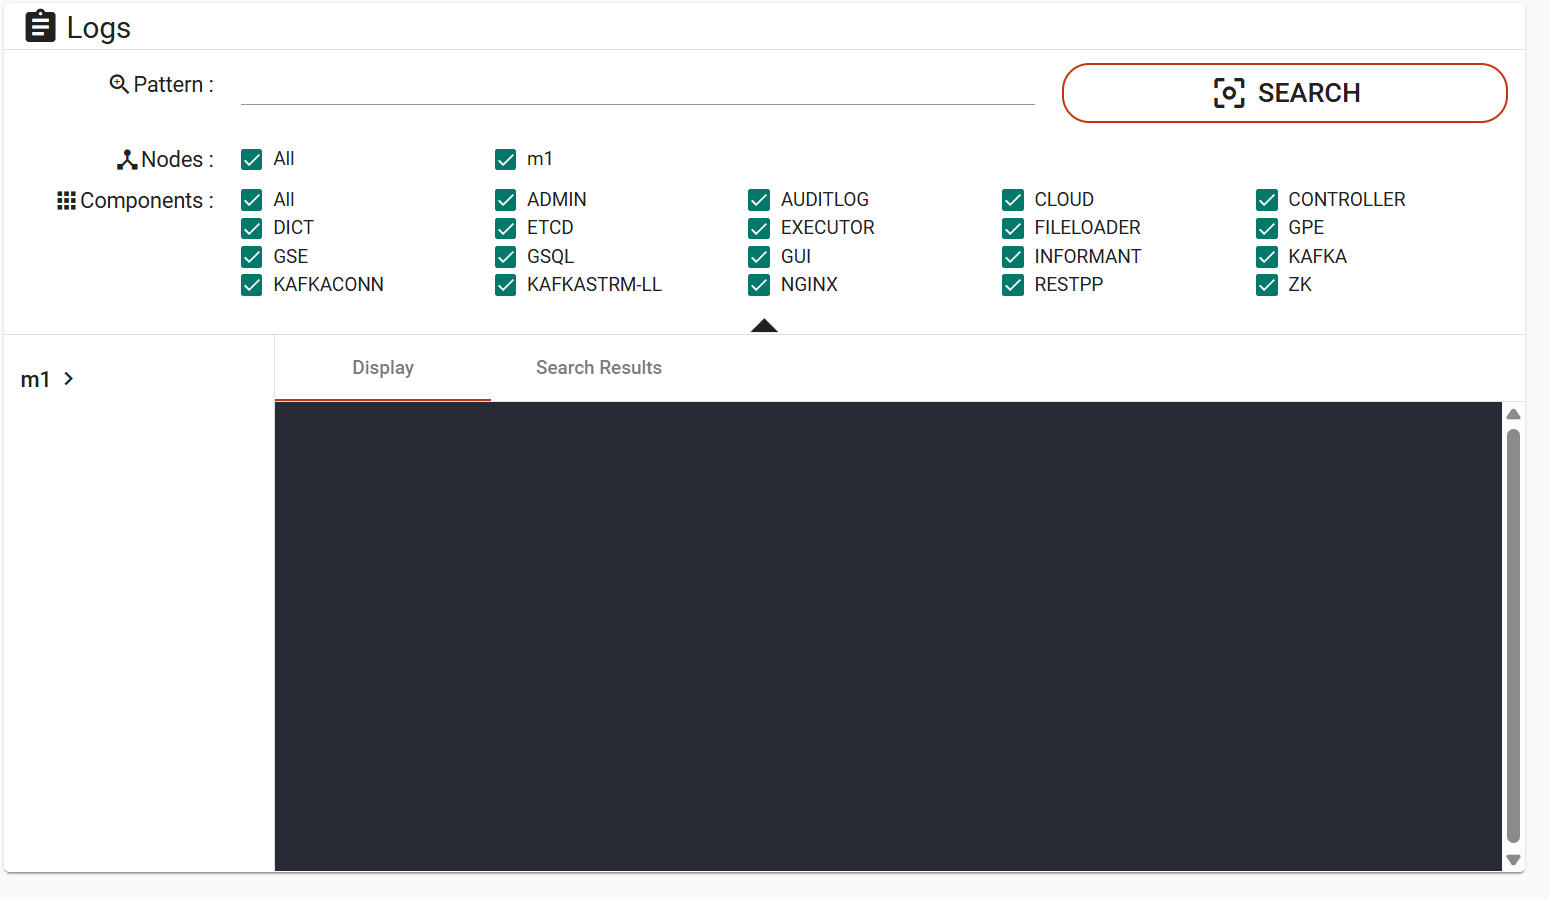
The Logs page contains a search panel, a file directory panel, and a content panel. The content panel can display log content or search results. You can browse log files by node and component, search logs across selected nodes and components, and download log files for offline analysis.
|
Due to IP address blocking, an error message may appear if you have an ad blocker installed on your browser. Please turn off your ad blocker when using Admin Portal. |
Open a log file from the file directory
In the file directory panel, log files are organized by node and component. Expand a node to view its components, and then expand a component to view the available log files.
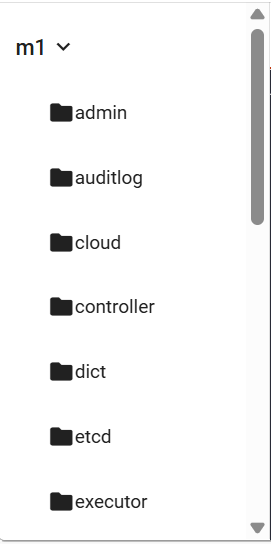
Node and component selection |
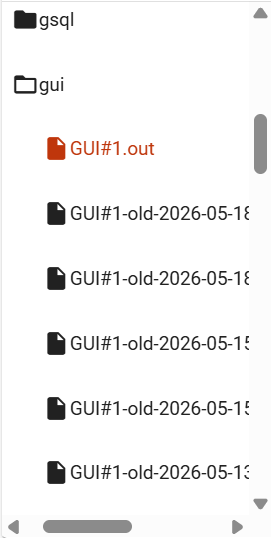
Log file selection |
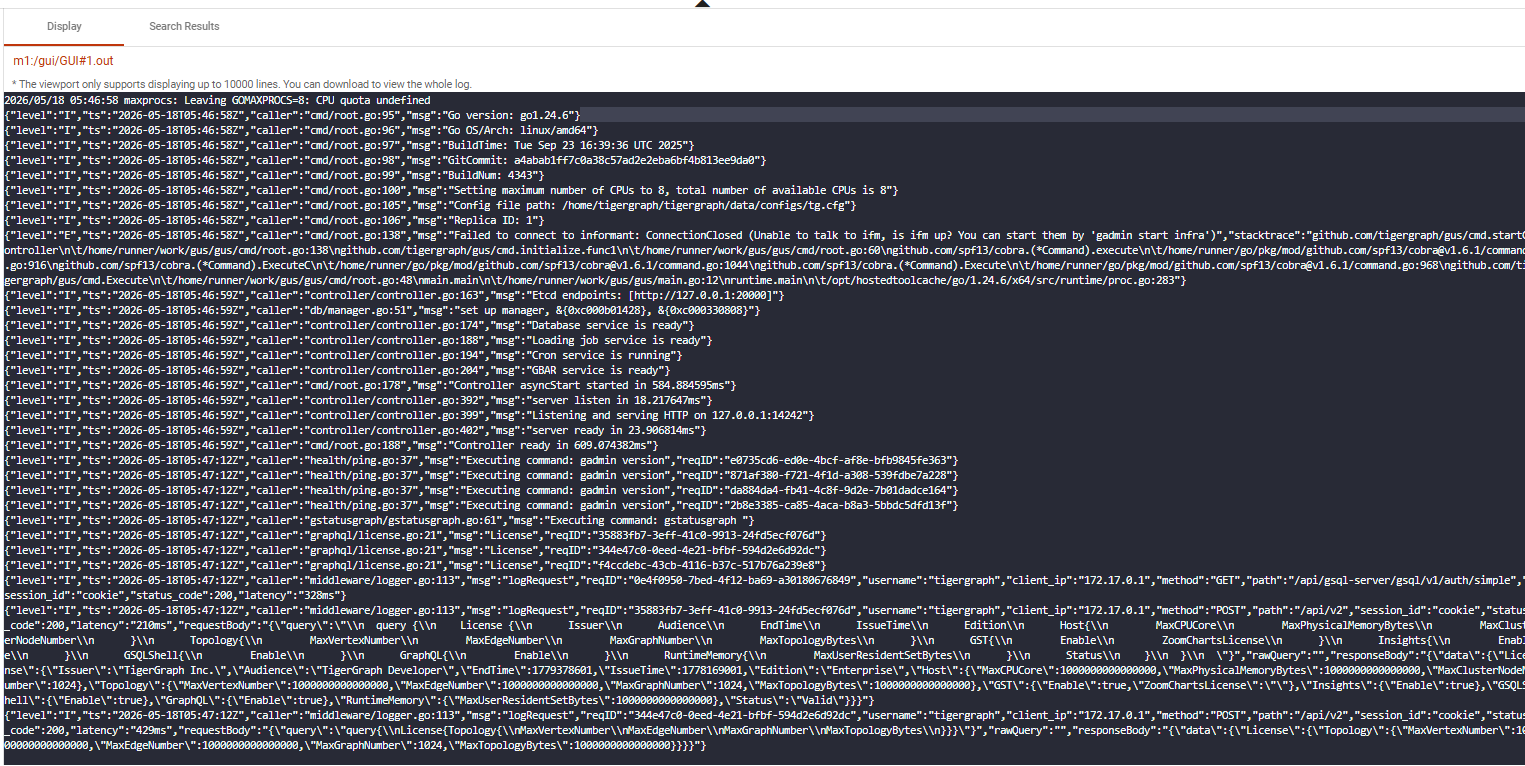
Choose a log file by clicking on it, and the content will be shown in the display panel.
The title shows the machine ID and the path of the opened log file. To the right, there is a download button  for downloading the selected log file.
The display panel shows the latest available log content and automatically refreshes as new log entries are generated.
|
Note that the display panel will only show the tail end of the chosen log file, up to 32 MB. If you wish to read the entire log file, download the file. |
Search logs
If your browser window is wide, you will see the search panel at the top.
If your browser window is narrow, the search panel collapses. Click the  button to open it.

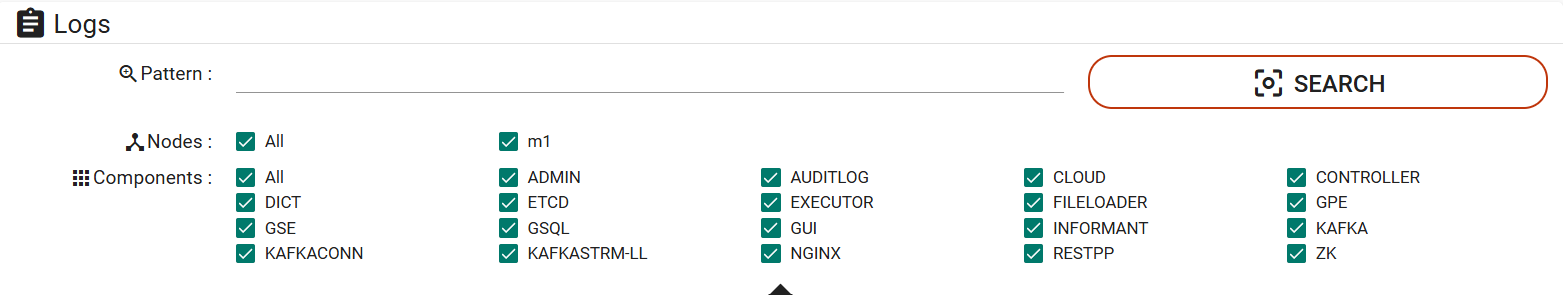
In the search panel, you can specify the following search criteria:
-
Pattern
-
One or more nodes
-
One or more components
Without a pattern and at least one node and one component selected, the search will not be performed.
Use the expand  or collapse
  buttons for more space to view the log content, if necessary.
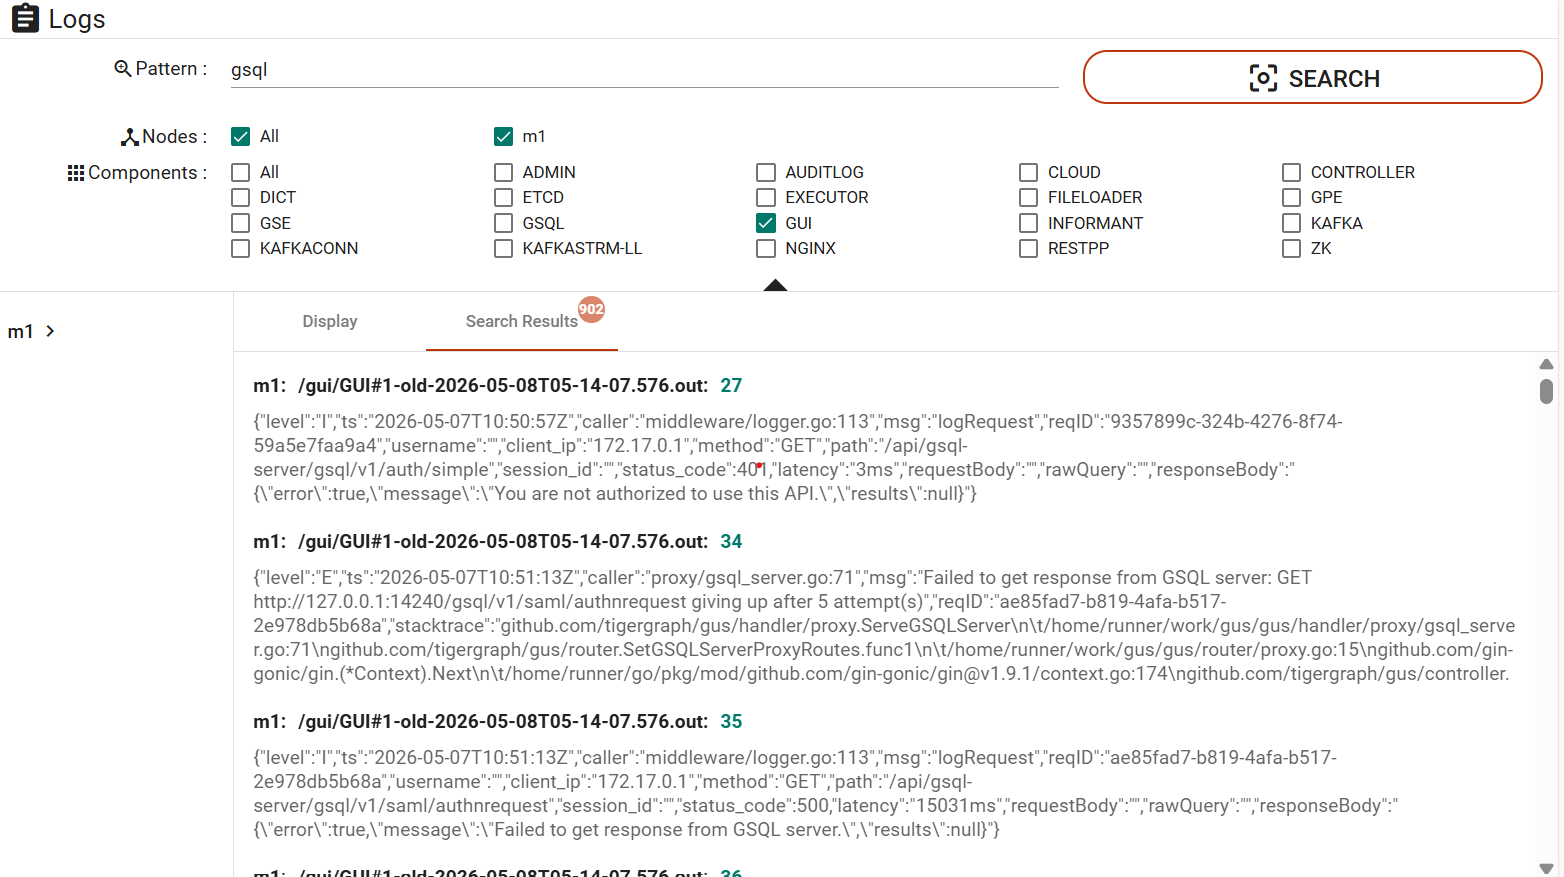
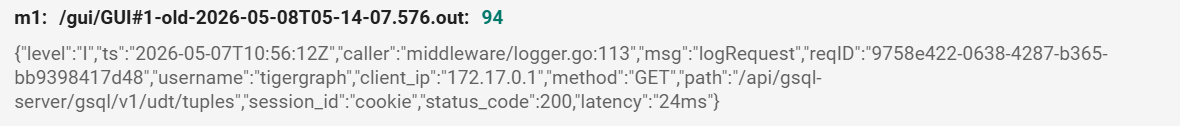
The title of each search result contains the machine ID, the file path, and the line number where the matching content was found. Matching log entries are displayed below each result.
Clicking a search result opens the corresponding log file in the display panel and highlights the matching log line.
-new.png)
Read-Only Access to Logs
As of version 4.1, TigerGraph introduces the ability to grant application developers read-only access to logs. This feature enables developers to:
-
Debug: Identify and resolve issues using system and GSQL query logs.
-
Optimize Queries: Analyze logs to fine-tune queries for better performance.
-
Monitor System Health: Track system activity without requiring administrative intervention.
Developers can access logs through:
-
GraphStudio: A user-friendly interface with log viewing, searching, and downloading features.
-
TigerGraph Cloud Portal: Allows developers to monitor and debug logs in real time.
Privileges
The following privileges control access to logs in TigerGraph:
APP_ACCESS_LOG Privilege
APP_ACCESS_LOG privilege grants authorized users global read-only access to logs via GraphStudio or the Cloud Portal.
| Privilege Name | Object | Plural Objects | Scope | Default Roles |
|---|---|---|---|---|
APP_ACCESS_LOG |
LOG |
LOGS |
GLOBAL |
superuser, globaldesigner |
READ_LOG Privilege
The READ_LOG privilege grants read-only access to logs, preventing modifications while enabling monitoring and debugging.
| Privilege Name | Object | Plural Objects | Scope | Default Roles |
|---|---|---|---|---|
READ_LOG |
LOG |
LOGS |
GLOBAL |
None |
Access Points
Users with the appropriate privileges can access logs through GraphStudio or the TigerGraph Cloud Portal:
-
View Logs: Access real-time updates for GSQL query logs and system logs.
-
Search Logs: Use the search panel to filter logs by patterns, nodes, and components.
-
Download Options: Download log files for offline analysis to identify and resolve issues effectively.
|