Queries
The Query monitoring page gives detailed information about the queries running on a cluster and their performance.
Access control
In 4.2.3, access to the Query Monitoring page is controlled by user privileges instead of roles.
-
The Monitor > Queries menu is visible only to users with
READ_DATAprivilege on at least one graph.-
Users with global
READ_DATAprivilege or superuser access can view queries across all graphs, which are listed under the All option in the graph dropdown. -
Users with
READ_DATAprivilege on specific graphs can view queries only for those graphs and do not see the All option in the graph dropdown.
-
-
Users with
DELETE_DATAprivilege for a graph can abort queries running on that graph.
|
If a user does not have READ_DATA privilege on any graph, the page displays an error message indicating that they lack the required privilege. |
Overview
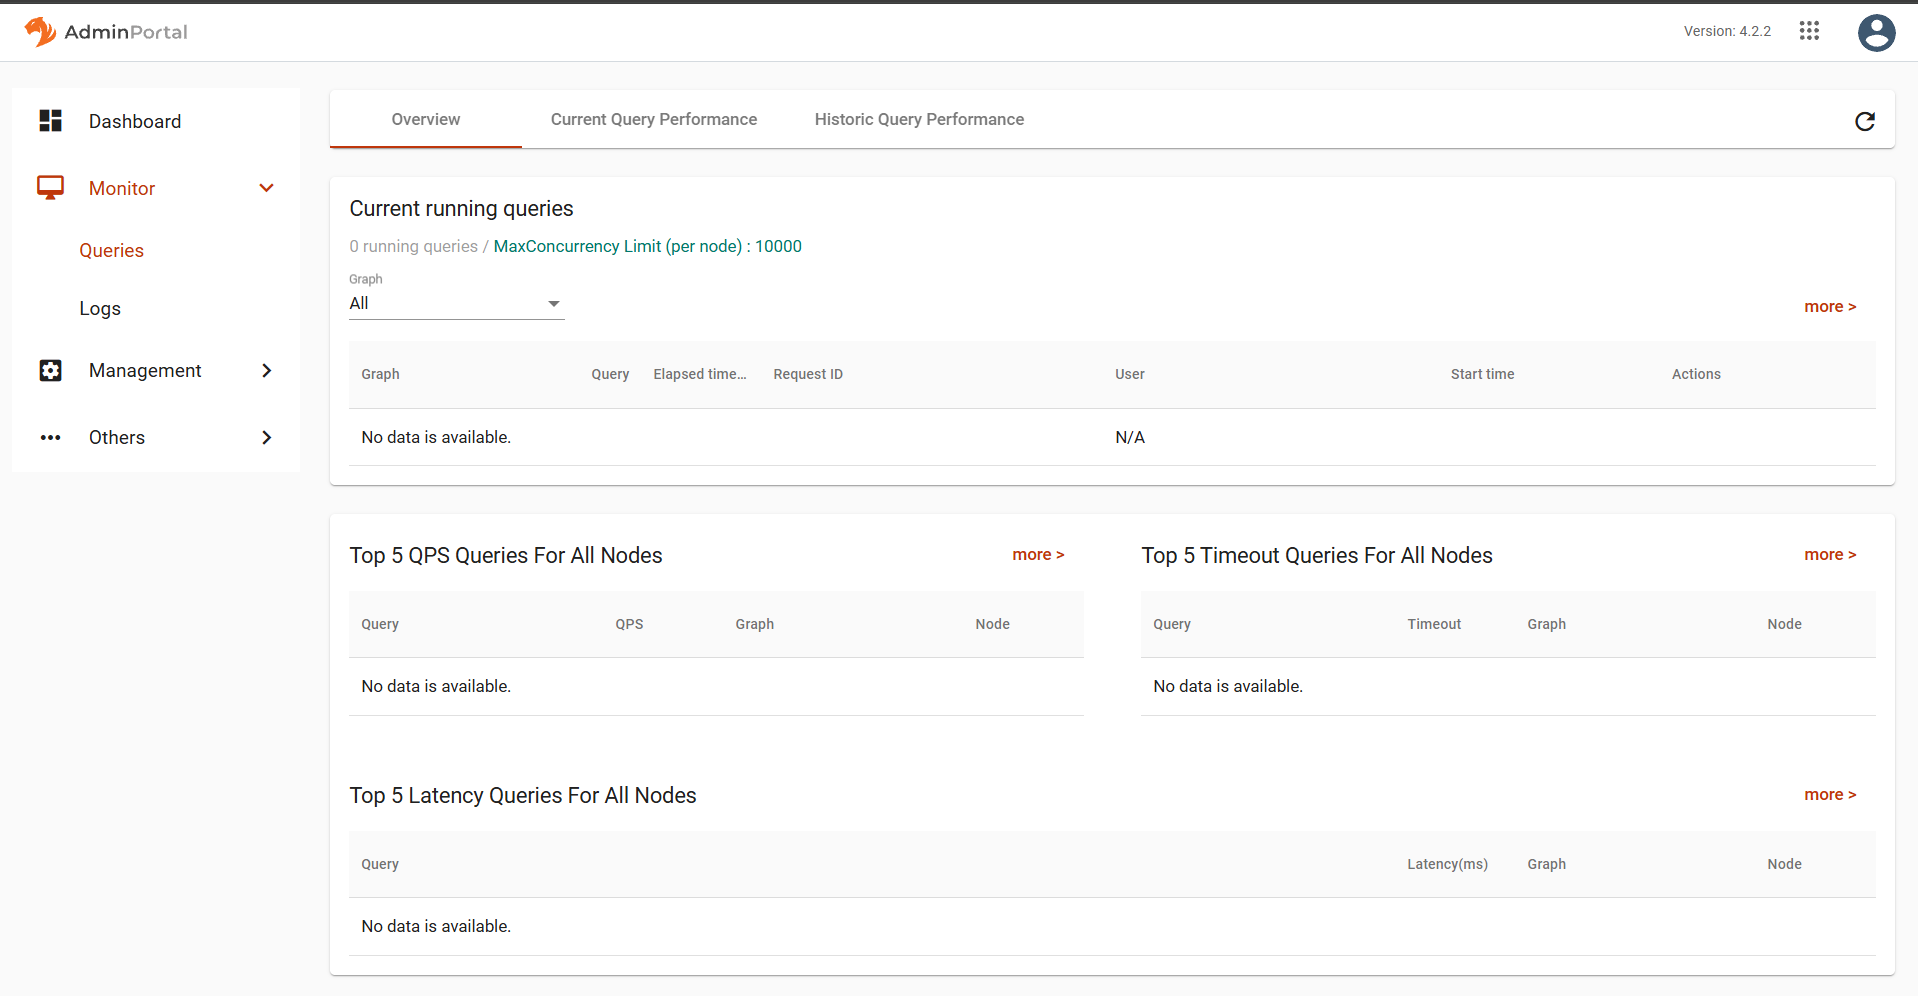
In the Overview tab, you can view currently running queries broken down by node and graph. In the Action column for each query, there are buttons to view the individual query history and to stop the query entirely.
You can also the top queries ranked by QPS (queries per second), timeout (fraction of the query calls which timed out and therefore did not finish), and latency (minimum, maximum, and average time to complete a query).
The sections in the Overview tab show the queries in each section over the last fifteen minutes.
At any point, click the Refresh icon in the upper right corner of the page to refresh the view with the latest statistics.