
TigerGraph
ResourcesPathfinderDiscord(opens in a new tab)
Resources

Everything, In One Wall

Videos, courses, hands-on tutorials, docs, and blog posts. One place for every phase of learning.

TigerGraph
ResourcesPathfinderDiscord(opens in a new tab)

© 2026 Tiger Graph Dev Hub. All rights reserved.

  • Privacy Policy|
  • Terms of Service

Applied · 2

Clear all
  • #Evaluating graph
  • #Performance and scale

Levels

  • All Resources
  • Beginner
  • Intermediate
  • Advanced

Categories

  • Videos514
  • Docs644
  • Glossary50
  • Blog posts222

Assets

  • Definition36
  • Tutorial113
  • How-to guide319
  • Reference312

Tags

  • #Fraud and AML
  • #Entity resolution
  • #Recommendations
  • #GraphRAG and AI
  • #Graph machine learning
  • #Search
  • #Network analysis
  • #Performance and scale
  • #Running TigerGraph
  • #Evaluating graph

95 resources · page 2 of 8

NewestOldest
3 Col Grid2 Col GridList
AdvancedArticleJul 17, 2026

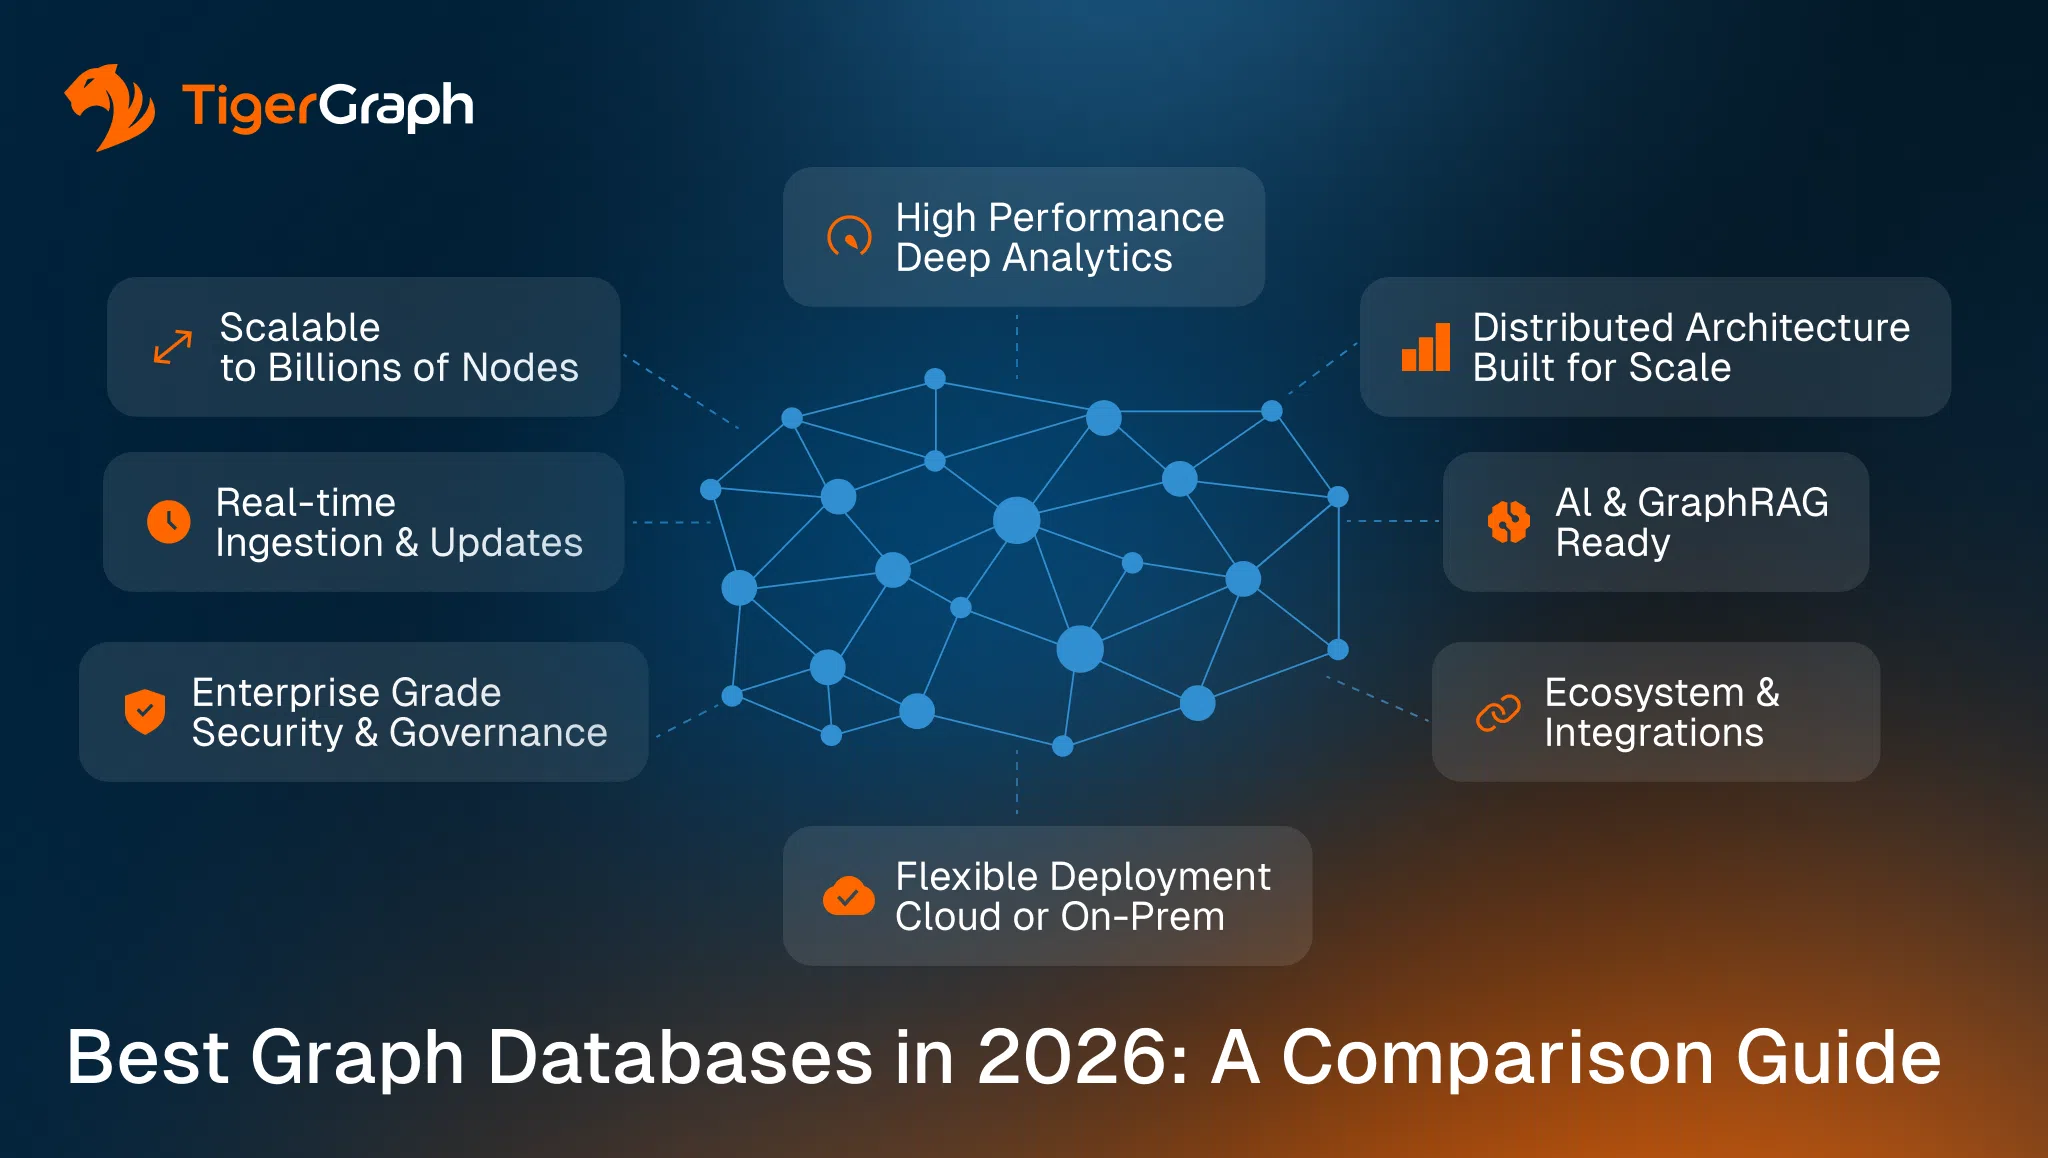
Best Graph Databases in 2026: A Comparison

Code & samples
126
  • Graph Resources52
  • Concept
    109
  • Troubleshooting12
  • Security advisory4
  • Runbook
  • Article173
  • Case study26
  • Talk298
  • Release note24
  • Demo114
  • Webinar12
  • Event12
  • Report24
  • Comparing the best graph databases in 2026? This guide covers TigerGraph, Neo4j, Neptune, and more – with use-case fit, pricing, and architecture tradeoffs.
    Discover
    AdvancedRelease noteJul 15, 2026

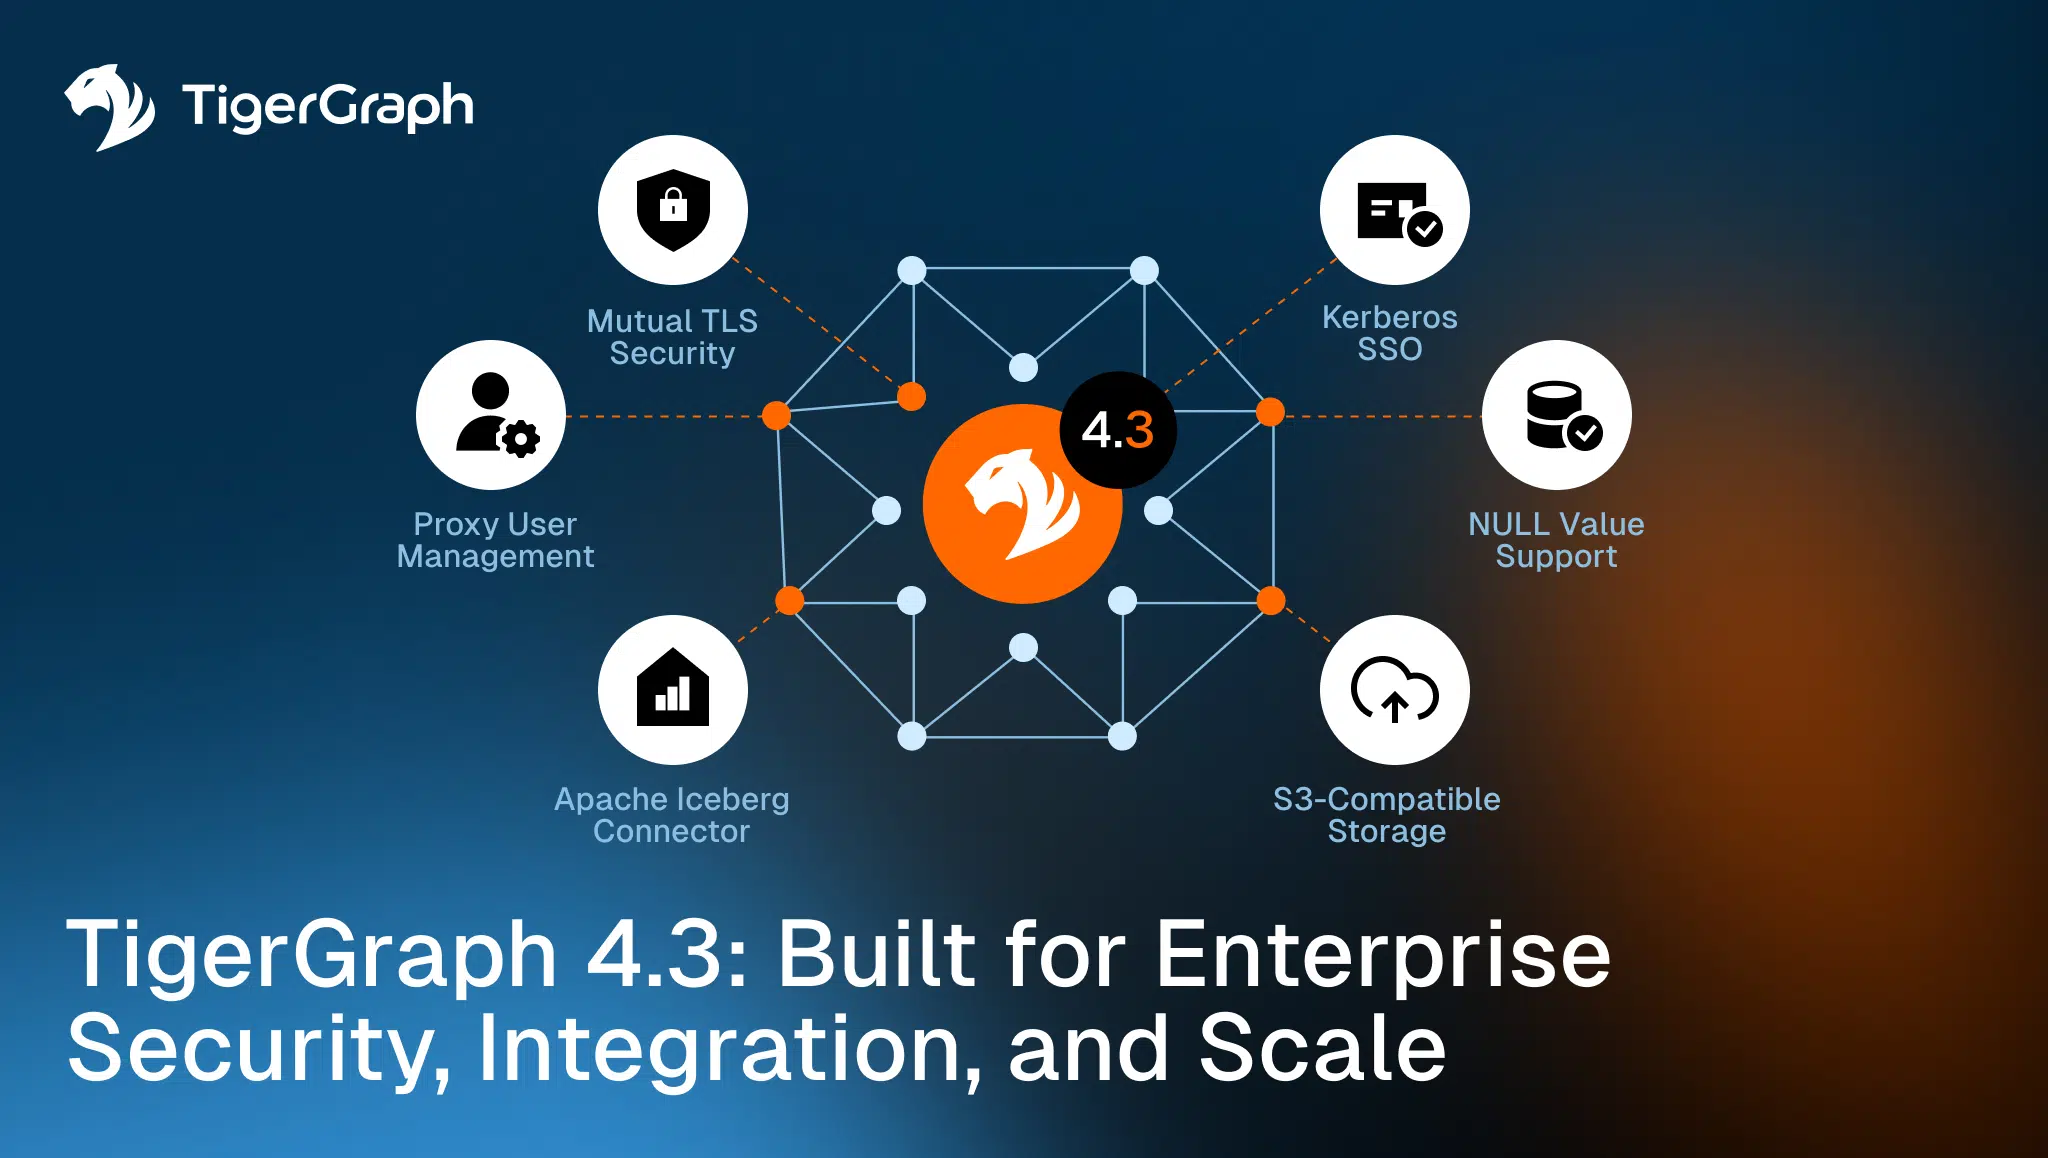
    TigerGraph 4.3: Built for Enterprise Security, Integration, and Scale

    Graph is becoming a core part of enterprise data and AI architecture. The next phase of graph adoption will not be determined only by what graph technology can do. It will be determined by how securely and seamlessly graph can operate within the enterprise. The real

    Discover
    ArticleJun 23, 2026

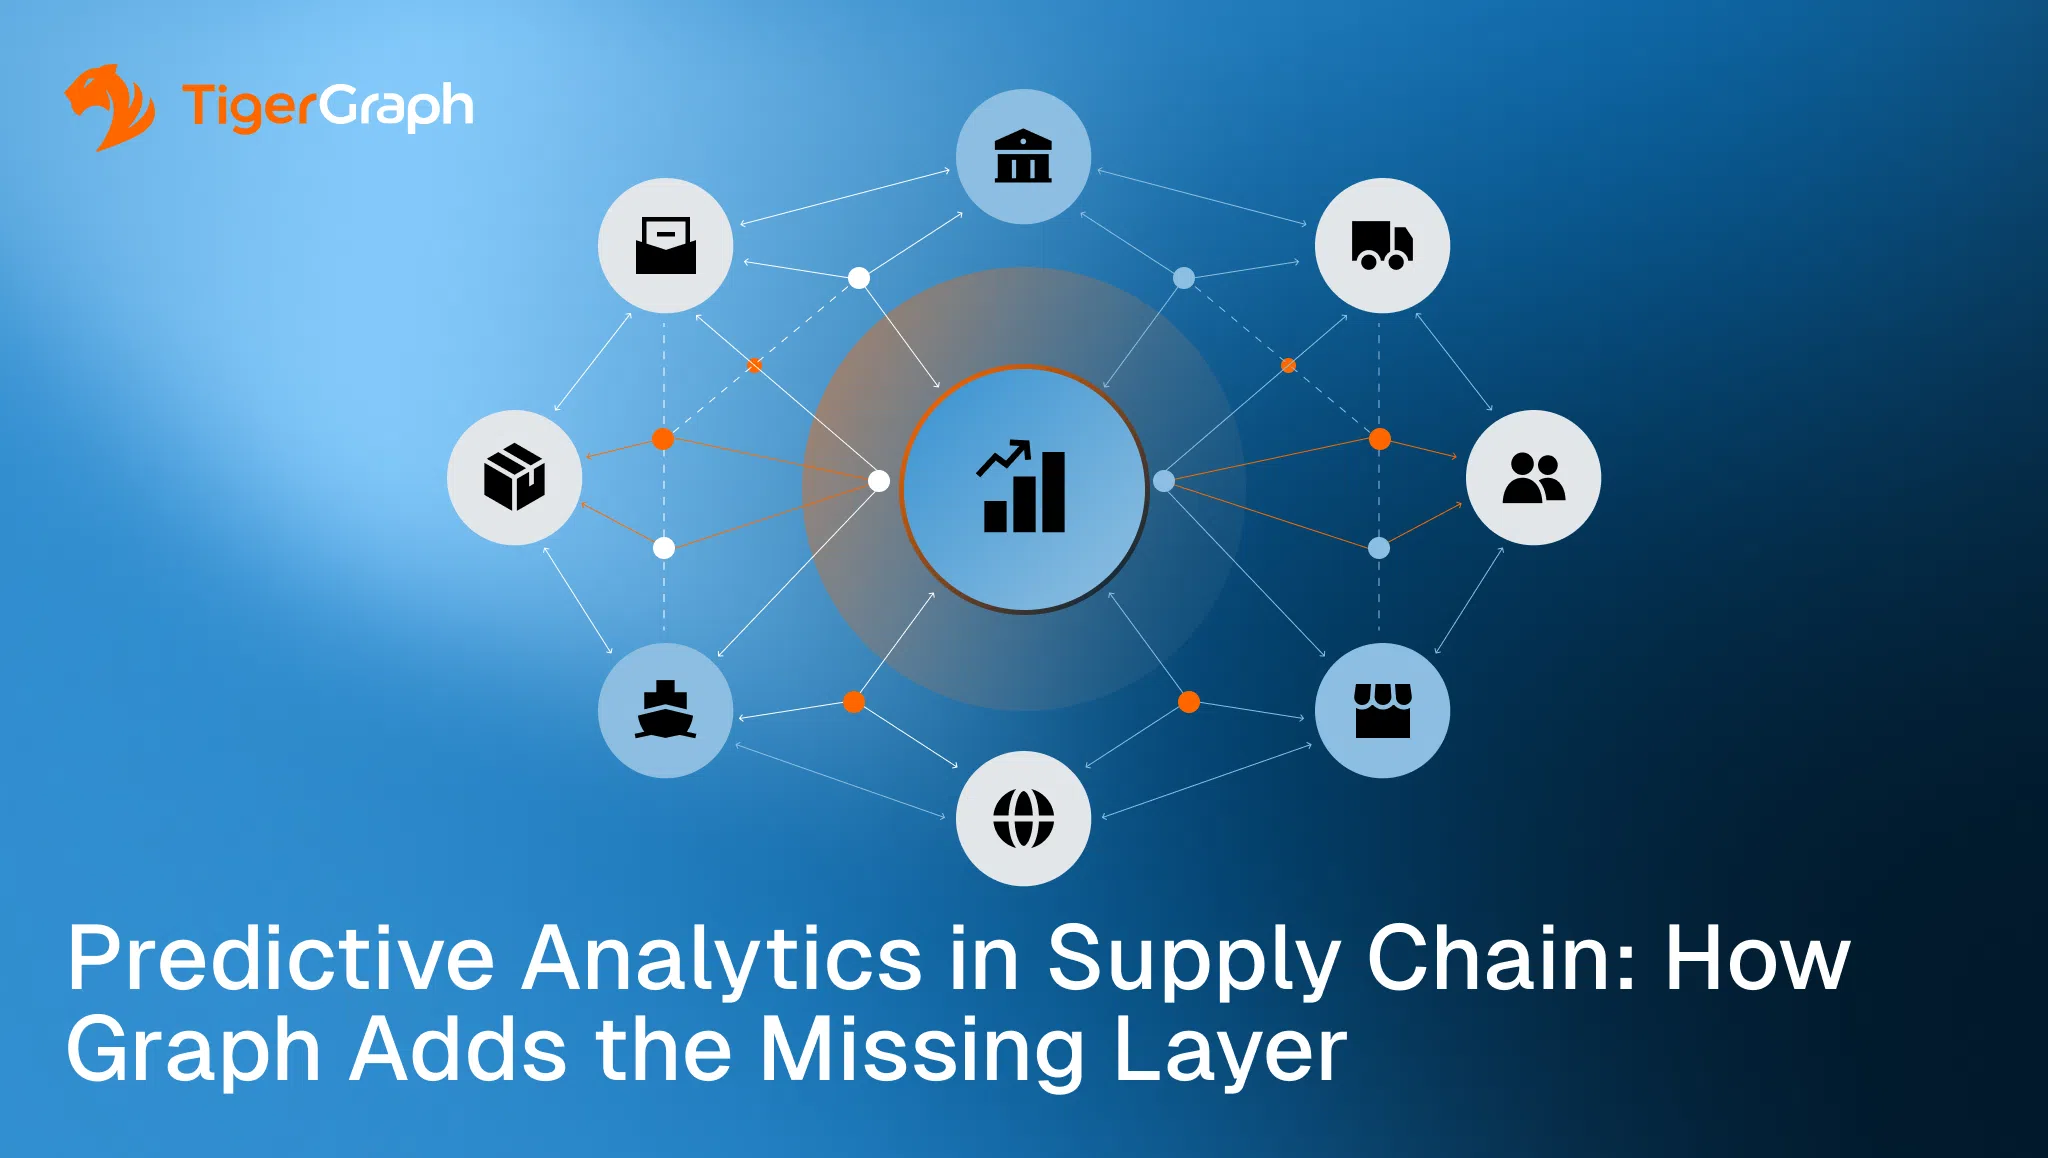
    Predictive Analytics in Supply Chain: How Graph Adds the Missing Layer

    Learn how graph databases add the missing layer to supply chain predictive analytics: multi-tier risk, cascade modeling, and AI-enriched forecasting at scale.

    Discover
    AdvancedArticleApr 18, 2026

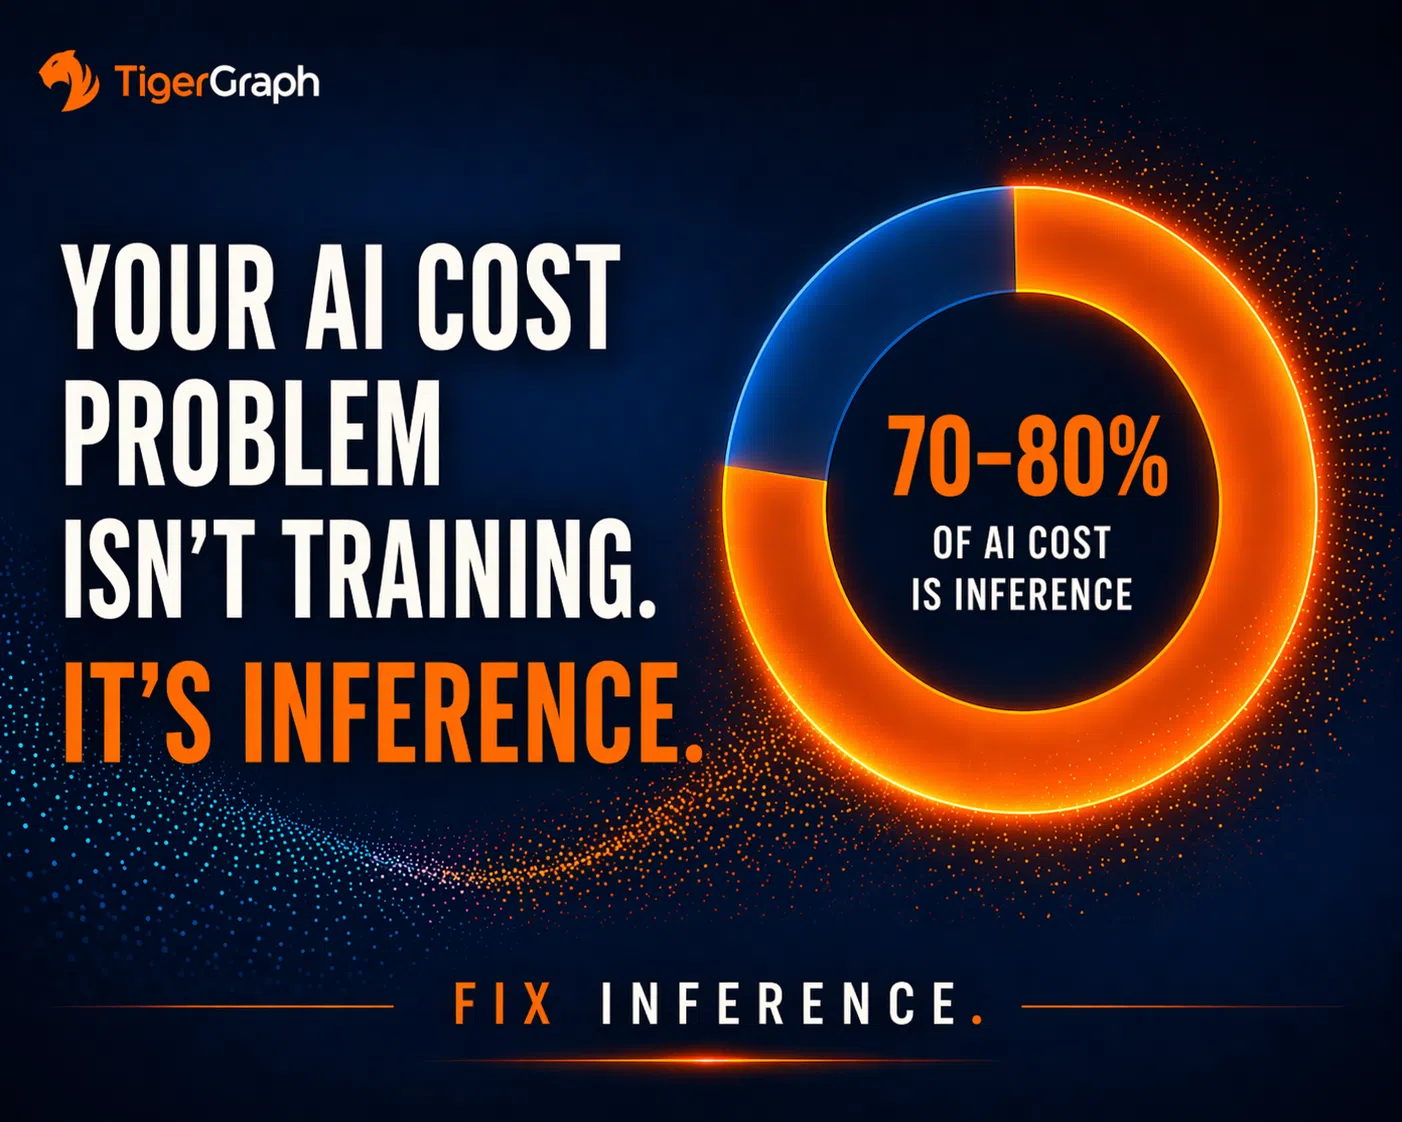
    Your AI Cost Problem Isn’t Training. It’s Inference.

    Training gets the headlines because it is visible, expensive, and easy to measure. It is where GPUs are purchased, clusters are built, and model benchmarks are set. But once a model is deployed, training largely disappears from the day-to-day reality of an enterprise system. Inference does not.

    Discover
    ArticleApr 16, 2026

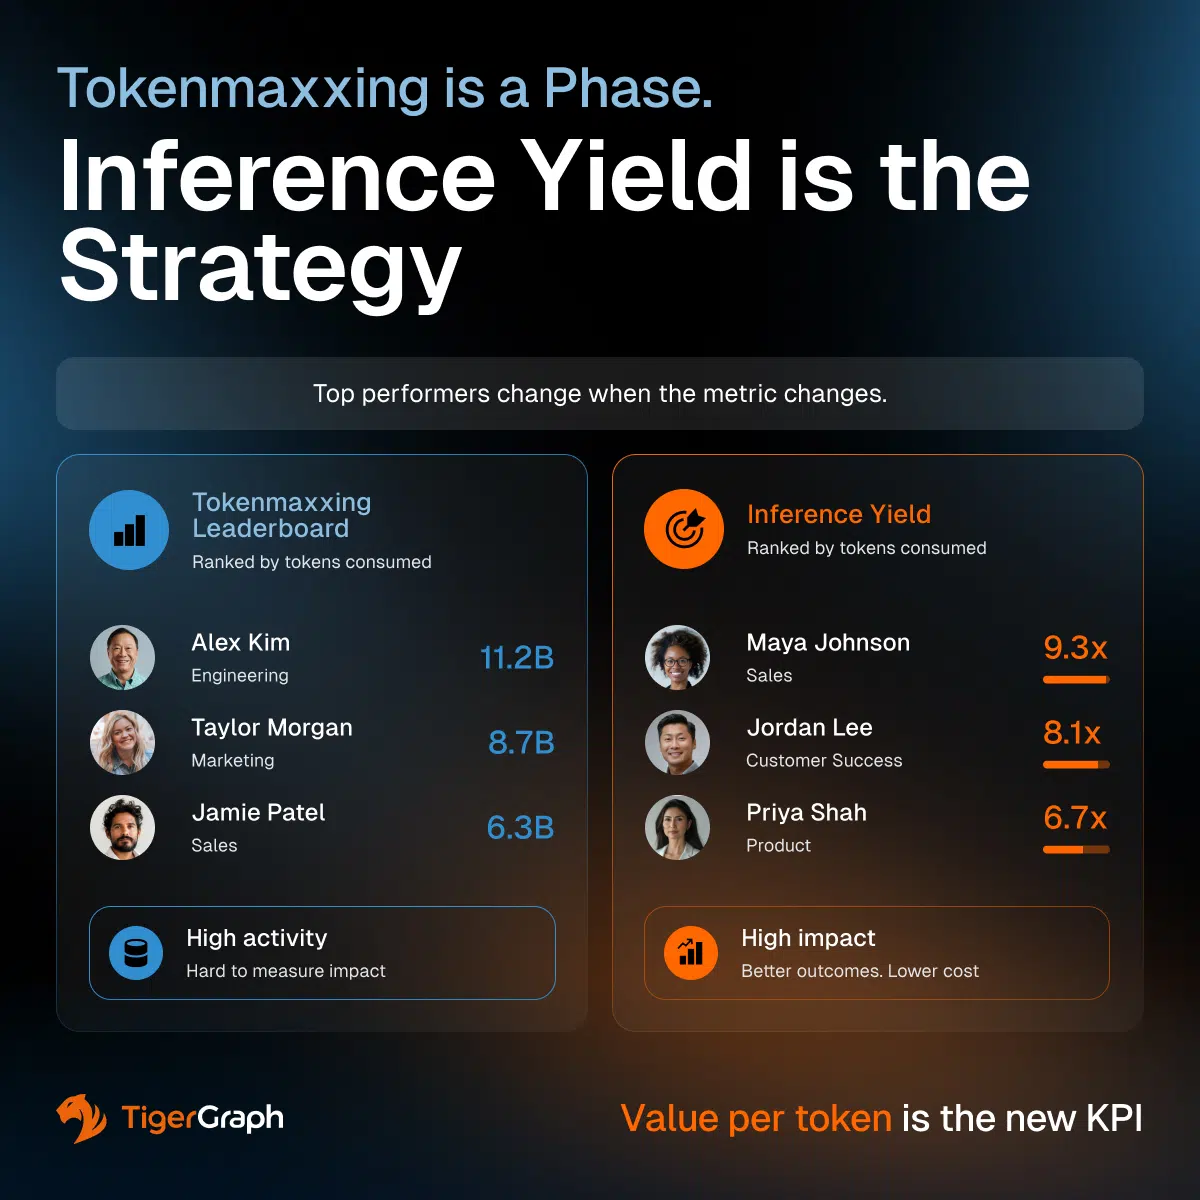
    Tokenmaxxing is a Phase. Inference Yield is the Strategy.

    Why the Next AI Race Won’t Be Won by the Companies That Burn the Most Tokens A new behavior is emerging inside enterprise AI. Companies are ranking employees based on how many AI tokens they consume: leaderboards, incentives, even internal competition. It may sound extreme. It’s not.

    Discover
    AdvancedArticleApr 13, 2026

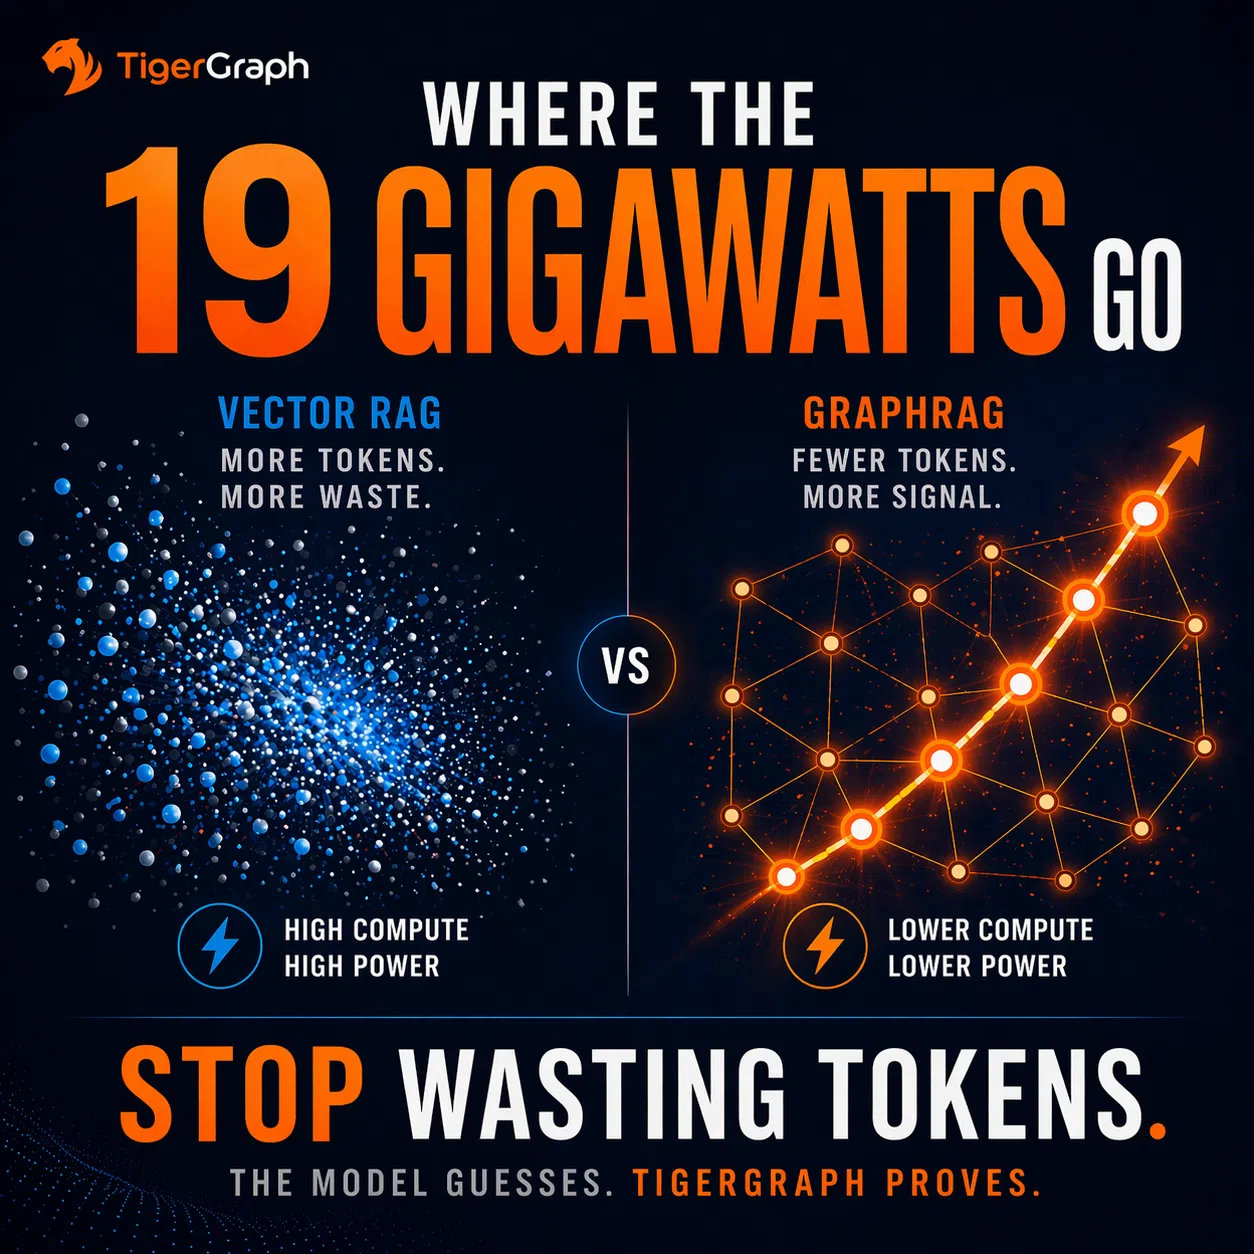
    AI Is Facing a 19-Gigawatt Power Gap. Here’s the Fix.

    The AI revolution has officially hit a physical wall. As the Wall Street Journal reports “ AI Is Using So Much Energy That Computing Firepower Is Running Out”companies are already rationing compute, facing outages, and making real-time product tradeoffs as demand for tokens and GPUs

    Discover
    BeginnerHow-to guideJan 8, 2026

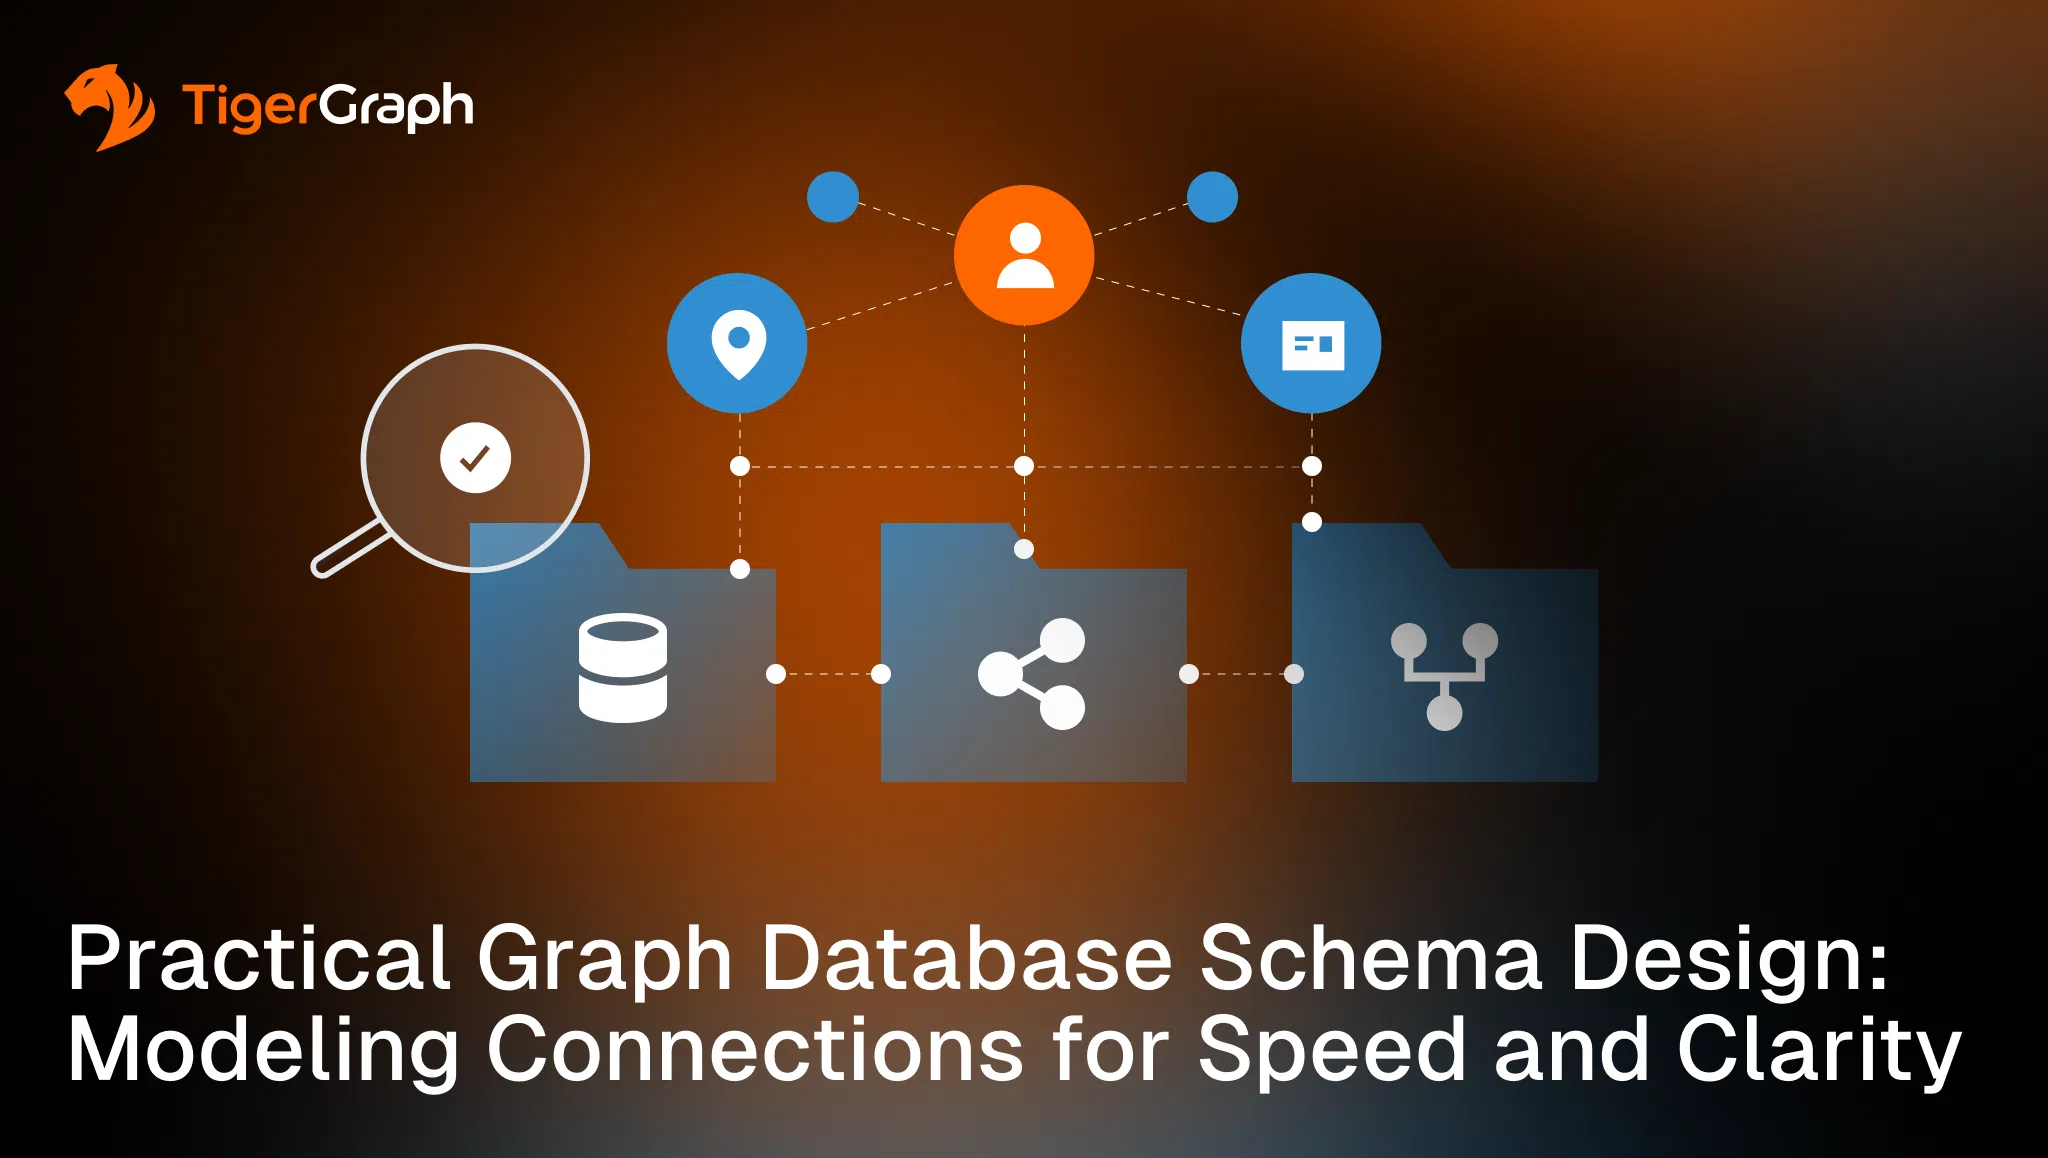
    Practical Graph Database Schema Design: Modeling Connections for Speed and Clarity

    High-Performance Graph Database Schema Design for Connected Data | TigerGraph A graph database schema defines the structure of data, including the entities in the domain, the connections between them, and the rules that shape those connections. It acts as the blueprint for how information is stored and how traversal should behave. A clear schema makes

    Discover
    BeginnerConceptJan 8, 2026

    RDF vs. Property Graph: Choosing the Right Foundation for Knowledge Graphs

    Every organization that builds a knowledge graph faces the same architectural crossroads at some point. Should the system use RDF for semantic precision, or a property graph for analytical performance? This choice determines so much, like how relationships are represented and how queries scale.

    Discover
    AdvancedArticleDec 10, 2025

    Time Series Database Fundamentals in Modern Analytics

    A time series database organizes data by timestamp and captures how values evolve across continuous intervals. It is a core component of monitoring, forecasting, and large-scale operational analysis. This article describes how time series databases function, where they perform best, and where they require additional context, and it

    Discover
    AdvancedArticleNov 5, 2025

    Connected Risk in Banking: How Graph Databases Build Resilience for Banks

    Why Connected Risk Is the Next Banking Imperative Banking leaders recognize that risks do not operate in silos. A fraudster opening accounts in one channel may launder funds through another. A compliance gap in one business line may expose systemic weaknesses across the enterprise. Cyber intrusions can spread through third-party vendors. Traditional tools are designed

    Discover
    BeginnerConceptOct 20, 2025

    The Power of Graph Relationships: Turning Isolated Data into Connected Insights

    Enterprises do not suffer from a lack of data, but they do suffer from data silos and a lack of connection. Context is lost. Adding relationships to the data solves this problem. Graph relationships map how people, accounts, devices, suppliers, and policies interact. And

    Discover
    AdvancedArticleOct 15, 2025

    How to Make the CFO Business Case for Graph Database

    Every CFO is charged with balancing three imperatives: reduce costs, manage risk, and enable growth. In banking, those imperatives are under acute stress. Financial crime is accelerating, with fraud losses projected to exceed $43 billion globally within five years. Regulators are levying record fines for

    Discover
    1234…8