Contact Us
Back to Blog

Paige Leidig

Chief Marketing Officer

Paige brings over 20 years of experience in enterprise marketing leadership, with a strong background in brand building, driving growth, product and customer marketing. As Chief Marketing Officer, he leads our marketing efforts to increase brand awareness, communicate our unique value proposition, drive growth across key markets, and showcase the positive impact we deliver to our customers. Prior to joining TigerGraph, Paige has held executive marketing leadership roles at several notable and category defining organizations, including SIMCO Electronics, Simpplr, Quid, CipherCloud, SAP, and Ariba. Paige holds a MS in Finance from the University of Houston and a BS in Chemistry from Davidson College (alma mater of basketball star Steph Curry). In his spare time he likes to travel and surf all over the world, go hiking in the sierras, play squash, do CrossFit, and spend time with family and friends.

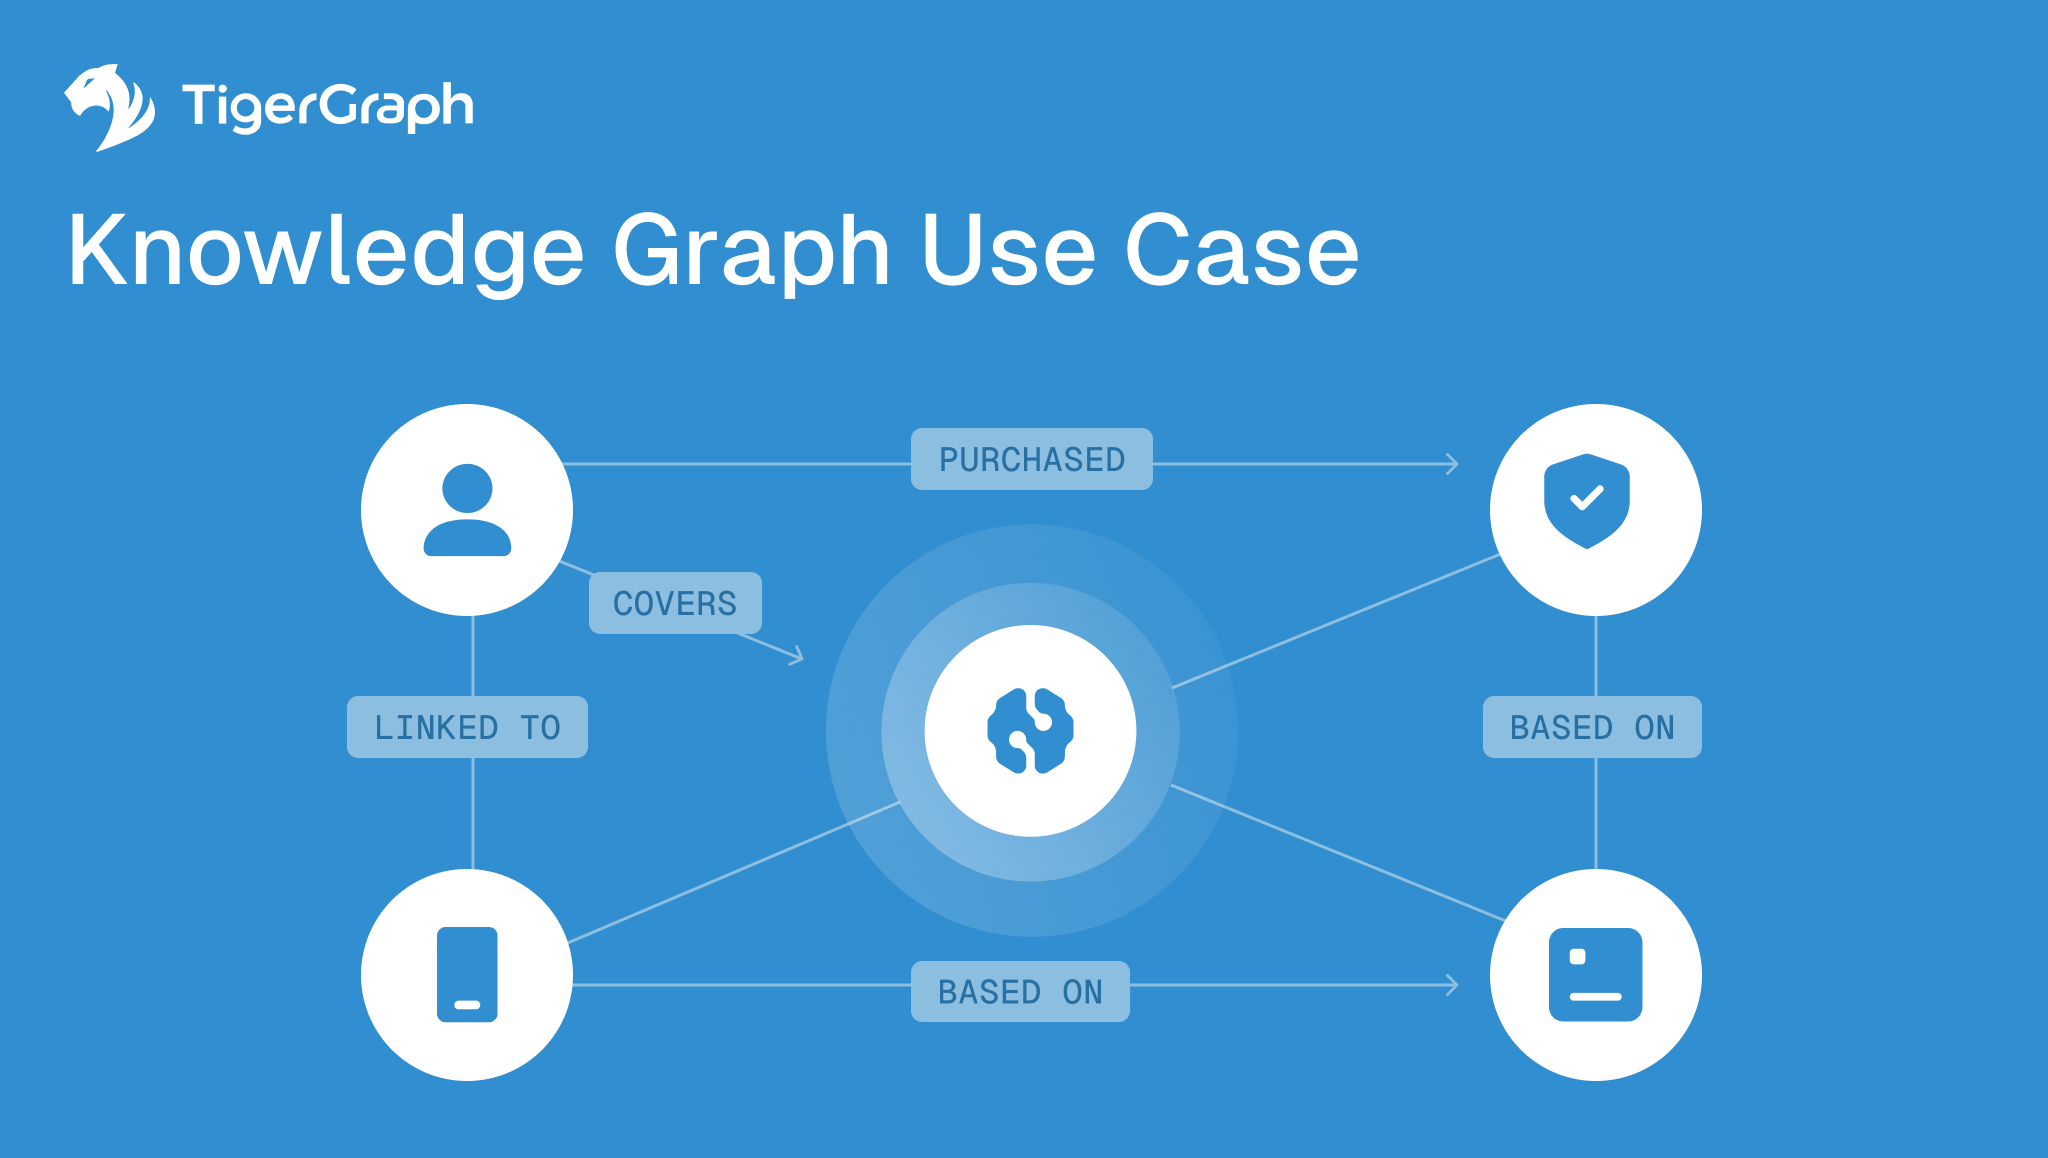
A diagram titled Knowledge Graph Use Case by TigerGraph shows icons representing a person, a product, a checklist, and a document, connected by labeled arrows such as purchased, covers, linked to, and based on.
How Knowledge Graphs Reveal Meaning Hidden in Enterprise Data
Discover
A network diagram showing icons for reducing costs, managing risk, and enabling growth, with a central orange icon for financial growth. Text: Make the Business Case for Graph to Your CFO. TigerGraph logo in top left.
How to Make the CFO Business Case for Graph Database
Discover
A table lists customer transactions and device IDs on the left. On the right, a network diagram shows people and IP nodes connected, illustrating relationships. The title reads Graph Algorithm with the TigerGraph logo above.
Graph Algorithms: The Secret Engine Behind Faster, Smarter Business Growth
Discover
A blue infographic titled Graph Agentic Behavior – Context Memory Relationship Reasoning shows a simple output flow on the left and a system of interconnected circles labeled USER, BEHAVIOR, SYSTEM, and BUSINESS RULES on the right. TigerGraph logo is at the top left.
Graph-Powered Agentic AI. Real-Time Context and Reasoning
Discover
A diagram showing entity resolution: on the left, a person icon connects to various icons with MATCH SCORING. On the right, more connections and an alert icon appear under CONTEXTUAL ER. TigerGraph logo is at the top left.
Contextual Entity Resolution in Banking – Beyond Just Matching 
Discover
Diagram showing two networks of connected user icons. The left side is labeled Fraud Network, while the right highlights a central user as Centrality Reveals the Kingpin. Text reads: Why Graph Centrality Measures Detect Fraud Faster.
Why Graph Centrality Measures Detect Fraud Faster
Discover
Diagram comparing flat and graph models for fraud detection. Left: isolated flat icons (money, warning, mask). Right: interconnected graph network with similar icons, highlighting complex relationships. TigerGraph logo in top left.
Shape-shifting Fraud Flat Models Miss
Discover
Blue graphic with network nodes connected to a central circle labeled AI, surrounded by document icons. TigerGraph logo and text: Using Graph Context to Secure Autonomous AI Agents appear on the image.
Using Graph Context to Secure Autonomous AI Agents
Discover
Show More