Summary
- Most Customer 360 initiatives consolidate customer records into a central repository but flatten the relationships that make those records meaningful: household membership, product journeys, shared devices, and referral chains disappear into wide tables.
- A graph database stores the customer view as a live, queryable network of identifiers, accounts, transactions, devices, and interactions, and answers multi-hop relationship queries across that network in milliseconds.
- CDPs and data warehouses are built for record consolidation and audience activation. A graph database adds the relationship layer that those platforms cannot build natively: real-time identity resolution, household analytics, and network-aware segmentation.
- A graph database for Customer 360 becomes the right complement to your existing stack when your queries require following chains of relationships across multiple entity types, household, device, product, journey, faster than a relational join can deliver at production scale.
- The most effective enterprise Customer 360 architectures combine a CDP or warehouse for record management and activation with a graph database for relationship intelligence and real-time decisioning..
Your Customer 360 dashboard consolidates what you know about customers. But it probably drops the relationships that make that knowledge actionable. If you can answer “what products does this customer hold?” but not “which household members are likely to churn together, and what is the fastest path to retaining them?”, your 360 view is built on a flat model that cannot reach the questions where customer value actually lives.
The structural reason is straightforward: warehouses and CDPs are built on relational or tabular models. They resolve a single customer record well. However, they struggle with the multi-hop relationship queries that drive next-best-action recommendations, household retention analytics, and real-time personalization at the touchpoint, because those queries require following chains of connections across entities, and relational joins become slow and expensive as the relationship depth increases.
A graph database for Customer 360 stores the customer view as a network and queries it as a network. That structural difference is what makes it the right complement, not replacement, for your existing CDP or warehouse stack.
You’ll learn:
- Why traditional Customer 360 architectures lose the relationships that drive customer value
- What graph databases add specifically to identity resolution, journey analytics, and real-time decisioning
- How graph compares with CDP and warehouse-based approaches across key dimensions
- How graph and AI combine to power personalization, churn prediction, and explainable recommendations
- Where graph-powered Customer 360 applies across banking, retail, telecom, insurance, and B2B
What Is a Graph Database for Customer 360?
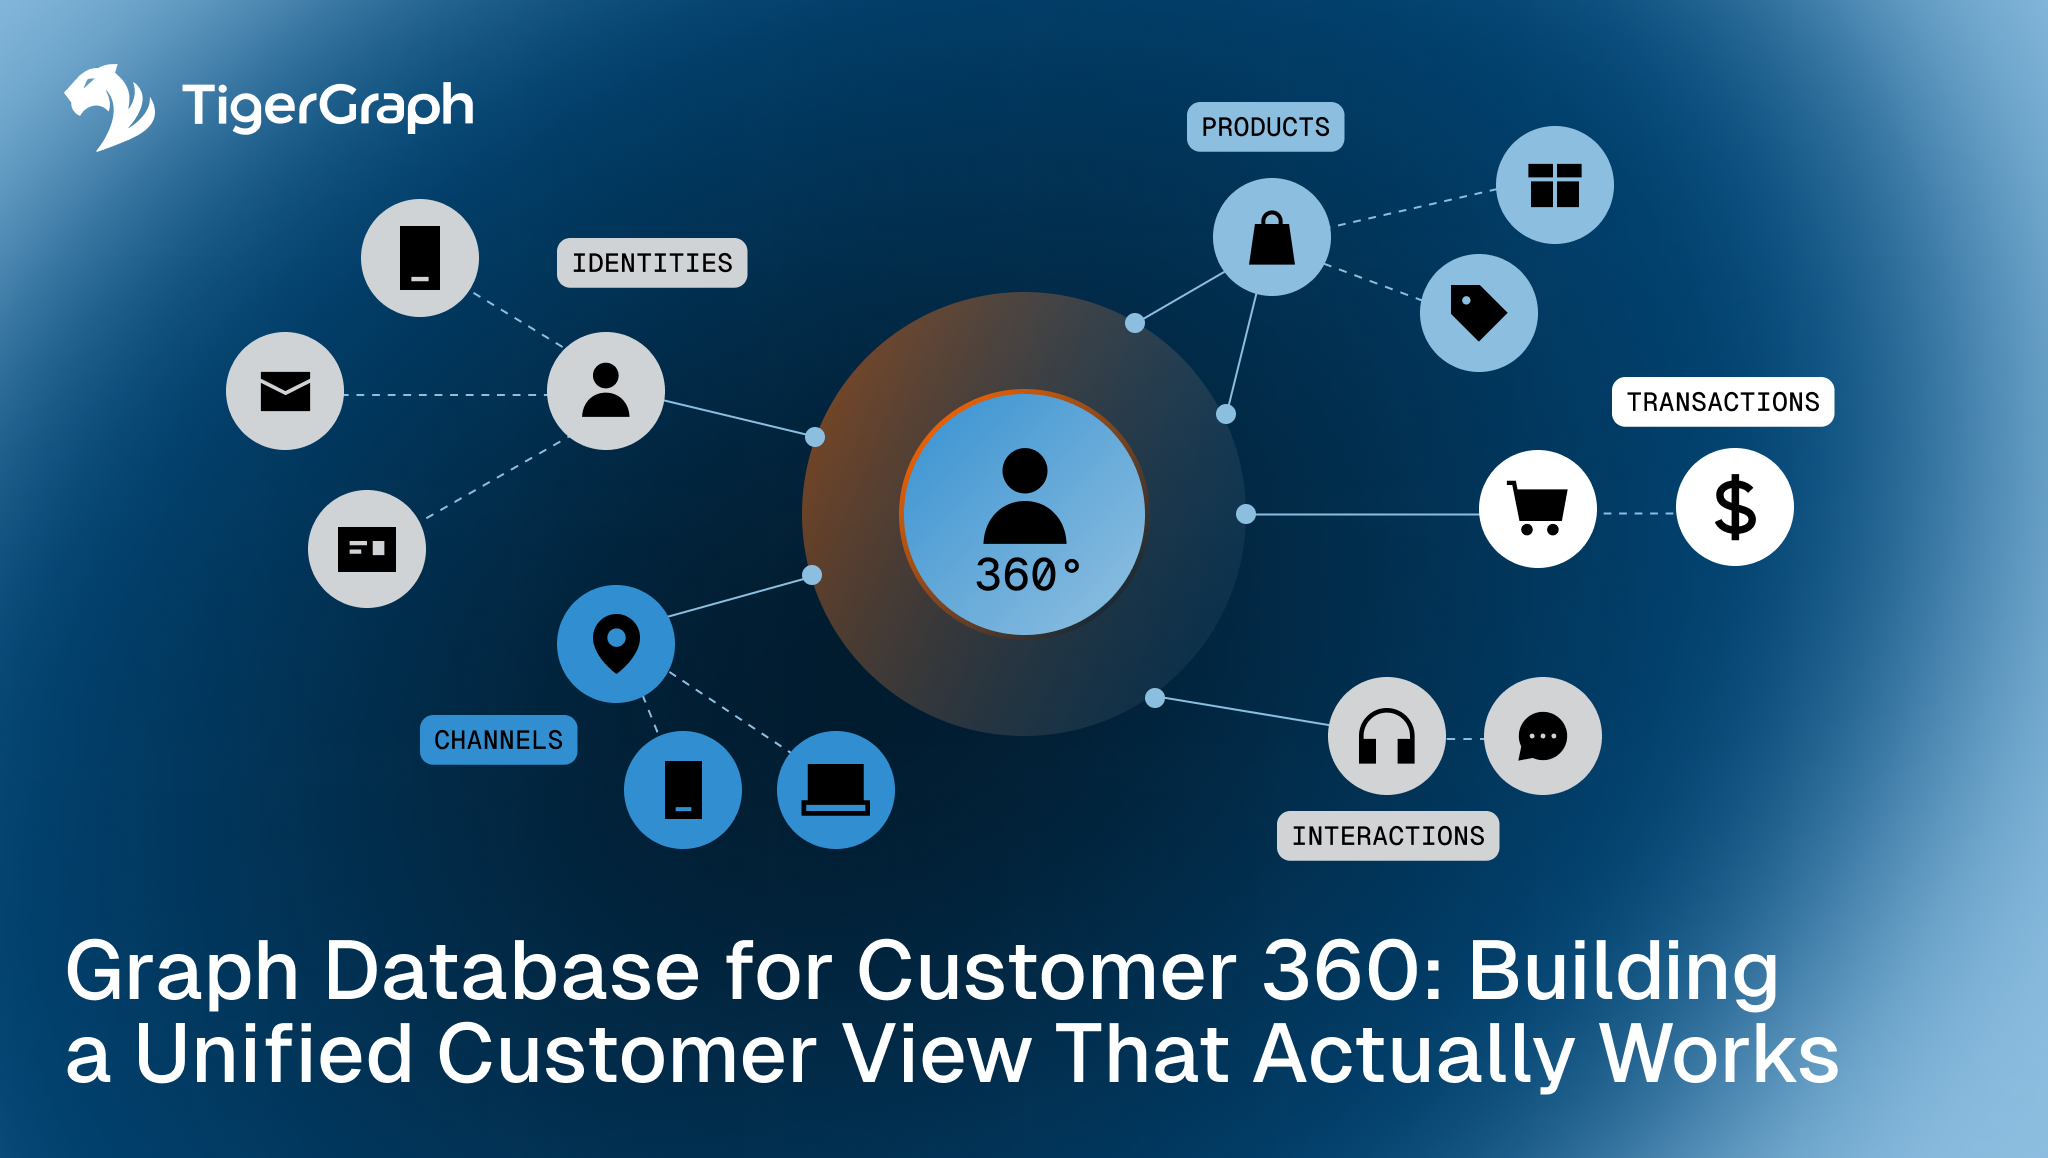
In a Customer 360 context, a graph database represents each customer as a node. Every identifier that belongs to that customer, including email addresses, phone numbers, loyalty IDs, and device identifiers, is also a node, connected to the customer by a labeled relationship. Every account, product, transaction, household member, journey step, and service interaction is connected the same way.
The result is not a wide table with many columns. It is a queryable network. When a bank needs to ask “which customers in this household also hold a competitor product and have made a transaction in the past seven days?” that query follows a chain of relationships across four entity types: customer, household, product, and transaction. In a warehouse, that requires four sequential joins. At production scale, those joins are often too slow to influence a live customer touchpoint. In a graph database, the same query runs in milliseconds.
This is the structural advantage a graph database brings to Customer 360: not just a more complete picture of the customer, but a picture that can be queried in real time, at the moment a decision needs to be made.
Why Most Customer 360 Initiatives Fall Short
Most enterprise Customer 360 initiatives consolidate customer records from CRM systems, transactional platforms, marketing tools, and service applications into a central repository, typically a data warehouse, lakehouse, or CDP. While this creates a consolidated record, it rarely creates a connected one.
Warehouses and CDPs are built on relational or tabular models that resolve a single customer record but flatten relationships such as household membership, shared devices, multi-account ownership, referral chains, and customer journey paths. Those relationships can technically be expressed as joins in relational databases, but they become expensive at scale. Multi-hop relationship queries that drive the most valuable customer insights cannot be executed effectively in real time using joins alone.
Consider a concrete example: a bank wants to identify household members who are also customers, have recent transactions including a competitor’s product, and have engaged with a specific marketing campaign. Running that query in a warehouse environment requires several deep joins across multiple tables. In production, those queries take minutes, and are often avoided altogether, causing the cross-sell opportunity to be missed entirely.
Beyond the join problem, Customer 360 programs also hit three structural walls:
- Identity fragmentation: customers exist as multiple partial records across systems. Resolving them into a single identity is difficult in tables; resolving households and connected accounts is harder still.
- Loss of behavioral and product context: purchase, browsing, and service interaction data is collapsed into aggregate features rather than preserved as a connected journey, eliminating the patterns that drive next-best-action recommendations.
- Latency between insight and action: even when the 360 view is built, querying it for a specific real-time decision is too slow to influence the touchpoint at the moment a customer is present.
Graph databases are purpose-built to solve these issues by resolving identities through relationship queries, preserving behavioral and product context as connected paths, and returning answers to multi-hop queries in milliseconds.
What a Graph Database Adds to Customer 360
Here are four specific capabilities that a graph database for Customer 360 unlocks:
- Real-time identity and household resolution: Graph queries unify fragmented records across channels, devices, and household members in real time, producing the single customer view that flat resolution approaches deliver only as a batch artifact. Entity resolution through graph is continuous rather than periodic.
- Connected journey analytics: Every touchpoint a customer has across web, mobile, store, and service becomes a node connected to the customer. The full journey can be queried as a path rather than reconstructed from session logs. This means the system can recognize that a customer who browsed a product on mobile, abandoned checkout, and then called service about a related product is not two separate signals but a single connected intent.
- Network-aware segmentation and propensity: Segments and propensity scores reflect not just the individual customer but the household, product network, and behavioral graph in which the customer sits. Customers with similar relationship patterns are identified through graph neighborhood analysis, a structurally different and more accurate approach than feature-vector proximity alone.
- Real-time decisioning at the touchpoint: When a customer arrives at a website, calls a service center, or opens an app, the graph returns the most relevant connected context, including recent journey steps, household activity, and product affinities, in milliseconds. The touchpoint reflects who the customer is right now, not who they were at last night’s batch run.
TigerGraph‘s massively parallel processing enables deep link analytics across billions of relationships without performance degradation, supporting real-time multi-hop customer queries at enterprise scale. This is the architecture that turns a Customer 360 view from a reporting artifact into an operational capability.
Graph vs. CDP and Warehouse-Based Customer 360: Key Differences
A graph database for Customer 360 is not a replacement for CDPs, warehouses, or activation platforms. Graph acts as the relationship layer that gives those platforms the connected intelligence they cannot build natively.
| CDP / Warehouse | Graph Database | |
| Data model | Wide, flattened customer record | Connected network of customers, identifiers, and touchpoints |
| Identity and household resolution | Batch joins | Real-time relationship queries |
| Journey analytics | Aggregated session metrics | Queryable connected paths across channels and time |
| Segmentation | Attribute-based | Network-aware, relationship-informed |
| Latency at the touchpoint | Seconds to minutes | Milliseconds |
| Explainability of recommendations | Model output only | Graph-grounded relationship paths |
| Best-fit role in the stack | Record management and audience activation | Relationship intelligence and real-time decisioning |
The most significant difference in practice is query depth combined with latency. A CDP can tell you what a customer has done. A graph database can tell you how that customer is connected to every other entity in your data, and answer that question fast enough to act on it at a live touchpoint. These are complementary strengths. Enterprises that stop at the CDP have the record. Enterprises that add a graph have the network.
Graph + AI: How the Combination Powers Real-Time Customer Intelligence
AI is no longer optional for enterprise Customer 360. The challenge is that AI models are only as good as the features they are trained on, and attribute-only features miss the structural signals that predict customer behavior most accurately. Graph’s relationship context is the missing input that makes customer AI materially better.
Four ways graph enriches customer AI:
- Graph-computed features for ML: household behavioral similarity, multi-hop product affinity, and journey-stage centrality measurably improve the accuracy of churn, propensity, and recommendation models compared to attribute-only feature sets. The relationship context graph provides ML models with signals that flat tables cannot generate.
- Graph Neural Networks for recommendations and propensity: GNNs learn from the structural patterns in the customer-product-journey graph, capturing substitution, complement, and influence patterns that collaborative filtering and tabular models miss. A GNN trained on a retail customer graph can detect that customers who buy product A and product C frequently add product B within 30 days, even when no explicit “frequently bought together” signal exists in the transaction record.
- GraphRAG for customer-facing AI: when a bank, retailer, or service organization deploys an AI assistant, GraphRAG grounds its responses in the customer’s actual relationship graph, their accounts, household, and recent interactions, eliminating the generic responses that erode trust. A customer asking “What is the best account for my family’s savings?” gets an answer informed by their household structure, not a generic product description.
- Explainable personalization: every recommendation, offer, or next-best-action can be traced to the specific relationship path in the graph that justified it, satisfying both customer transparency expectations and the explainability standards regulators apply to consequential decisions in financial services and healthcare.
Enterprise Use Cases: Where Graph-Powered Customer 360 Applies
Customer 360 graph databases deliver measurable value across every major industry that manages complex customer relationships at scale.
Banking and financial services: Banks use graph to unify the household-and-account view across retail, wealth, and business banking, surfacing cross-sell opportunities that single-account views miss entirely. A relationship manager asking “Which of my business clients also have personal accounts, and what products do their household members hold?” gets an answer in real time rather than waiting for a next-day report. Graph also powers real-time personalization across web, mobile, and call center channels, so a customer’s most recent interactions are always part of the decisioning context. Xandr, working at the intersection of consumer data and media, uses TigerGraph to combine consumer data across 15 properties for cross-property user journey tracking, a structurally similar challenge to household analytics in banking.
Retail and consumer goods: Retailers use graph to connect customer identity across loyalty programs, e-commerce platforms, and physical store channels, giving the merchandising and personalization team a single, relationship-aware customer record rather than three disconnected profiles. Graph models product affinity across substitution and complement patterns, not just co-purchase frequency. A customer who buys running shoes is connected to other customers who later added running socks and hydration gear; that network pattern drives more accurate next-product recommendations than purchase history alone. Retailers that replace attribute-based segments with network-aware segmentation consistently see measurable lifts in recommendation click-through and average basket size.
Telecommunications and subscription services: telcos use graph to unify customer, account, and device relationships across individual and family plans, enabling household-level retention analytics that single-subscriber models miss. When one family member’s contract approaches renewal, graph can surface the risk that other household members will follow, and flag the retention intervention before the first line cancels. Graph also supports plan optimization across the connected account, identifying upgrade or consolidation opportunities based on actual usage patterns across the household rather than individual subscriber metrics.
Insurance and wealth management: insurers and wealth firms use graph to model the household, beneficiary, advisor, and policy network, a relationship structure that single-policy or single-account views cannot represent. A wealth advisor asking “which of my clients have a beneficiary relationship with a client at risk of lapsing a life policy?” is asking a multi-hop relationship question. Graph answers it; a flat system cannot. Relationship-aware servicing and next-best-action recommendations built on the full household network consistently outperform those built on individual policy records.
B2B and account-based marketing: B2B firms use graph to map the buying group inside each target account: stakeholders, influencers, decision-makers, and their relationships to each other and to prior engagements. A sales team asking “who in this account is connected to a champion at one of our existing customers?” is asking a relationship question. Graph surfaces that connection; a lead-level CRM record cannot. Personalized journeys built on the actual connected structure of the buying organization convert at higher rates than those built on lead-score attributes alone.
The Relationship Layer That Makes Customer 360 Work
A Customer 360 view built on a graph database is not a more complex version of what a CDP delivers. It is a structurally different capability: one that stores relationships as first-class data, queries them in real time, and makes the full customer network available at every touchpoint. For enterprises managing customers across households, channels, and products, that difference is where competitive advantage actually lives.
Explore TigerGraph’s Customer 360 solution to see how it fits your stack, or request a demo to see the architecture in action.
FAQs
What is Customer 360?
Customer 360 is a unified view of a customer across every system, channel, and interaction an enterprise has with them. The most valuable Customer 360 implementations preserve the relationships behind customer records, including household connections, product journeys, and shared devices, not just consolidated fields from multiple source systems.
Why use a graph database for Customer 360?
A graph database for Customer 360 stores the customer view as a network of identifiers, accounts, households, journeys, and products, and queries that network in real time. Flat data models can consolidate records but cannot efficiently answer the multi-hop relationship queries that drive household analytics, real-time personalization, and network-aware segmentation at enterprise scale.
What is the difference between a graph Customer 360 and a CDP?
A CDP consolidates customer records and orchestrates activation across marketing and service channels. A graph database adds the relationship layer underneath: multi-hop identity resolution, household analytics, connected journey queries, and real-time decisioning that a CDP cannot provide natively. The two work together. The CDP manages the record and the activation workflow; the graph powers the relationship intelligence.
Does TigerGraph support real-time Customer 360 at enterprise scale?
TigerGraph is purpose-built for real-time, multi-hop Customer 360 at enterprise scale. It supports identity resolution, household analytics, journey intelligence, ML feature generation, GNN-based recommendations, and GraphRAG for AI-grounded customer experiences, all within a single system. Its massively parallel processing architecture handles deep relationship queries across billions of connections without performance degradation.
How does graph improve customer recommendations?
Graph encodes the product, household, and journey relationships that drive recommendation accuracy. Graph Neural Networks trained on a customer-product-journey graph capture substitution, complement, and influence patterns that collaborative filtering and tabular models miss. Every recommendation produced is also explainable: each suggestion traces back to the specific relationship path that justified it, which matters for both customer trust and regulatory compliance.