Graph Developer Proficiency Rating
A Simple Rating System for Staffing Graph Projects
A business unit leader once asked me a simple question: When will my development team be self-sufficient in creating graph applications? Although the question was simple, my answer required the business leader to understand two concepts. The first was measuring graph developers’ proficiency and skill level. The second was understanding how a development team needs a mix of developers with various skill levels.
This blog will cover both of these concepts. It will also help you design a team structure with the right mix and know when to supplement your team with outside experts.
As any team gains experience with graph databases, it is expected to ask, “What is the overall level of proficiency my development team has?” We can answer this question by assigning each member of the team a graph proficiency rating. It is a numeric score that ranges from level 1 (Novice) to level 5 (Expert). Note that this ranking is ONLY for the graph developer persona. A separate proficiency rating is used for operations teams.
When any new TigerGraph project starts, a team of TigerGraph experts can assess your team’s skill level. This assessment can estimate the amount of professional services you will need for the initial phases of your project while your internal teams get up to speed.
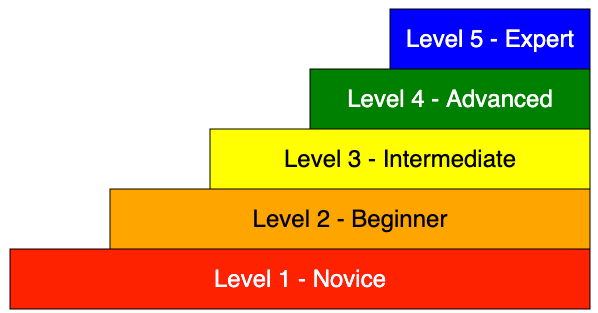
Interactive Level Diagram (JavaScript and p5.js): https://editor.p5js.org/dmccrearytg/sketches/FjPrIOhhm
This diagram allows you to hover over each level, and the description will be displayed below the diagram.
Here is our suggested ranking system.
Level 1: Novice
At the novice level, individuals have a basic understanding of graph databases learning basic terminology, such as when to use vertices, edges, and attributes. They understand concepts such as directed edges and basic graph traversal. Novice graph developers have begun to have experience designing simple graph models of up to about a dozen vertices. They can perform basic read operations, call building queries, and write or modify simple GSQL. They struggle with complex query syntax and logic. Novices rely heavily on their peers and need clear examples, documentation, and significant guidance and supervision.
Estimated Time to Achieve Novice Proficiency: 1-2 months.
Level 2: Beginner
Beginners understand fundamental graph database concepts and can design more complicated graph data models with some guidance. They are starting to model relationships and attributes and write simple traversal queries in GSQL using essential functions and clauses. They begin to use accumulators to optimize queries. Beginners occasionally need help with syntax and logic and require moderate supervision and review. They are exposed to graph algorithms such as breadth-first search and PageRank. They can participate in graph development projects, but senior developers should review their code.
Estimated Time to Achieve: 2-5 months.
Level 3: Intermediate
At the intermediate level, individuals have a solid understanding of graph database principles and can independently design moderately complex graph models. They are proficient in writing more complex GSQL queries, including multi-step traversals, and are comfortable optimizing basic queries for performance. They have developed skills for debugging GSQL queries and leveraging a library of graph algorithms such as label propagation pathfinding and community detection. They can quickly come up to speed and contribute to various graph projects. They occasionally seek guidance on advanced query constructs and best practices.
Estimated Time to Achieve: 5-12 months.
Level 4: Advanced
Advanced practitioners understand graph database principles and can independently design complex and efficient graph models for diverse use cases. Advanced graph developers know design tradeoffs and can visualize memory allocation patterns used in vertex-attached accumulators. They are highly proficient in writing and optimizing complex GSQL queries, comfortable with advanced features, and can troubleshoot complex query issues. Advanced graph developers have real-world experience using a wide variety of graph algorithms. They get exposure to query optimization and can write User Defined Functions (UDFs) in low-level C code. Advanced individuals can mentor others and guide best practices and optimization.
Estimated Time to Achieve: 1-2 years.
Level 5: Expert
Experts deeply understand property graph databases and data modeling and can design highly complex, scalable, and efficient graph models. Experts master GSQL (or Cypher) and its advanced features and quickly write, optimize, and troubleshoot the most complicated queries. Experts act as subject matter experts, contributing to improving team knowledge through mentorship and training, and are seen as thought leaders within the organization. Experts lead the design of new graph projects and can quickly assess the proficiency level of their peers and accurately recommend training paths for junior developers. Expert users can also explain the benefits of graph databases to senior leadership and compare and contrast graph databases with other databases such as relational databases, analytical databases, key-value stores, column-family stores, and document stores. Experts can draw on a deep portfolio of stories and experiences of how graphs have been used to solve complex business problems.
Estimated Time to Achieve: 2+ years.
Getting the Mix Right
When you start any new project, you should have a healthy mixture of level 3, 4, and 5 staff. You may not need full-time level 5 expert staff, but you need some part-time staff available to perform code reviews and mentor junior staff. Sometimes, due to budget constraints, your team will consist mainly of 1s and 2s. Junior developers often need to be corrected and redesign systems, slowing their progress. The junior your team is, the more frequent your code review cycles should be.
Here is a typical mix for a new TigerGraph project:
3 Novices
2 Beginners
1 Intermediate
1 Advanced
¼ Time Expert
Here is an example of a project that had severe challenges reaching deadlines:
5 Novices
3 Beginners
¼ Time Intermediate
If this is a makeup of your team, consider adding professional services staff from TigerGraph until your staff has time to come up to speed.
Conclusion
Working with any new technology takes time and patience. With a TigerGraph Customer Success Plan, you can rest assured that we will bring our expertise to your team and maximize your odds of project success.
References
Several papers and websites contain information about measuring developer skills and go into some depth on its complexity and the process of measuring educational goals. These metrics are called Rubrics. This article leverages some of their terminology but applies it to graph developers.
https://github.com/Semalab/developer-skills-matrix/blob/main/rubric/rubric.md
https://www.altexsoft.com/blog/software-engineer-qualification-levels-junior-middle-and-senior/
https://mentorcruise.com/blog/the-5-tiers-of-programmer-levels-rise-above-the-rest/