The Five Graph Algorithms Every Data Leader Needs to Know
Most data leaders are fluent in metrics. They understand revenue trends, customer acquisition costs, churn rates, and performance dashboards. They can interpret forecasts, run regression models, and evaluate model accuracy.
That fluency matters, but modern enterprise systems are no longer defined by isolated metrics. They are defined by connections.
Key Takeaways
- Modern enterprise systems are defined by connections, not isolated metrics.
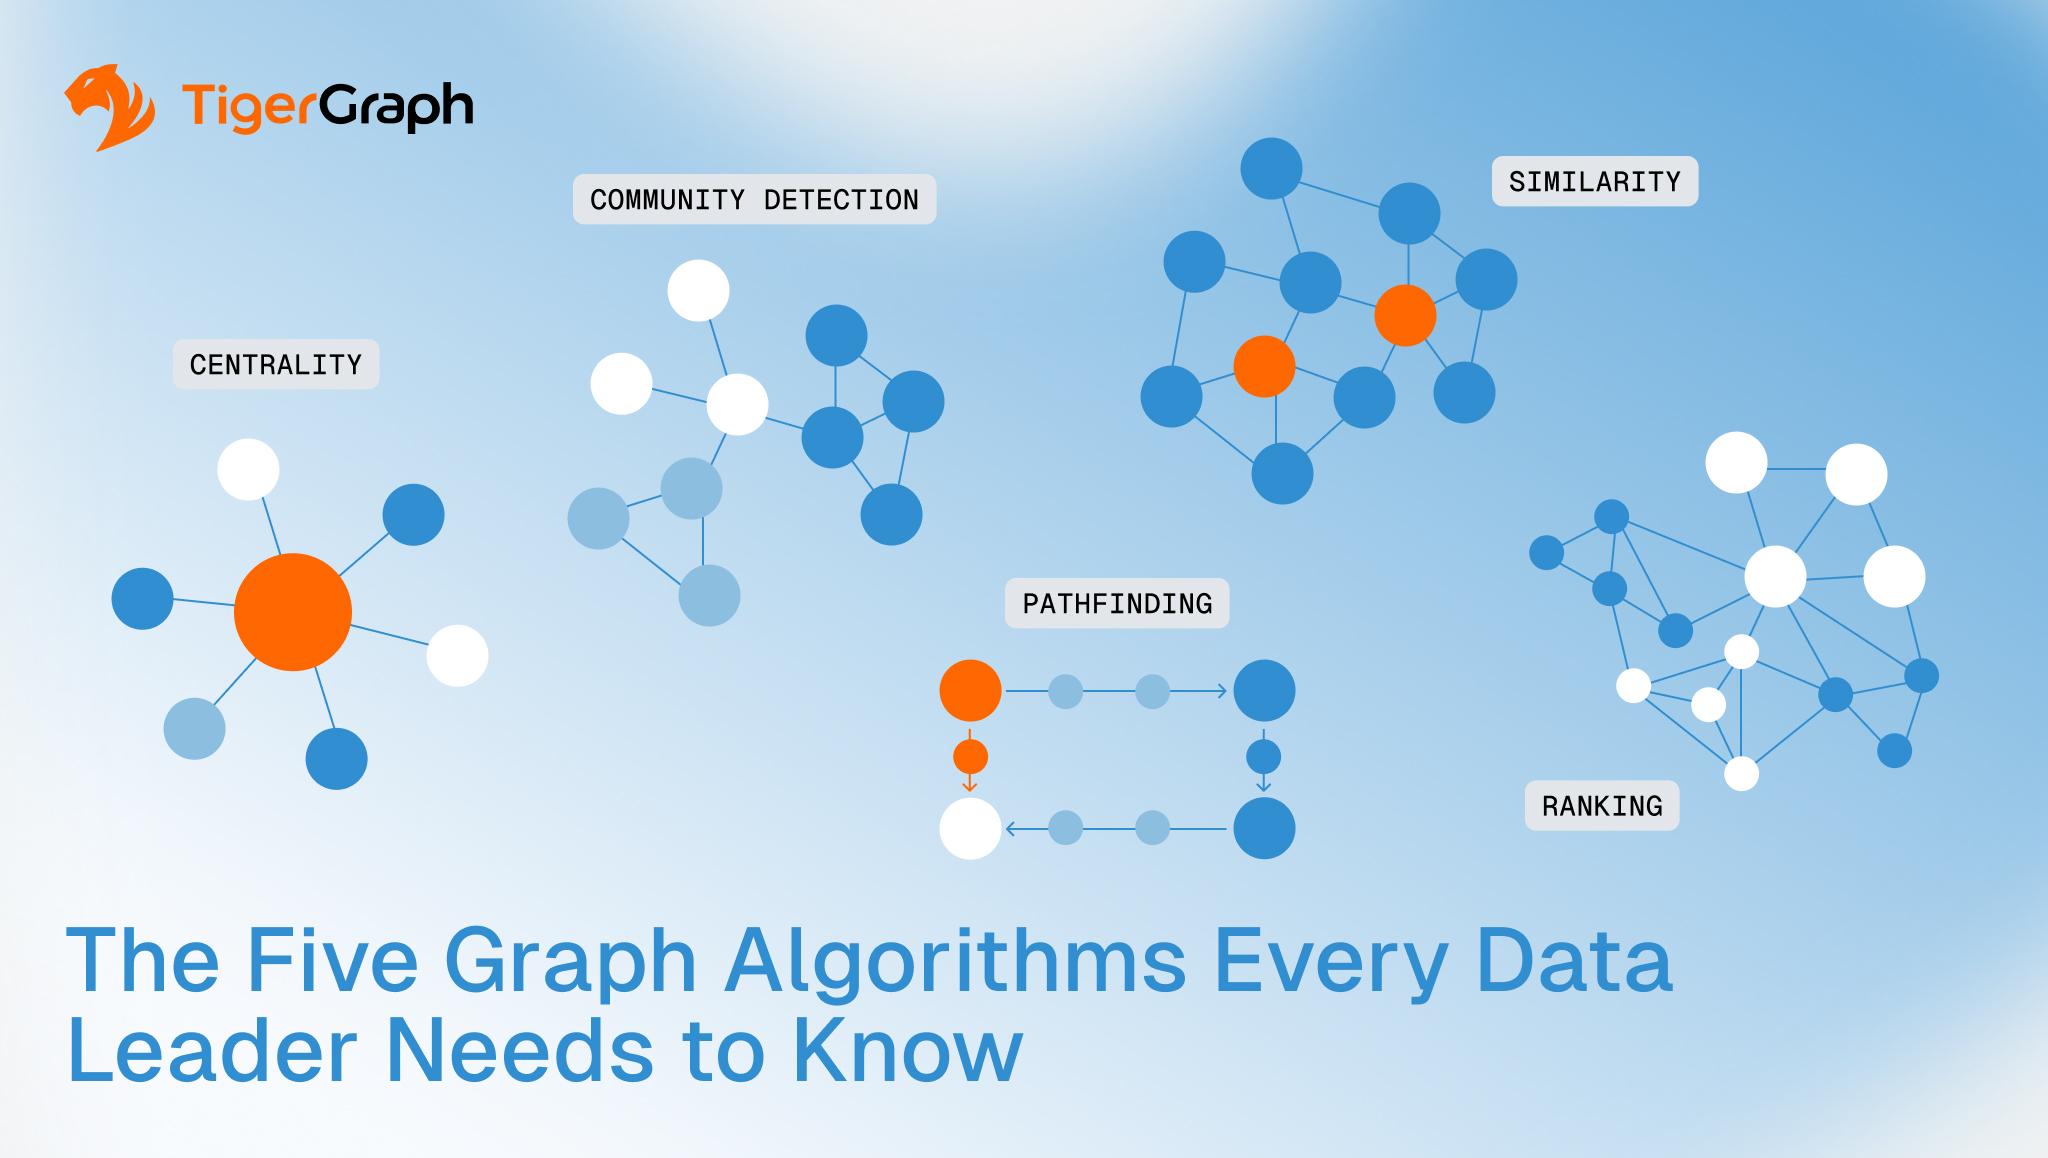
- Graph algorithms measure structural influence, coordination, and propagation inside connected networks.
- Centrality identifies structurally important entities.
- Community detection reveals hidden clusters and coordinated groups.
- Pathfinding exposes how risk or influence travels.
- Similarity compares entities based on shared relationships rather than attributes.
- Ranking prioritizes action by surfacing the most structurally significant nodes.
- These algorithms move analytics from descriptive reporting to structural reasoning.
Supplier disruptions do not stay isolated; they move through dependency chains. Customer communities shape demand in ways that raw counts cannot explain. Interconnected accounts can distort risk signals across an entire portfolio. Even a single logistics bottleneck can propagate across regions.
In systems like these, the structure of connections determines influence, risk and resilience. Dashboards tell you what happened and forecasts estimate what might happen next, but neither explains how influence actually moves through the system.
Graph algorithms do, though. They provide a way to measure position, detect clusters, trace propagation, compare structural similarity, and prioritize attention across complex, connected environments. They turn connectivity into something measurable and operational.
If you lead data strategy in a connected enterprise, there are five categories you need to understand.
1. Centrality: Who Actually Holds the System Together?
In any network, not all entities are equal. Some sit at the center of activity, and others act as bridges between otherwise disconnected groups. A few quietly control the flow of information, transactions, or influence without appearing prominent in standard reports.
Centrality algorithms measure structural importance.
In fraud networks, highly central nodes can signal coordinating entities rather than isolated bad transactions. In retail, structurally central customers may influence purchasing behavior across connected communities. In healthcare, certain providers can act as bridges between otherwise separate patient populations.
The key insight is this: importance is not just about volume. It is about position. And centrality turns position into something measurable.
2. Community Detection: Where are the Hidden Clusters?
Organizations often assume they understand segmentation. Customer segments, vendor tiers, patient cohorts. But many meaningful groups are not defined by attributes. They are defined by connection density.
Community detection algorithms identify tightly connected clusters inside a larger network. These clusters form naturally when entities interact more heavily with one another than with the rest of the system.
In financial crime, these clusters often reveal coordinated rings. In supply chains, they expose tightly interdependent vendor ecosystems. In digital platforms, they highlight groups of shared behavior.
These clusters rarely appear in traditional reports because tables show attributes. They do not reveal structural cohesion. Graph makes those hidden groupings visible.
3. Pathfinding: How does Risk or Influence Travel?
Knowing that two entities are connected is only part of the story. Understanding how they are connected changes everything.
Pathfinding algorithms identify the connection chain between two nodes. Not physical distance, but relational distance. Who connects them? How many steps apart are they? Through which intermediaries does this influence pass?
In cybersecurity, this can show how a compromised asset might reach a critical system. In compliance, it can expose indirect exposure to sanctioned entities. In logistics, it can identify dependency chains that amplify disruption.
Pathfinding answers a deeper question: if something moves through the system, how does it propagate? That is a leadership question, not a technical one.
4. Similarity: Who Behaves Alike Structurally?
Traditional similarity compares attributes. Graph similarity compares connections. Instead of asking whether two customers share demographic traits, we ask whether they share purchasing networks. Instead of comparing two accounts by profile fields, we compare them by overlapping transaction partners or shared devices.
This shift matters because behavior is often defined by relationships.
In fraud detection, structurally similar accounts may indicate coordinated activity. In healthcare, patients with similar care pathways may require comparable interventions. In retail, overlapping connection patterns may reveal emerging communities.
Similarity algorithms allow leaders to detect patterns that attributes alone cannot surface.
5. Ranking: Where Should Attention Go First?
Every organization faces prioritization constraints.
Analysts cannot investigate every alert, compliance teams cannot review every entity and risk teams cannot mitigate every exposure simultaneously. Ranking algorithms combine structural signals, like influence, connectivity, and proximity, to prioritize what matters most.
Instead of treating all nodes equally, ranking surfaces those that are structurally significant. The ones most central, bridging communities, or sitting at critical junctions. This turns graph insight into operational triage.
It is not enough to detect patterns. Leaders need to know where to act.
To understand why these algorithms matter, consider a global airline network.
Scaling an Airline Network
Airports are nodes, routes are connections and the network spans continents and time zones.
Some airports function as hubs, connecting entire regions. Others sit on the periphery. When a disruption occurs at a central hub, ripple effects spread quickly. Shortest paths reveal how quickly passengers or delays propagate across routes. Clusters reflect regional groupings.
This example is not really about aviation. It is a demonstration of how algorithms operate effectively at a massive scale. The same logic applies to payment networks, supply chains, telecommunications infrastructure, and digital ecosystems.
When a model can analyze global flight routes, it can analyze enterprise systems.
Why This Matters for Data Leaders?
Traditional analytics answers descriptive questions:
- What happened last quarter?
- Which region performed best?
- How many incidents occurred?
Graph algorithms answer structural questions:
- Who controls flow?
- Which groups operate together?
- How does disruption spread?
- Which entities are critical to system stability?
As organizations become more interconnected, these structural questions determine strategic risk and opportunity.
- Centrality identifies influence.
- Communities reveal coordination.
- Paths expose propagation.
- Similarity uncovers hidden alignment.
- Ranking prioritizes action.
These are all instruments for understanding how complex systems behave. Data leaders who understand these five categories move beyond reporting into structural reasoning. And in connected environments, structure is strategy.
Contact TigerGraph
If your organization is navigating complex, connected systems and needs deeper visibility into influence, risk propagation, and structural resilience, graph analytics provides the foundation. Contact TigerGraph to explore how these algorithms can strengthen your enterprise analytics strategy.
Frequently Asked Questions
1. What are Graph Algorithms and Why are They Critical for Modern Data Leaders?
Graph algorithms analyze relationships between entities, enabling data leaders to understand influence, risk, and connectivity across complex systems.
2. How do Graph Algorithms Improve Decision-Making in Connected Enterprise Systems?
Graph algorithms improve decision-making by revealing how entities interact, allowing leaders to identify critical nodes, hidden clusters, and risk propagation paths.
3. Why are Relationship-Based Insights More Valuable Than Traditional Metric-Based Analytics?
Relationship-based insights are more valuable because they show how outcomes are driven by connections, not just isolated metrics or aggregated data.
4. How can Graph Algorithms Help Identify Systemic Risk and Hidden Dependencies?
Graph algorithms identify systemic risk by analyzing connectivity patterns, exposing dependencies and pathways through which disruption or influence spreads.
5. What Types of Business Problems are Best Solved Using Graph Algorithms?
Graph algorithms are best suited for problems involving interconnected data, such as fraud detection, supply chain risk, customer behavior analysis, and network optimization.