What Airline Routes Teach Us About Graph Analytics at Scale
Airline networks offer one of the clearest real-world examples of how connectivity shapes performance and resilience.
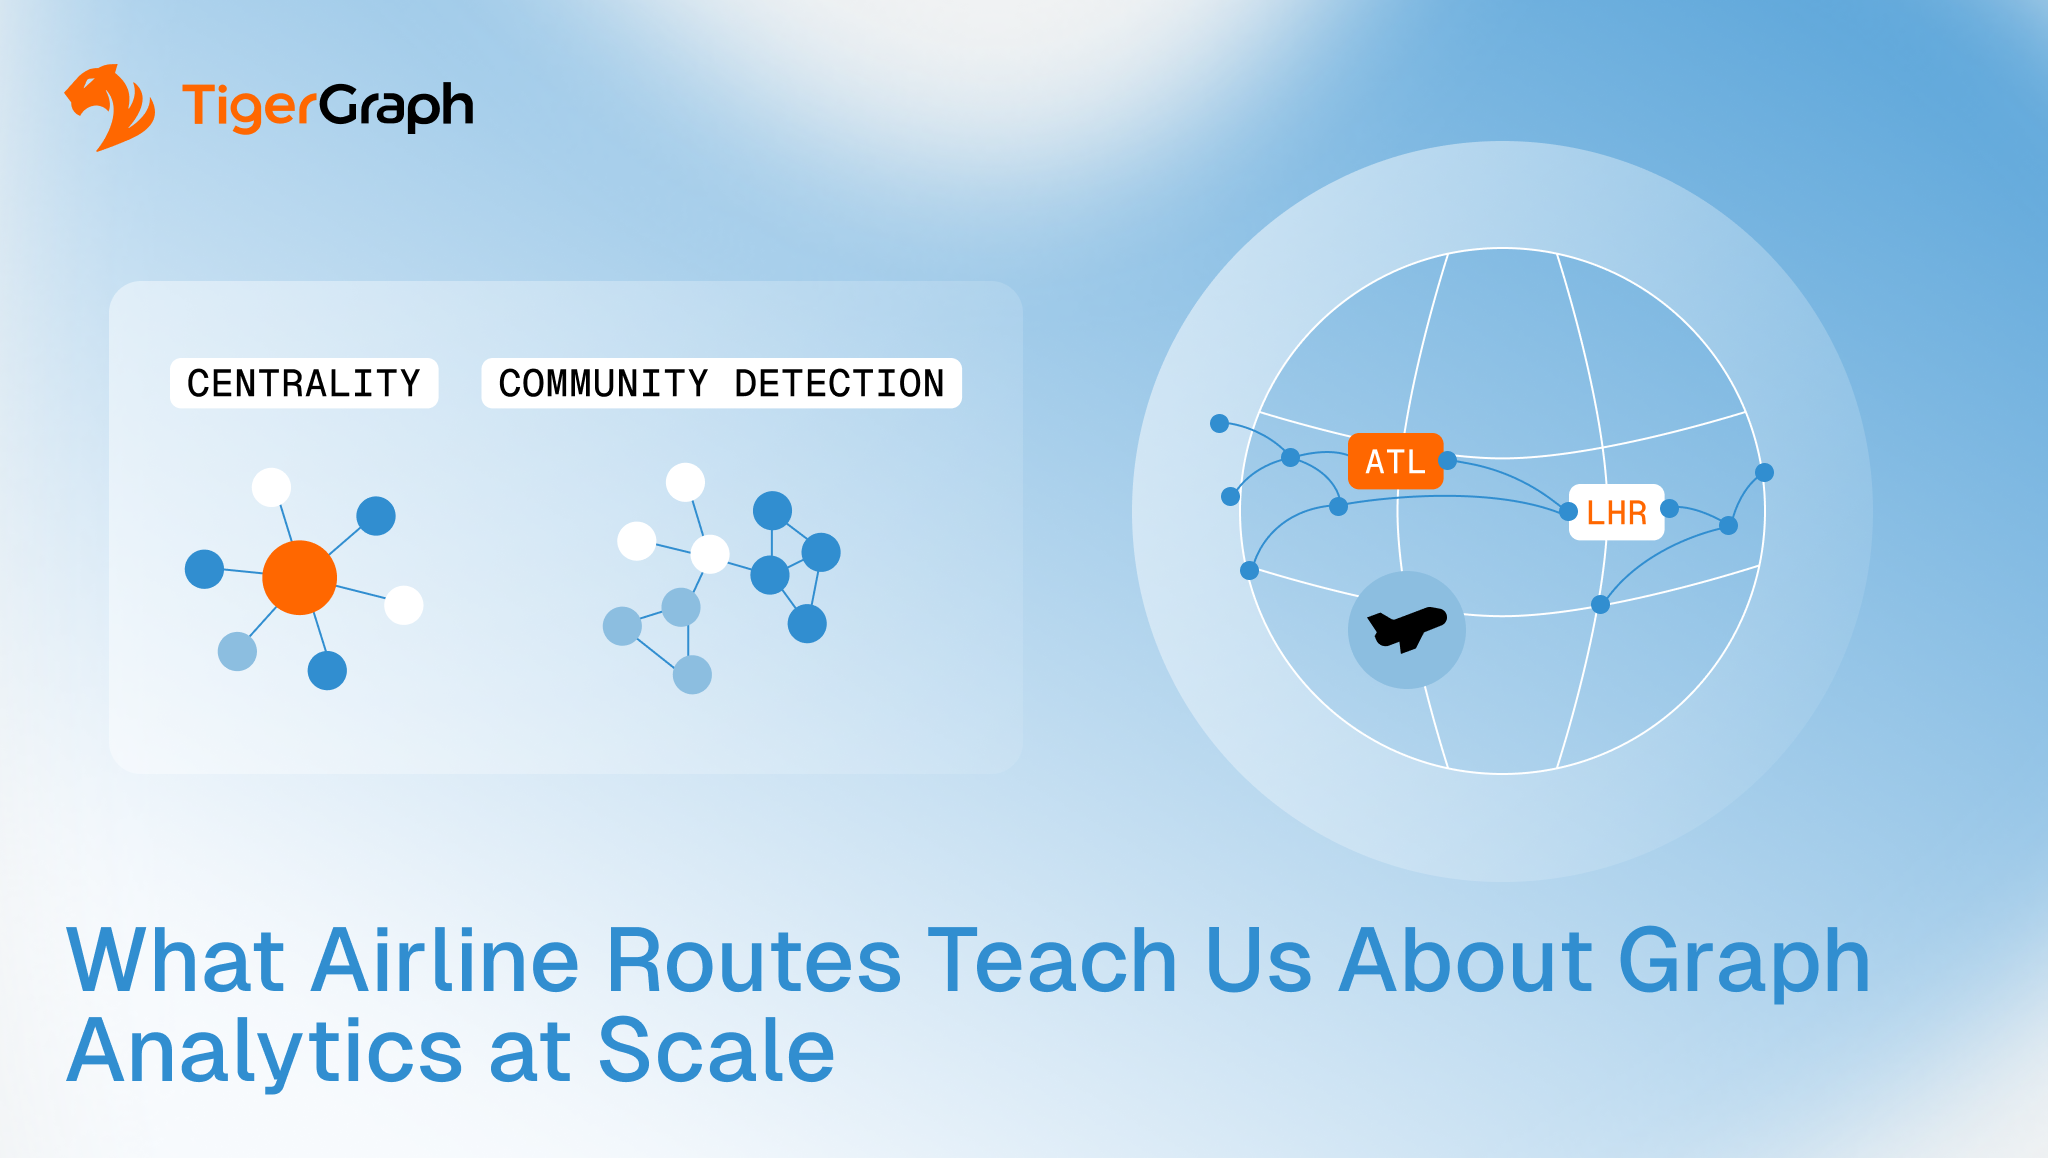
When you look at a global flight map, you are not just seeing cities connected by lines. You are seeing a structure. Some airports handle a small number of routes. Others serve as major hubs, connecting dozens or even hundreds of destinations.
In graph terms, airports are called nodes. A node simply represents a point in the system. In this case, it is an airport. The routes between airports are called edges. An edge represents a connection between two nodes. The arrangement of those nodes and edges is known as the network’s topology. Topology describes the overall shape of the network and how its parts are connected.
That structure determines how the system behaves.
If a small regional airport shuts down, the impact may be limited. If a major hub like Atlanta or Heathrow experiences delays, the effects ripple across multiple routes and regions. Delays cascade along connected paths because flights, crews, and passengers are all interdependent.
The disruption does not spread randomly. It follows the network’s structure. Enterprise systems operate the same way.
Key Takeaways
- Network topology determines resilience and influence.
- Centrality measures structural importance, not just volume.
- Shortest-path analysis reveals reachability and exposure.
- Community detection surfaces hidden clusters.
- Graph analytics demonstrates its value under real-world scale and complexity.
Organizations often think of data as a collection of records. But at scale, performance, risk, and influence are determined by how entities connect. A failure in a central system can affect multiple applications. A compromised identity can open pathways across environments. A supply chain disruption can impact downstream partners.
The airline network makes this structural reality visible, and graph analytics makes it measurable. Several graph metrics help quantify how structure influences system behavior. One of the most important is centrality.
Centrality is Not the Same as Traffic
Some airports process massive passenger volumes. Others may handle fewer passengers but serve as essential bridges between otherwise disconnected regions. Structural importance is not identical to raw throughput.
Graph centrality algorithms quantify that distinction. Measures such as betweenness centrality identify nodes that sit on critical paths between clusters. When such a node fails, disruption cascades across the network.
In enterprise environments, the equivalent may be a clearing institution in financial services, a core API gateway in a digital platform, or a supplier in a manufacturing chain. These nodes may not generate the highest transaction counts, but they hold structural leverage.
Volume measures activity. Centrality measures influence. Understanding the difference changes how risk is evaluated. Influence is only one dimension of structural analysis. Graph algorithms also reveal how risk, information, or disruption travels through a network.
Shortest Path is About Exposure, Not Distance
In airline systems, the shortest path between two cities is determined by connectivity, not geography. A city may be geographically close but require multiple hops due to limited routes. Another may be farther away but reachable in a single direct flight.
In graph analysis, moving across these connected routes is called multi-hop traversal. A traversal simply means following edges from one node to another. Multi-hop traversal follows several connections in sequence to understand how two entities are linked across the network.
Graph algorithms compute these paths instantly.
In enterprise systems, shortest-path analysis reveals how quickly risk propagates. A compromised vendor may connect indirectly to a sensitive system through several intermediaries. A supply chain disruption may ripple across tiers in non-obvious ways.
Shortest path analysis transforms abstract exposure into measurable structural reach. It answers the question: how many steps separate risk from impact?
Connectivity patterns also reveal how entities naturally group together within a network.
Community Detection Reveals Natural Clusters
Airline networks naturally form regional clusters. Dense connections exist within geographic regions, while cross-regional routes connect clusters to each other. Graph community detection algorithms identify these groupings based purely on connectivity density.
The same principle applies to fraud rings, customer segments, vendor ecosystems, and infrastructure zones. Clusters emerge from structure rather than predefined categories.
When clusters are identified algorithmically, organizations gain visibility into how activity concentrates. Fraud clusters reveal coordinated schemes. Customer clusters reveal shared behavior. Infrastructure clusters reveal segmentation weaknesses.
Structure defines grouping. Once clusters and pathways are visible, the next question becomes how resilient the overall structure is to disruption.
Resilience is a Function of Topology
When a major hub closes due to weather or operational failure, delays cascade. Flights are rerouted. Some destinations become unreachable. The impact depends on the network’s topology.
Graph modeling allows the simulation of node or edge removal. Organizations can model the impact of removing a supplier, shutting down a data center, or isolating a financial intermediary.
Resilience is not a reporting metric. It is a structural property. Understanding topology transforms contingency planning from speculation into simulation.
Understanding structure is valuable. Maintaining that visibility at real-world scale is what determines whether graph analytics becomes operational.
Scale is the True Test
Airline networks operate at global scale with constant change. Thousands of nodes and tens of thousands of edges shift daily. Graph analytics must maintain performance under that density. Traversal, centrality computation, clustering, and simulation must remain efficient.
If graph can model global air traffic networks, it can model complex enterprise ecosystems. The lesson is not about aviation. It is about structural reasoning at scale.
When systems grow interconnected, tabular abstractions become insufficient. Structure governs behavior.
Applying Graph Analytics to Enterprise Systems
Airline networks demonstrate how structure shapes performance, risk, and resilience. Enterprise environments operate under the same principles. Systems, identities, transactions, suppliers, and services form interconnected networks whose behavior depends on topology.
Graph analytics allows organizations to analyze these structures directly rather than reconstructing relationships through repeated joins.
Connect with TigerGraph to explore how graph analytics can help model complex enterprise networks, uncover structural risk, and analyze connected systems at real-world scale.
Frequently Asked Questions
1. What do Graph Analytics Reveal About Risk and Influence in Complex Networks?
Graph analytics reveal how risk and influence spread by analyzing relationships between entities, identifying critical nodes, pathways, and clusters that drive system behavior.
2. Why are Traditional Data Models Ineffective for Analyzing Interconnected Systems?
Traditional data models are ineffective because they treat data as isolated records, while interconnected systems require analysis of relationships and structure to understand behavior.
3. How can You Identify the Most Critical Nodes in a Network Using Graph Analytics?
You can identify critical nodes using centrality algorithms, which measure how much influence a node has based on its position within the network.
4. What does Connectivity Tell You About Risk Exposure Across a Network?
Connectivity reveals how risk propagates by showing how entities are linked across multiple steps, exposing indirect relationships and hidden dependencies.
5. How do Graph Analytics Improve Decision-Making in Complex Enterprise Environments?
Graph analytics improve decision-making by enabling organizations to model relationships, simulate disruptions, and analyze system-wide impact in real time.