What Graph can do for Retail and Healthcare, Beyond Recommendations
Most organizations believe they understand their customers or patients. They have dashboards, reports and metrics trending in the right direction. What they often do not have is a clear view of how everything connects.
Retailers see transactions. Healthcare systems see visits. Executives see totals, averages, and percentages. But very few see the full system.
When people hear “graph analytics” in retail or healthcare, they usually think about recommendation engines. Customers who bought X also bought Y. Patients who saw A also saw B. That is the most visible example, but it is not the most important one.
The real value of graph is not about suggesting the next product or provider. It is about revealing the relationships that shape the entire ecosystem. When customers, products, devices, payments, referrals, providers, and medications are treated as connected elements rather than isolated records, something changes.
You stop analyzing events and start understanding behavior.
Key Takeaways
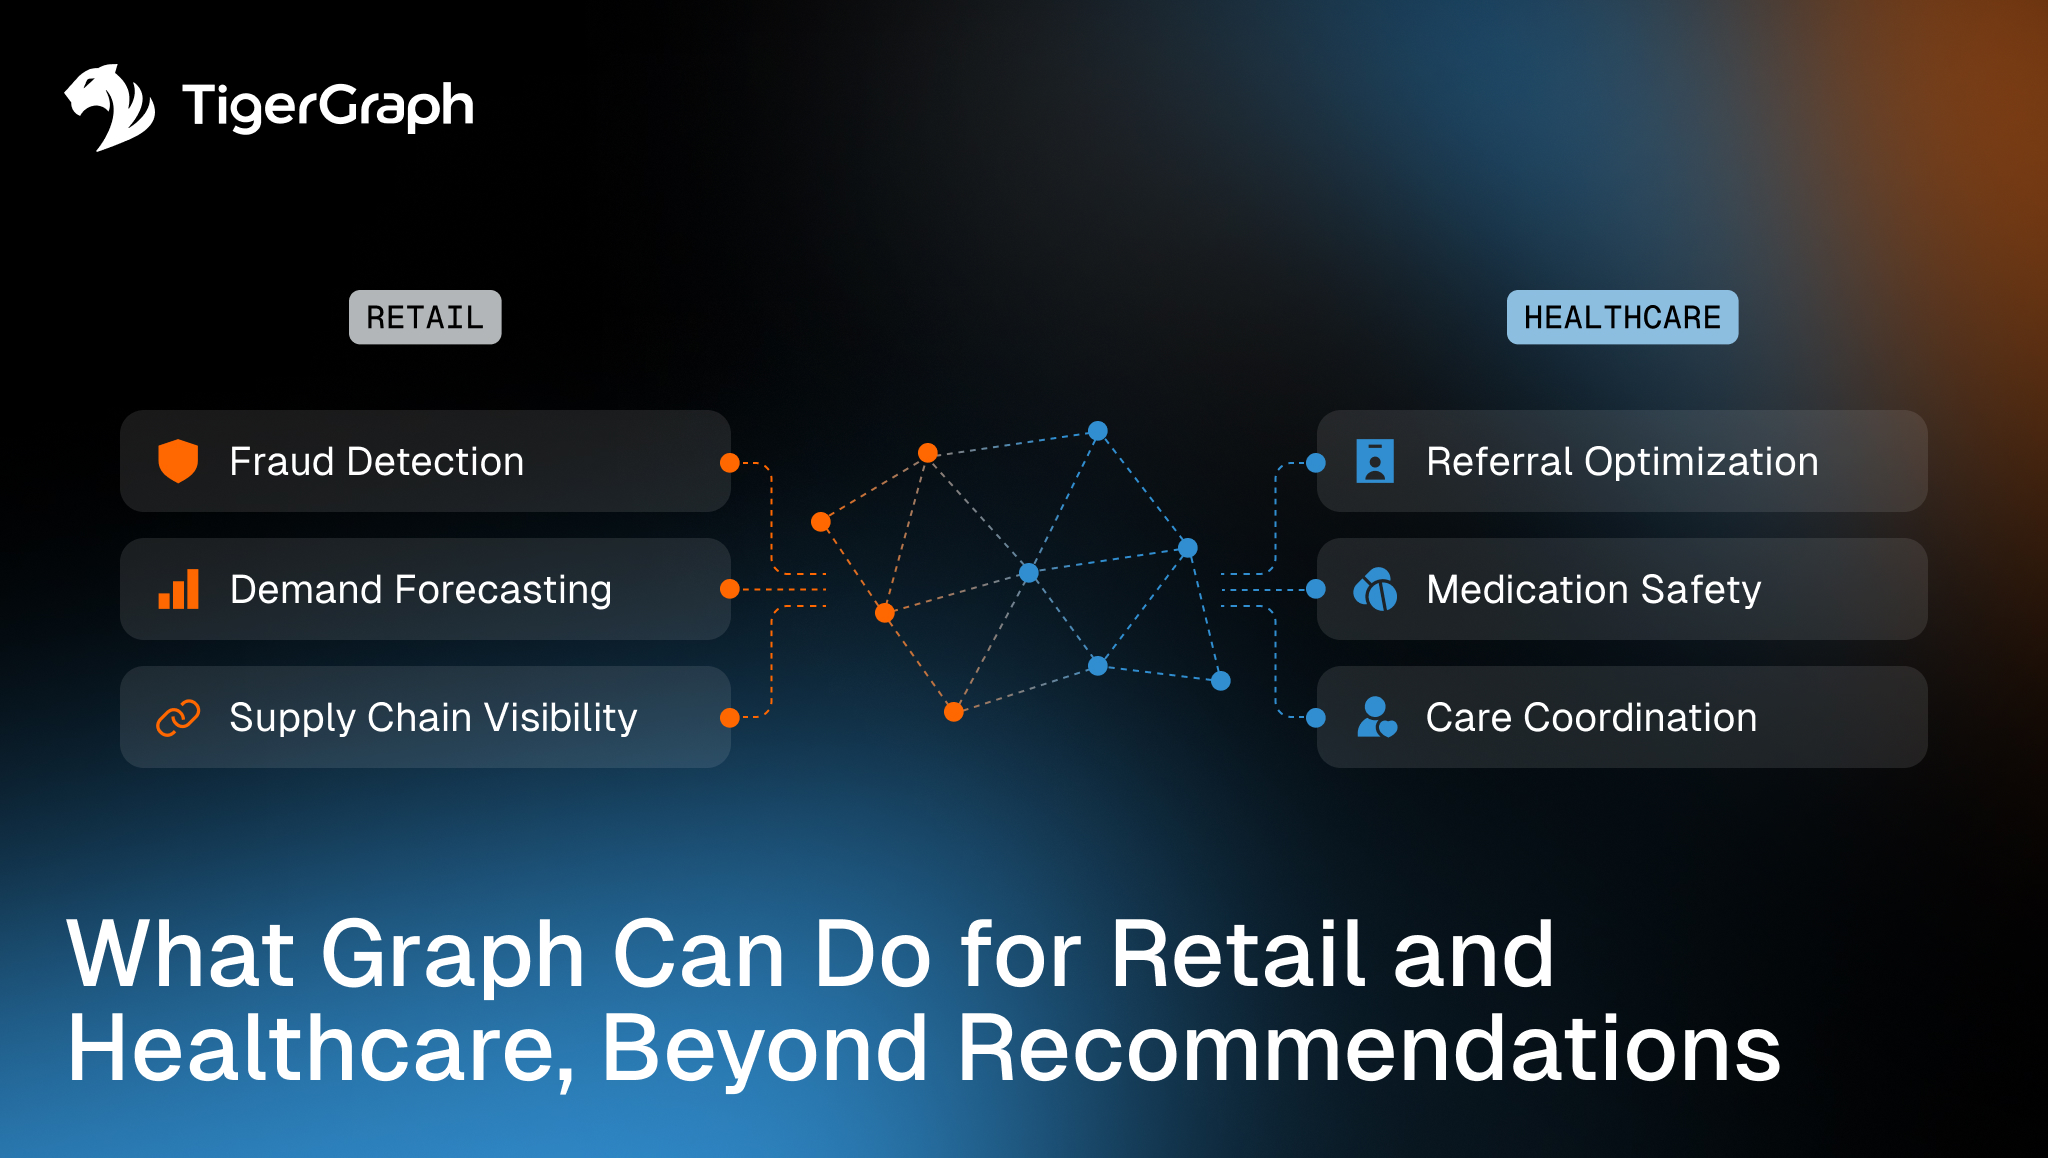
- Graph analytics is not just a recommendation tool. It is a way to see how risk, demand, and influence move across connected systems.
- In retail, it improves fraud detection, demand forecasting, and supply visibility.
- In healthcare, it exposes referral bottlenecks, coordination gaps, and risks of medication interactions.
- It strengthens machine learning by adding relationship-based context.
- And most importantly, it gives leadership a structural view of how their organization actually operates.
From Data Storage to System Awareness
Retailers already track customers, orders, and payment methods. Healthcare systems track patients, providers, referrals, diagnoses, medications, labs, and insurers. The data exists. The issue is not collection, but the connection.
Traditional systems organize information in tables. If you want to see how two things relate, you join those tables together. If you want to trace how five or six things relate across time and activity, those “joins” multiply. As a result, queries grow more complex, the performance slows and the logic becomes harder to maintain.
Graph takes a different approach.
Instead of rebuilding relationships each time you need them, it stores those relationships directly. It keeps track of who is connected to what and how those connections evolve.
This allows you to ask a new kind of question. Instead of asking, “What happened in this one transaction?” The question becomes, “How are these entities connected, and what patterns appear when we follow those connections?”
That shift is subtle and powerful.
Seeing the Commerce Network in Retail
Although we often talk about the retail consumer journey as a pipeline, it really isn’t. It is a web.
Customers connect to products, and products connect to suppliers. Customers connect to devices and payment methods, and those devices connect to other accounts. Returns connect to prior disputes. The web of variables is vast.
Individually, these relationships may look ordinary. Together, they tell a story.
A Retail Fraud Story
Imagine a retailer processing millions of transactions each day. Nothing stands out at first glance, with each purchase appearing legitimate. But when the relationships are mapped, a pattern emerges.
Five customer accounts share the same device fingerprint. That device connects to multiple shipping addresses and two of those addresses have prior chargeback history. Also, the purchases occur within similar time windows.
No single transaction is obviously fraudulent, but the structure is.
What appears to be normal activity at the surface reveals coordinated behavior underneath. The graph detects this because it does not rely on isolated anomalies. It detects shared infrastructure and layered patterns.
This is ecosystem awareness that goes beyond fraud to reveal demand and dependency.
Beyond Fraud: Demand and Dependency
The same structural view helps on the revenue side.
Products often move together in baskets. Some products drive demand for others, some rely on the same supplier and some share distribution dependencies. When a high-margin product depends on a single supplier, that dependency may not appear in a sales report, but it exists in the network.
Graph allows retailers to see where influence concentrates and where vulnerability hides. Demand does not move randomly. It flows through connections. When those connections are visible, planning becomes proactive rather than reactive.
Understanding the Healthcare Referral Network
Healthcare systems are also networks, even if they do not always appear that way. Patients connect to primary care providers, providers connect to specialists, specialists connect to hospitals and labs, and hospitals connect to insurers and care networks.
Reports typically show referral counts and wait times, but graph shows flow.
A Referral Bottleneck Story
Consider a regional health system facing increasing wait times in cardiology. The numbers show increased referrals, but the graph reveals something more specific.
Most referrals are flowing through one specialist cluster. That cluster connects to two hospitals with limited diagnostic capacity. Peripheral providers are routing nearly all cases through this narrow pathway.
The issue is not volume alone, it is concentration. When administrators see the network, they can redistribute referral flows, balance workloads, and intervene before patient outcomes are affected.
That level of visibility does not come from counting visits, but from understanding connections.
Medication safety follows the same logic.
Medication Safety as a Network Problem
Medications connect to diagnoses, contraindications, metabolic pathways, and other medications. These connections form overlapping networks.
If a patient is prescribed several medications, the risk may not appear in any single pairwise comparison. But when you follow the relationships across the full network, hidden interactions emerge.
Graph does not simply compare two drugs, it evaluates how all related elements interact and this offers structural safety. Graph adds context. Both retail and healthcare benefit from this context.
Instead of only tracking a patient’s diagnosis, you consider how that diagnosis relates to provider networks and treatment pathways. Instead of only measuring what an account did, you measure how it is connected
These relationship-based signals improve predictive performance because they reflect how real systems behave.
Graph does not replace machine learning, it makes it more aware—more explainable.
Explainability That Makes Sense
In regulated industries, explanation matters. Retailers must justify why an account was flagged. Healthcare systems must explain why a risk score increased. Graph provides a natural explanation by showing the path.
An account is high risk because it shares devices with accounts known for fraud. A medication combination is risky because it connects through a contraindication pathway.
This transparency builds trust and supports compliance. And this creates an advantage.
From Visibility to Advantage
When leaders understand how influence and risk move through their systems, they gain leverage.
Retailers detect coordinated fraud earlier. They reduce false positives. They plan supply dependencies more effectively. Healthcare systems identify referral bottlenecks sooner. They improve care coordination and reduce preventable risk.
Structural visibility turns information into an advantage.
Retail and healthcare look different on the surface, but underneath, both operate as networks. When those networks are made visible, organizations move from reacting to events to managing structure.
If your organization is working to improve fraud detection, care coordination, risk modeling, or ecosystem visibility, graph analytics may provide the structural clarity you are missing.
To learn how TigerGraph supports connected intelligence across retail, healthcare, and other complex environments, contact the TigerGraph team to explore how graph can be applied to your specific use case.
Frequently Asked Questions
1. How does Graph Analytics Improve Visibility Across Retail and Healthcare Systems?
Graph analytics improves visibility by connecting entities across systems, enabling organizations to see how customers, patients, providers, and products interact as part of a unified network.
2. Why are Traditional Analytics Limited in Understanding Customer and Patient Behavior?
Traditional analytics are limited because they analyze isolated events and metrics, failing to capture how behavior is shaped by relationships across systems.
3. How can Organizations Detect Hidden Patterns in Retail Transactions and Healthcare Data?
Organizations can detect hidden patterns by modeling relationships, revealing coordinated activity, dependencies, and multi-step interactions that are invisible in flat data.
4. What Role do Connected Data Models Play in Improving Operational Decision-Making?
Connected data models enable better decisions by exposing dependencies, bottlenecks, and influence pathways that impact outcomes across the organization.
5. How does Graph-Based Analysis Enhance Explainability in Regulated Industries?
Graph-based analysis enhances explainability by showing the relationship paths behind decisions, making outcomes easier to understand, audit, and justify.