
Most Graph Databases Break. TigerGraph Scales.

When Graph Data Grows, Most Systems Break
Most graph databases break when data gets big and queries get deep. TigerGraph does not.
Performance drops at depth
Batch-based updates
Re-architecture at scale
Limited traversal depth
TigerGraph Outperforms the Competition
Tiger Graph Savanna
neo4j Aura
Key Capabilities

Massively parallel processing
Fully distributed DB for scaling
New workspaces deployed on demand
Solution Kits for high-value use cases
Query Language Support: GSQL, OpenCypher, GQL pattern-matching
Cypher
Data connectors for Kafka, Spark, cloud object stores
Partial support
BYOC deployment option
AI-optimized
Tiger Graph Savanna
Key Capabilities
Massively parallel processing
Fully distributed DB for scaling
New workspaces deployed on demand
Solution Kits for high-value use cases
Query Language Support: GSQL, OpenCypher, GQL pattern-matching
Data connectors for Kafka, Spark, cloud object stores
BYOC deployment option
AI-optimized
neo4j Aura
Key Capabilities
Massively parallel processing
Fully distributed DB for scaling
New workspaces deployed on demand
Solution Kits for high-value use cases
Query Language Support: GSQL, OpenCypher, GQL pattern-matching
Cypher
Data connectors for Kafka, Spark, cloud object stores
Partial support
BYOC deployment option
AI-optimized
Why TigerGraph Wins
Other solutions force you to choose between speed and scale, we deliver both.
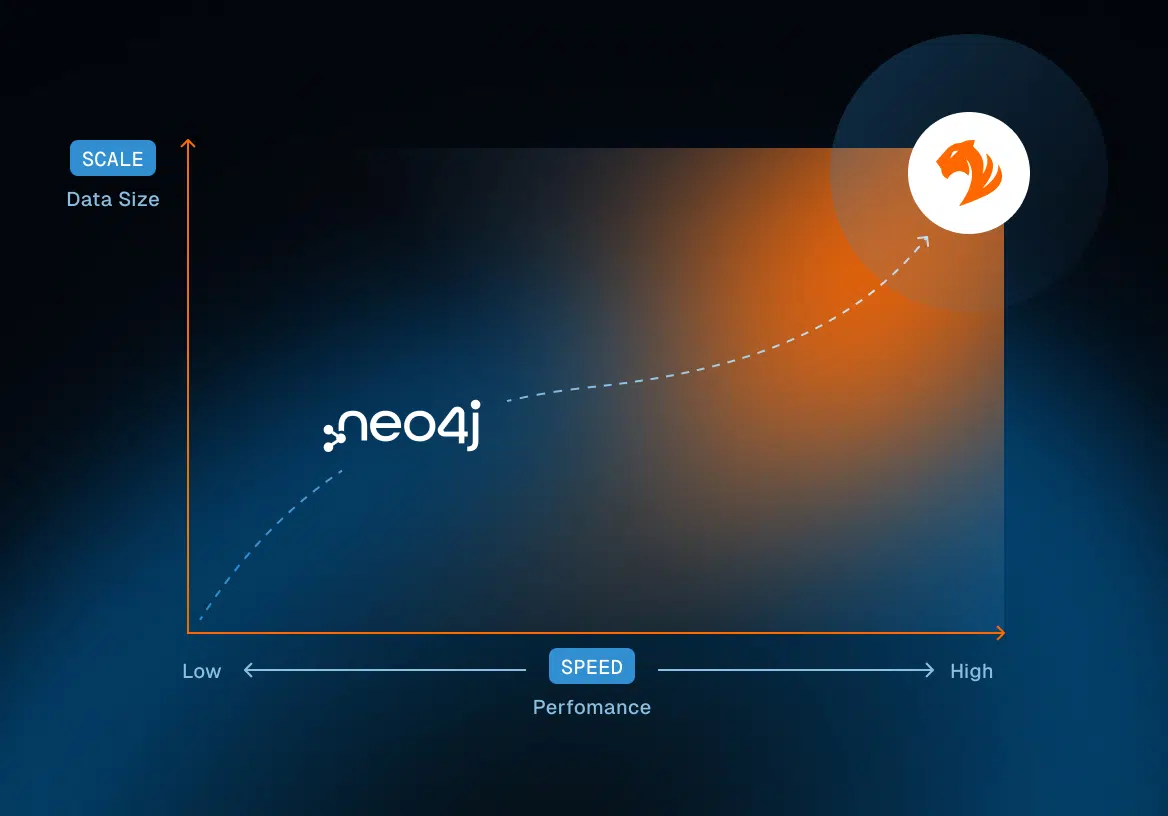
Unmatched Speed
10-100x faster than competing graph databases.
Proven Scale
Handles petabytes of data without performance degradation.
Additional Advantages
- Flexible deployment (cloud, on-prem, hybrid).
- Deep-link analysis (10+ hops vs. comp’s 2-3).
- Real-time updates (not batch processing).
- Enterprise-ready security and compliance.
- Built-in ML and AI integration.