Global Bank Improves Model Accuracy from 60% to 90% with TigerGraph

The Challenge
Global Bank Wealth Management needed to detect advisor engagement risk across 795M historical messages and ~5M daily records, where the predictive signal lived in communication networks, not isolated message records.
The Solution
Built an AWS Glue 5.0 pipeline that transformed PostgreSQL message records into a TigerGraph communication graph, computing PageRank, Local Clustering Coefficient, and multi-channel communication features for downstream ML models.
The Results
Increased model accuracy from 60% to 90% using TigerGraph graph data science features while operationalizing daily graph feature generation across 795M historical messages and approximately 5M new records per day.
The Challenge
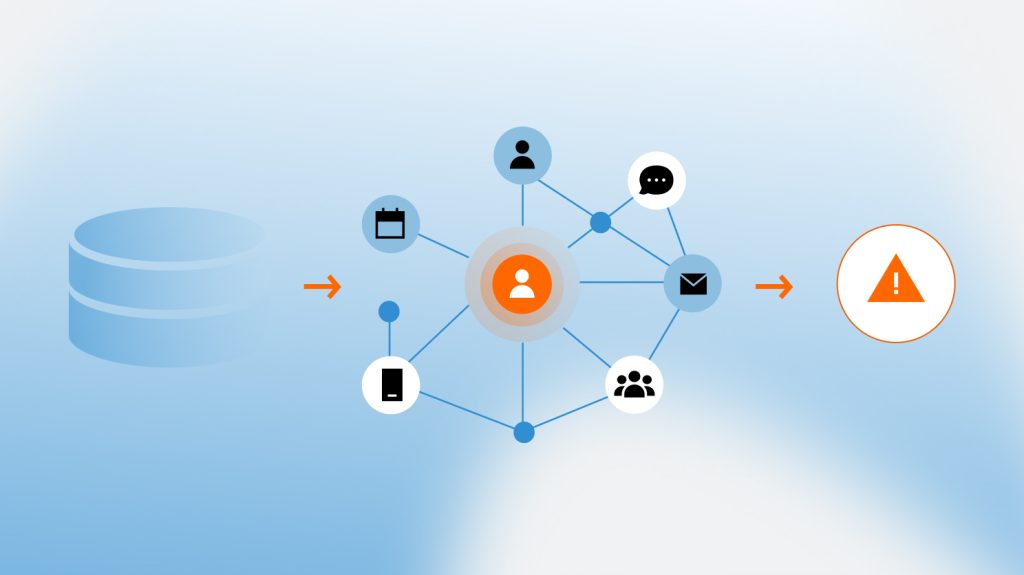
Global Bank Wealth Management needed to detect advisor engagement risk from communication network behavior across a massive and constantly growing dataset. Individual message counts and simple aggregates could not reveal whether an advisor was quietly withdrawing from their network or whether their communication position was changing over time.
The team needed visibility into network centrality, clustering patterns, multi-hop influence, cross-channel communication structure, and temporal network drift. These signals were invisible in flat records because advisor engagement risk was not a threshold event; it was a structural shift in the communication graph.
Traditional PostgreSQL tables stored the raw records, but relational systems could not efficiently execute multi-hop traversal, PageRank, or Local Clustering Coefficient across 5M+ rows per day and a 795M-record historical corpus.
The team needed visibility into network centrality, clustering patterns, multi-hop influence, cross-channel communication structure, and temporal network drift. These signals were invisible in flat records because advisor engagement risk was not a threshold event; it was a structural shift in the communication graph.
Traditional PostgreSQL tables stored the raw records, but relational systems could not efficiently execute multi-hop traversal, PageRank, or Local Clustering Coefficient across 5M+ rows per day and a 795M-record historical corpus.
The Solution
The team built an end-to-end AWS Glue 5.0 ETL pipeline that transformed raw PostgreSQL message records into a TigerGraph knowledge graph and generated ML features daily. The flow moved data from Aurora PostgreSQL to S3, bulk-loaded it into TigerGraph, ran graph queries, and wrote the resulting feature set back to PostgreSQL for the downstream engagement model.
The TigerGraph graph included 10 vertex types and 18+ edge types representing people, identifiers, platforms, messages, roles, classes, threads, dates, and communication relationships across email, calendar invites, instant messaging, chat, sender, receiver, participant, and role connections.
For each advisor and time interval, the system computed PageRank across email and calendar networks, Local Clustering Coefficient across both networks, sent and received communication counts, external communication counts, and CC/BCC participation. Features were aggregated across configurable daily, weekly, and monthly windows with up to seven months of history in production.
The TigerGraph graph included 10 vertex types and 18+ edge types representing people, identifiers, platforms, messages, roles, classes, threads, dates, and communication relationships across email, calendar invites, instant messaging, chat, sender, receiver, participant, and role connections.
For each advisor and time interval, the system computed PageRank across email and calendar networks, Local Clustering Coefficient across both networks, sent and received communication counts, external communication counts, and CC/BCC participation. Features were aggregated across configurable daily, weekly, and monthly windows with up to seven months of history in production.
The Results
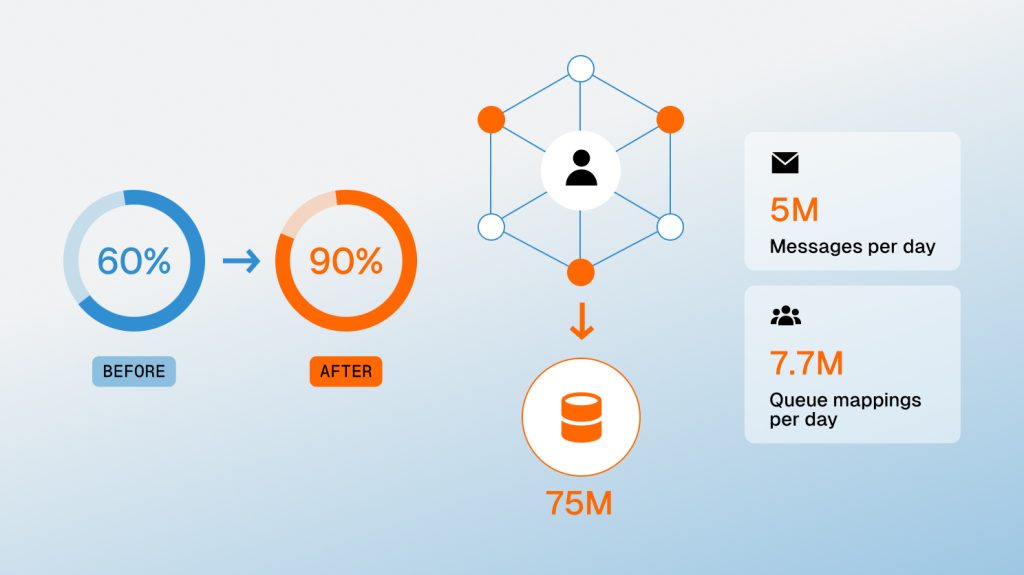
The implementation increased model accuracy from 60% to 90% using TigerGraph graph data science features. The system made graph-native advisor engagement signals operational across 795 million historical messages and approximately 5 million new records ingested daily. The pipeline processes approximately 5M messages, 7.7M queue mappings, and 5M participant records per daily partition using 25 G.2X workers, 200 cores, 800GB RAM, 48 processing partitions, and 96 TigerGraph write partitions.
The architecture now supports daily PageRank, Local Clustering Coefficient, multi-channel communication feature vectors, temporal feature series, resumable execution stages, audit tracking, CloudWatch logging, and HTML summary reports after each run.
The architecture now supports daily PageRank, Local Clustering Coefficient, multi-channel communication feature vectors, temporal feature series, resumable execution stages, audit tracking, CloudWatch logging, and HTML summary reports after each run.



Ready to Harness the Power of Connected Data?
Start your journey with TigerGraph today!