Contact Us
Blue and white abstract blurred background with soft gradient transitions, creating a calm and smooth visual effect. There are no distinct shapes or objects visible.

Solve Your Biggest Challenges:

Fraud Detection Entity Resolution Anti-Money
Laundering (AML)
Product
Recommendations
Customer 360 Supply Chain
Management
Cybersecurity
Threat Detection

TigerGraph, the enterprise infrastructure AI and graph database leader delivers unlimited parallel storage and computation for the most crucial business needs.

An infographic with four stats: >300% increase in fraud investigations efficiency, 3X increase in identity resolution rates, 26% reduction in customer churn, and 5X improvement in shopper spend, plus a smiling woman’s photo.

Trusted by global enterprises

Jaguar white logo
JP Morgan Chase logo
INTUIT white logo
AT&T white logo
Ford white logo
xbox logo
American Express white logo
Deloitte white logo
nike logo
KPMG white logo
Nice Actimize logo
Mastercard white logo
Helwett Packard white logo
Jaguar white logo
JP Morgan Chase logo
INTUIT white logo
AT&T white logo
Ford white logo
xbox logo
American Express white logo
Deloitte white logo
nike logo
KPMG white logo
Nice Actimize logo
Mastercard white logo
Helwett Packard white logo
A dark background with two blurred streaks: one orange and glowing near the bottom right, and one faint blue near the top. The image has an abstract, out-of-focus appearance.

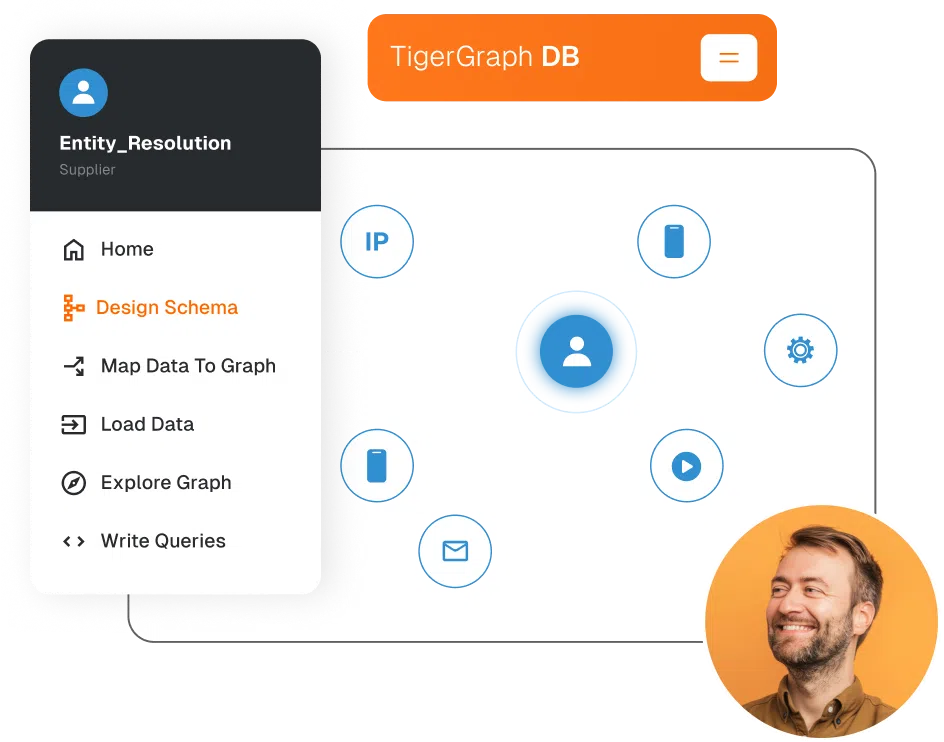
The Enterprise-Scale Graph Database Built for Real-time AI and Analytics

TigerGraph is a graph database purpose-built to analyze massive, highly connected data in real time and powering fraud detection, entity resolution, customer intelligence, and AI systems that demand speed, scale, and explainability.
Simple blue rocket icon with a circular window, pointing upward, on a light gray background.

Most databases store records. TigerGraph analyzes relationships

As an enterprise-scale graph database, TigerGraph models people, transactions, devices, products, and events as connected networks enabling organizations to understand how things are related, not just what happened. This relationship-first design enables faster decisions, deeper insights, and AI that operates with full context instead of isolated data.
A blue circular arrow surrounding a lightning bolt icon, representing a concept of energy, power, or recharge.

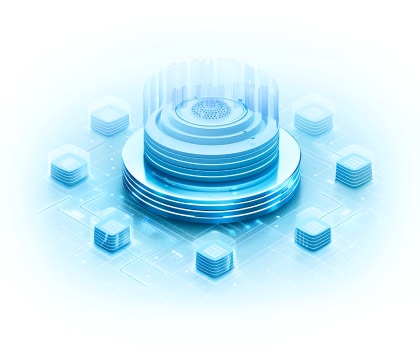
Built for Real-Time at Enterprise Scale

<100ms queries across billions of vertices and edges, enabled by a native massively parallel graph architecture.
Simple blue outline of a human brain, viewed from above, with a vertical line down the center dividing the two hemispheres.

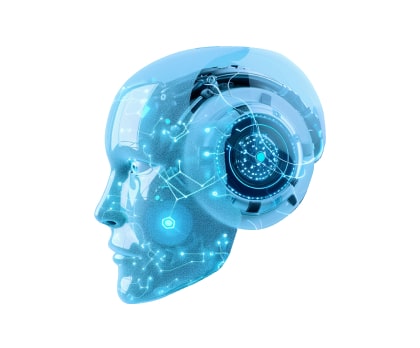
Designed for AI That Needs Context

The graph foundation behind GraphRAG and explainable AI preserving relationships to reduce hallucinations and improve accuracy.
A blue shield outline with a padlock symbol in the center, representing security or protection.

Enterprise-Grade by Design

ACID compliance, fine-grained security, and cloud-native deployment for mission critical workloads.
Small blue and white icon of a clipboard with horizontal lines representing text and two blue tabs at the top.

Traditional Databases

• Rows and columns
• Shallow relationship analysis
• Delayed insights
A blue icon with three connected circular nodes, each linked by blue lines, forming a triangular network shape on a white background.

TigerGraph Graph Database

Native relationship modeling
• Deep, multi-hop analysis
• Real-time analytics and AI
A user interface for TigerGraph DB shows a sidebar menu with options like Home and Design Schema, a central user icon connected to various data symbols, and a smiling man’s portrait in the corner.

Innovative Solutions across Industries

Addressing a wide spectrum of business and technological needs

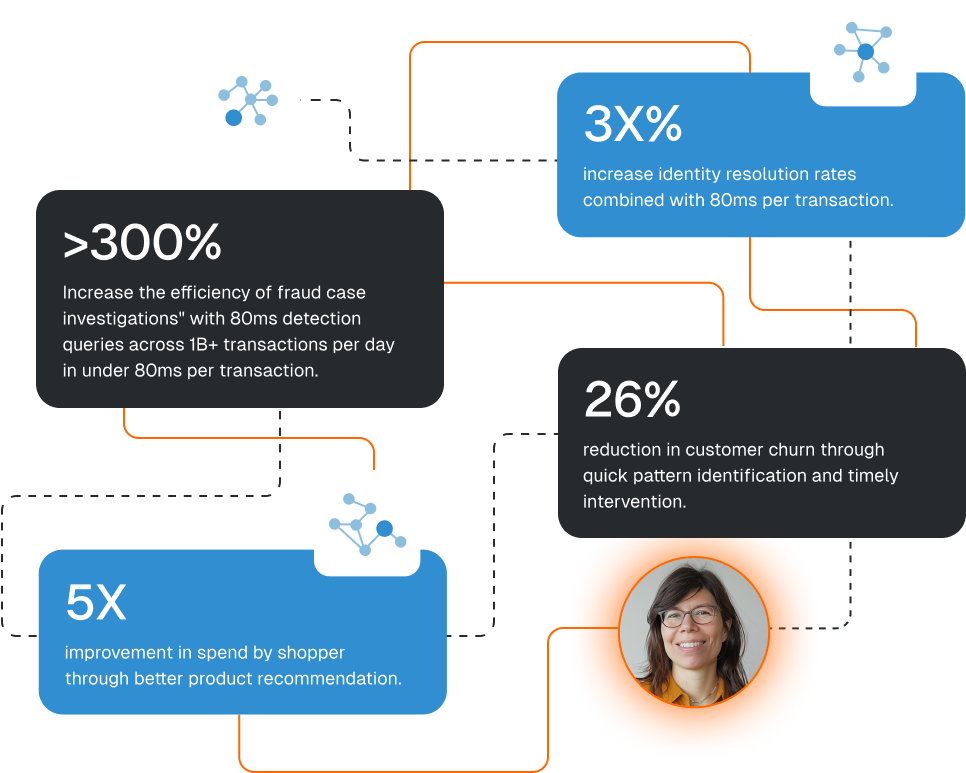
Optimize Your Business

Leading companies have chosen TigerGraph to provide better customer service, optimize their businesses, create new customer experiences, and more.

A 3D illustration of two transparent screens displaying digital data visuals, including a pie chart and bar graphs, standing on a glowing base. The color scheme is primarily blue with neon accents.

AI Powered Insights

Unlock hidden value from all your data with unmatched intelligence, maximizing your competitive advantage.

Futuristic digital illustration of a human-like head with a transparent blue skin. It features glowing circuitry and mechanical elements, symbolizing advanced technology and artificial intelligence.

Make Quicker Decisions

Build a digital twin of your whole operation and analyze it holistically so you can evaluate all the options and respond to opportunities and challenges in minutes not months.

Futuristic digital network illustration featuring a central, circular, layered structure emitting a blue glow, surrounded by smaller cubes, all interconnected by lines on a grid-like background.

Deepen Personalization

Integrate all your customer, product, and service data to deliver a seamless omnichannel experience, providing customers with cohesive interactions across all touchpoints.

Digital 3D wireframe model of a human head, rendered in blue tones, against a gradient background with subtle geometric patterns.
Start Your Journey with TigerGraph Today!

Why Practitioners Love Us

Helping deliver insights from massive and disparate datasets — where speed matters
Icon of a target with a dart hitting the center, symbolizing precision, goals, or success.

Blazing Performance, 100-1000x Faster

Unlock hidden value from all your data with unmatched intelligence, maximizing your competitive advantage.
Blazing Performance, 100-1000x Faster
Icon of a network structure with interconnected blocks, symbolizing a system or hierarchy.

Analytics in Real Time

ACID compliance on distributed systems, ensuring integration with your operational systems and up-to-date information.
Icon of a network with nodes connected by lines, and the letters

Massive Scale, 30-100x More Data

Effortlessly scale enormous datasets across multiple applications and instances, self-hosted or fully managed on the TigerGraph Savanna.
Icon of a cloud with three droplets below it, symbolizing rain or weather-related phenomena.

Cloud Deployments to Fit Your Needs

Select your cloud provider and choose who manages the data.

TigerGraph in the Spotlight

Orange promotional graphic for a TigerGraph webinar titled Revolutionize Anomaly Detection: Unlocking Advanced Insights and Actionable Recommendations with Hybrid Search, scheduled for April 29th, 10am PT / 1pm ET.
Webinar
Tue 29 Apr 2025
Revolutionize Anomaly Detection: Unlocking Advanced Insights and Actionable Recommendations with Hybrid Search
Man speaking at a podium under the CDO Chief Data Officer Magazine banner. The text states April 24th, 2025, Leadership Summit, CDO Magazine Atlanta.
Event
Thu 24 Apr 2025
Uncovering Financial Fraud: How Graph Technology Transforms Detection in Banking
CDO Magazine Atlanta Leadership Summit April 24th
View
View All

What Our
Customers Say

Xbox logo
"One of the reasons why we chose TigerGraph was performance – TigerGraph was the only company that could ingest our data in 3.5 hours, while the other companies would take 7 hours."
John Conway
Principal Software Developer
opencorporates logo
"TigerGraph’s excellent scalability and performance enables us to achieve things we previously could not do, and to better support ongoing investigative work in the process."
Chris Taggart
CEO
intuit white logo
"The power of graph + AI is to elevate data to connected data, enrich with semantics as a knowledge graph, to streamline and scale our AI efforts, ultimately translating to a personalized experience for everybody."
Distinguished Engineer and Architect
myelin health logo
"It is much easier to integrate clinical and financial data with TigerGraph and drive clinical and financial outcomes than any other database solutions."
Kevin Henderson, MD
Chief Medical Information Officer
illumina white logo
"To tackle all the scattered data correlations within our processes, Illumina has onboarded TigerGraph Savanna to begin building an analytical bridge between the many complex processes to tackle manufacturing bottlenecks and improve investigation turn-around time."
Stephen Horn
Staff Data Engineer, Global Ops
hoptek white logo
"TigerGraph enables Hoptek to offer a real-time and AI-powered operations digital twin and decision engine, able to compute thousands of real-life routes in milliseconds."
Balaji Guntur
CEO and Co-founder, Hoptek
jlr white logo
"Graph has de-siloed our business — once you create data that crosses boundaries, you foster collaboration. That comes from the existence of a graph database that allows us to talk about meaningful information."
Director of Data and Analytics
A man with a beard and a green sweater draped over his shoulders is focused on a computer screen. The image is partially overexposed, creating a soft white fade on the left side.

Ready to Harness the Power
of Connected Data?

Start your journey with TigerGraph today!