The Large Utility Accelerates Circuit Planning with Real-Time Graph Analytics

The Challenge
The large utility needed to modernize energy management as renewables, competition, and regulation reshaped the market. Manual circuit planning took more than a year, limiting the speed of assessments and operational decisions.
The Solution
Implemented TigerGraph to model circuit status, dependencies, constraints, and parameters, enabling multi-hop supply chain analysis, real-time load visualization, and faster assessment of re-routing requirements across the energy grid.
The Results
Implemented TigerGraph to model circuit status, dependencies, constraints, and parameters, enabling multi-hop supply chain analysis, real-time load visualization, and faster assessment of re-routing requirements across the energy grid.
The Challenge
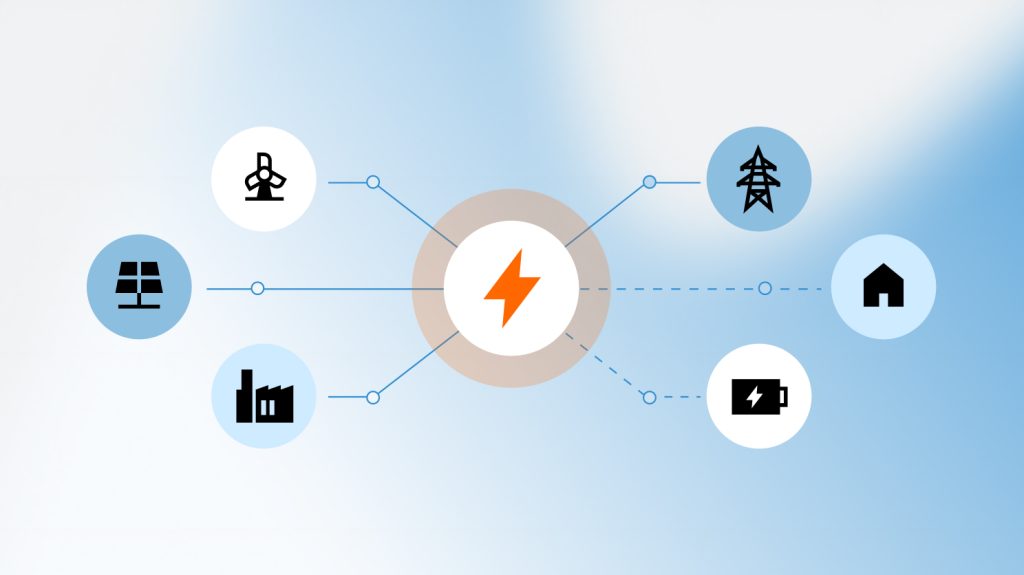
The large utility was operating in a market transformed by the rise of renewable energy, increased competition, and a burdensome regulatory environment. The company needed to adapt its energy management system while continuing to modernize the grid and manage a diverse portfolio of generation assets.
Circuit planning was an especially acute challenge. The process involved both supply chain relationships and Internet of Things devices, creating a complex network of operational dependencies that had to be understood before assessments and decisions could be made.
With its existing manual process, planning a circuit took the large utility more than a year.
The company needed a faster way to understand circuit status, dependencies, constraints, parameters, and load conditions so teams could evaluate re-routing requirements and make energy management decisions more efficiently.
Circuit planning was an especially acute challenge. The process involved both supply chain relationships and Internet of Things devices, creating a complex network of operational dependencies that had to be understood before assessments and decisions could be made.
With its existing manual process, planning a circuit took the large utility more than a year.
The company needed a faster way to understand circuit status, dependencies, constraints, parameters, and load conditions so teams could evaluate re-routing requirements and make energy management decisions more efficiently.
The Solution
The large utility implemented TigerGraph to enhance supply chain management through multi-hop analysis and develop circuit load visualization through real-time querying. The graph model connected the operational elements required to understand how equipment, circuits, and dependencies affected energy-grid performance.
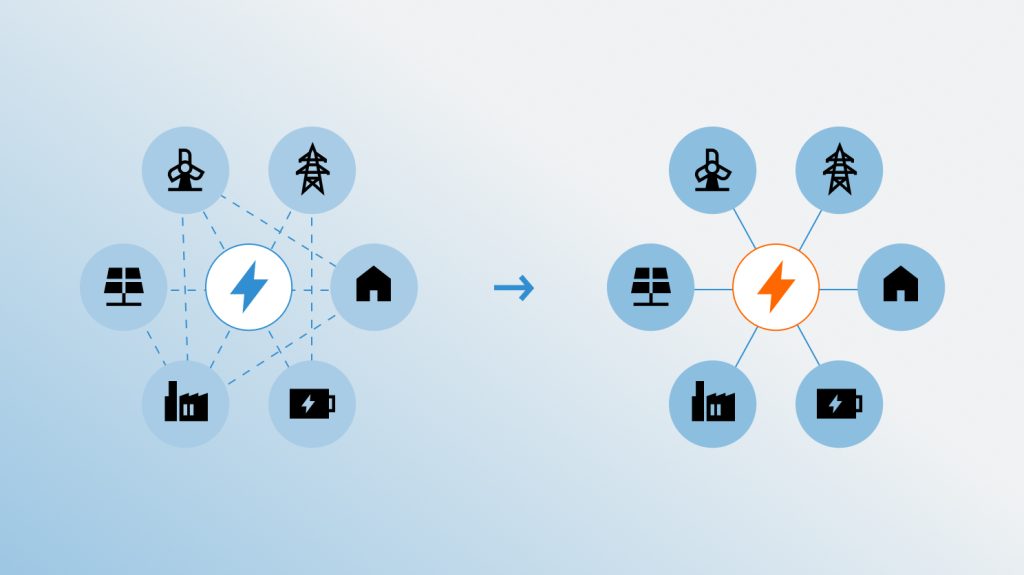
TigerGraph stored circuit status, dependencies, constraints, and parameters in a connected structure, giving the large utility the ability to evaluate how changes in one part of the network could affect other components. The graph shown in the source document models relationships among substations, breakers, units, loads, buses, connectors, transformers, disconnectors, and geographic coordinates.
This connected representation enabled the large utility to assess circuit conditions, visualize load relationships, and respond when re-routing was required. TigerGraph’s real-time query performance met the company’s requirements for balancing energy-grid load, which the source states no other graph alternative could satisfy.
TigerGraph stored circuit status, dependencies, constraints, and parameters in a connected structure, giving the large utility the ability to evaluate how changes in one part of the network could affect other components. The graph shown in the source document models relationships among substations, breakers, units, loads, buses, connectors, transformers, disconnectors, and geographic coordinates.
This connected representation enabled the large utility to assess circuit conditions, visualize load relationships, and respond when re-routing was required. TigerGraph’s real-time query performance met the company’s requirements for balancing energy-grid load, which the source states no other graph alternative could satisfy.
The Results
TigerGraph dramatically accelerated the large utility’s circuit planning assessments and decisions, replacing a manual process that previously required more than a year. The large utility company gained real-time visibility into circuit loads, dependencies, constraints, and parameters, enabling teams to respond more effectively when grid re-routing was required.
The implementation also strengthened the large utility’s ability to apply advanced analytics to energy management in a highly competitive and rapidly evolving market. By introducing real-time graph analysis, the large utility advanced the transformation of its digital platform and improved its ability to make complex energy-management assessments and decisions.
The implementation also strengthened the large utility’s ability to apply advanced analytics to energy management in a highly competitive and rapidly evolving market. By introducing real-time graph analysis, the large utility advanced the transformation of its digital platform and improved its ability to make complex energy-management assessments and decisions.



Ready to Harness the Power of Connected Data?
Start your journey with TigerGraph today!