Contact Us
Back to Blog

Paige Leidig

Chief Marketing Officer

Paige brings over 20 years of experience in enterprise marketing leadership, with a strong background in brand building, driving growth, product and customer marketing. As Chief Marketing Officer, he leads our marketing efforts to increase brand awareness, communicate our unique value proposition, drive growth across key markets, and showcase the positive impact we deliver to our customers. Prior to joining TigerGraph, Paige has held executive marketing leadership roles at several notable and category defining organizations, including SIMCO Electronics, Simpplr, Quid, CipherCloud, SAP, and Ariba. Paige holds a MS in Finance from the University of Houston and a BS in Chemistry from Davidson College (alma mater of basketball star Steph Curry). In his spare time he likes to travel and surf all over the world, go hiking in the sierras, play squash, do CrossFit, and spend time with family and friends.


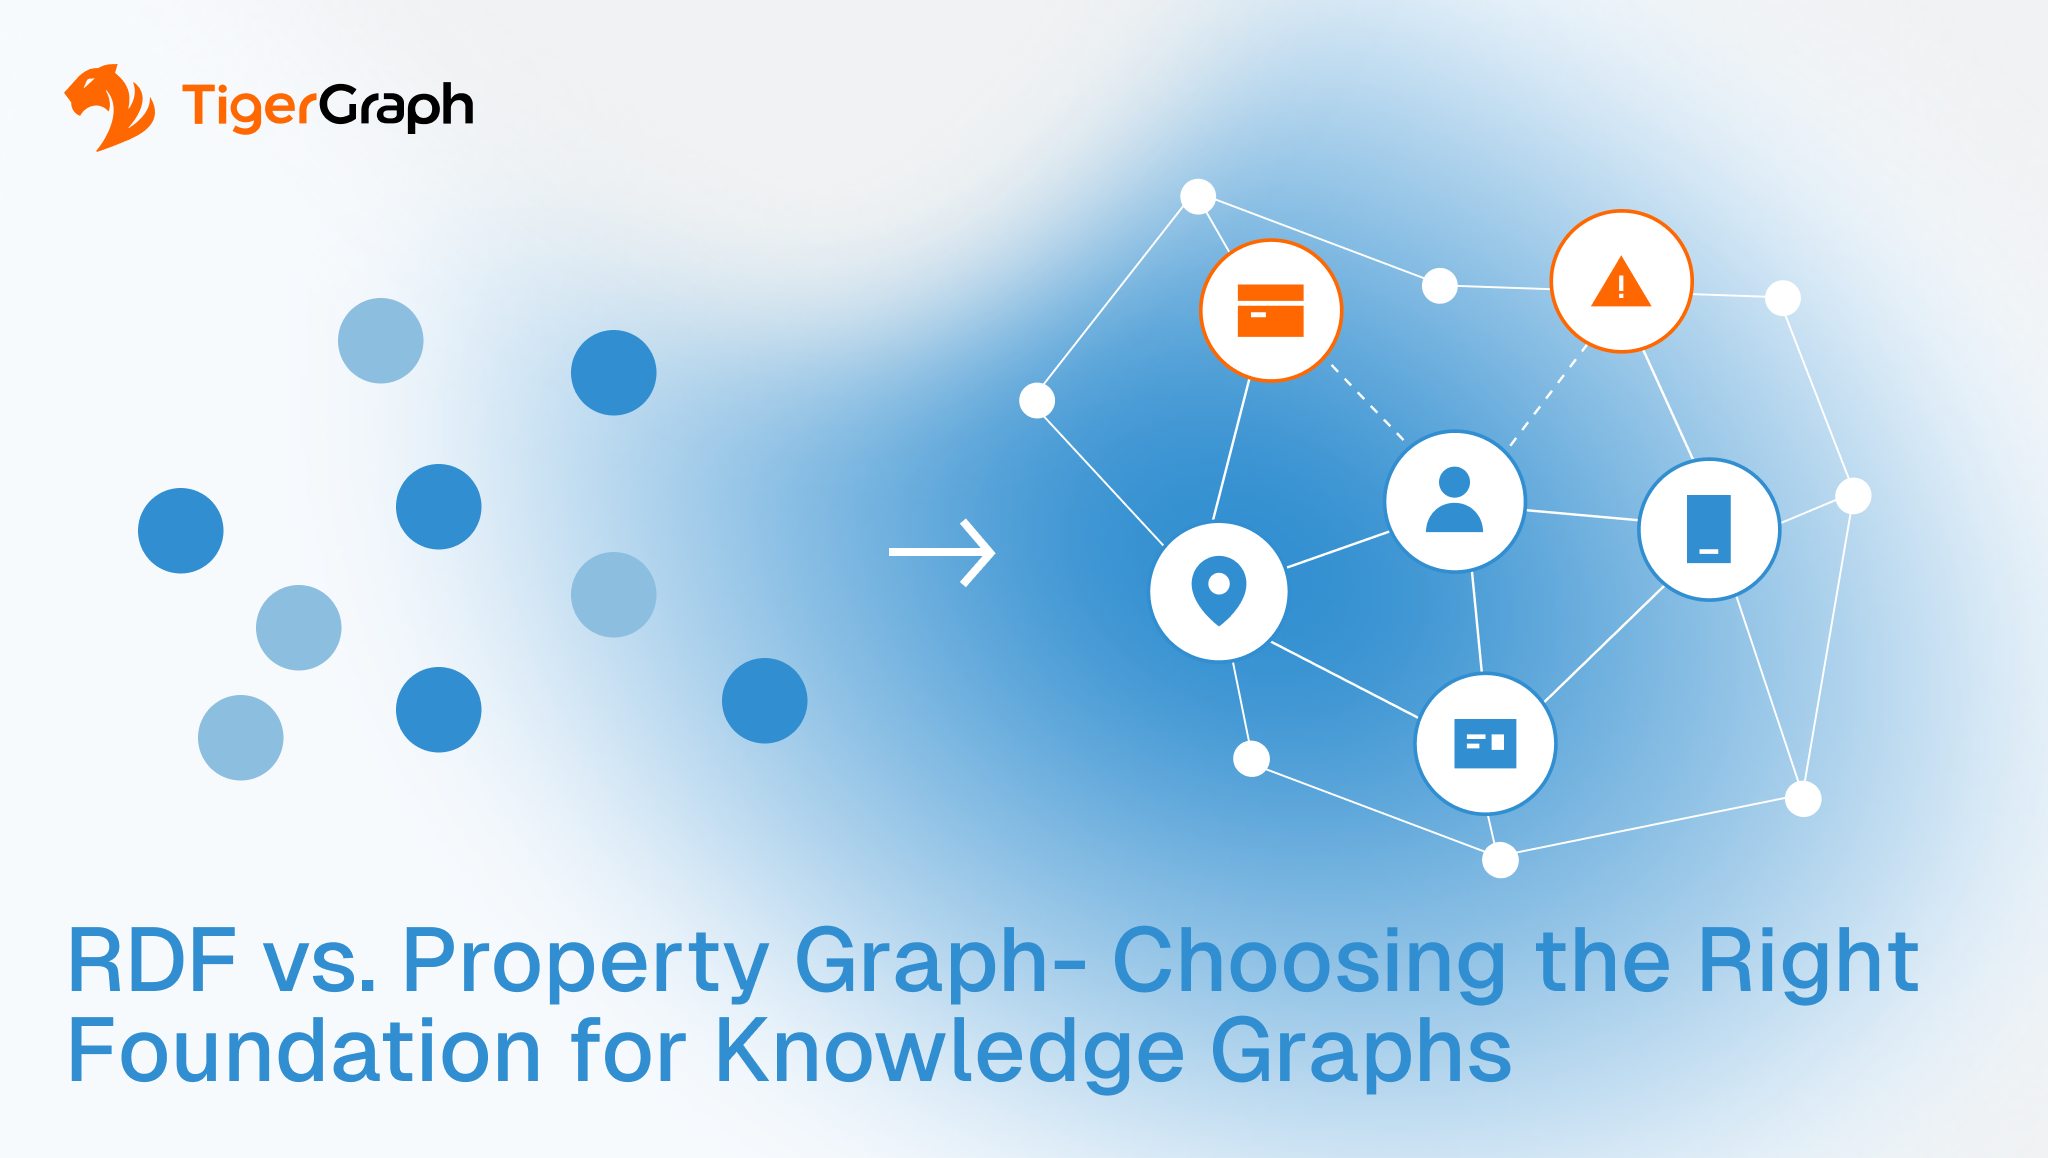
A diagram compares RDF dots on the left with a property graph on the right, showing connected nodes and icons. Text reads: RDF vs. Property Graph – Choosing the Right Foundation for Knowledge Graphs. TigerGraph logo is in the top left.
RDF vs. Property Graph: Choosing the Right Foundation for Knowledge Graphs
Discover
An infographic shows three documents with question marks, connected by arrows and warning icons, illustrating repeat investigations. The TigerGraph logo is in the top left, and a caption below reads: “Repeat Investigations Signal Entity Resolution Failures That Inflate Casework.”.
Repeat Investigations Signal Entity Resolution Failures That Inflate Casework
Discover
Blue graphic with the TigerGraph logo, diagrams showing interconnected icons (people, computers, globes), and a central AI circle. Text reads: Knowledge Graphs as the Missing Context Layer for AI.
Knowledge Graphs as the Missing Context Layer for AI
Discover
A network diagram with banking and AI icons, some with orange masks, illustrates connections. The TigerGraph logo is in the top left. Blue text reads: AI in Banking: Why Financial Institutions Became Early Adopters and How Trusted Data Strengthens Every Decision.
AI in Banking: Why Financial Institutions Became Early Adopters and How Trusted Data Strengthens Every Decision
Discover
A network of interconnected blue, white, and orange circles symbolizing a graph database, with a magnifying glass highlighting some nodes. TigerGraph logo is in the top left. Text reads: Modeling Molecules and Beyond: How Graph Databases Unlock Scientific Discovery.
Modeling Molecules and Beyond: How Graph Databases Unlock Scientific Discovery
Discover
A diagram illustrating a graph database use case with connected nodes labeled Customer 360, Supply Chain, Fraud Ring Detected, and Cyber Network Path. TigerGraph logo in the top left corner on a black background.
How Graph Databases Move You From Data Points to Decisions
Discover
TigerGraph logo and text: Why Hybrid Graph Architecture Strengthens Agentic AI on a black background with abstract connected nodes.
Why Hybrid Graph Architecture Strengthens Agentic AI
Discover
A central orange warning icon is connected by dotted lines to six blue security, finance, and user icons, illustrating the concept of connected risk. TigerGraph and Connected Risk are written on the left against a black background.
Connected Risk in Banking: How Graph Databases Build Resilience for Banks
Discover
Show More