Contact Us
Back to Blog

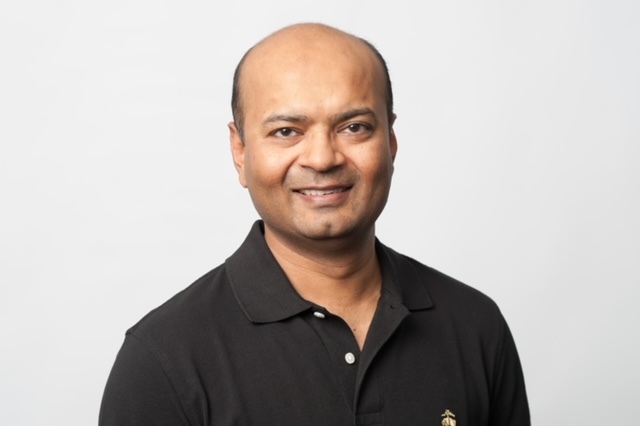
Rajeev Shrivastava

CHIEF EXECUTIVE OFFICER

Rajeev brings extensive leadership experience from top technology companies. Previously, he drove significant growth and innovation at Google and NICE inContact, leading major strategic initiatives and successful mergers. His expertise in scaling businesses and fostering innovation is underpinned by an MBA from the Wharton School and a Bachelor’s degree from Delhi College of Engineering. Prior to joining TigerGraph, Rajeev was at Google, where he served as GM & Product Lead for an AI-first Customer Conversation Platform. In this role, he managed a significant P&L and led teams driving innovation and growth within Google’s expansive business landscape. Previously, Rajeev played a pivotal role in the growth of NICE inContact as their Chief Product & Strategy Officer. Prior to NICE inContact, Rajeev led go-to-market and marketplace initiatives at Rackspace.
Dark background with TigerGraph logo, scattered blue nodes converging into an orange circle, and text Context Defines the Decision. Source: McKinsey & Company, Rewired (2026).
McKinsey Is Right: AI Needs Context. Almost No One Has It.
Discover
A digital graphic for TigerGraph features the text “Data isn’t the problem. Context is.” over a network graph with orange nodes forming an upward trend. Smaller text reads “Less noise. More signal.” TigerGraph’s logo appears in orange.
Data Isn’t the Problem. Context Is.
Discover
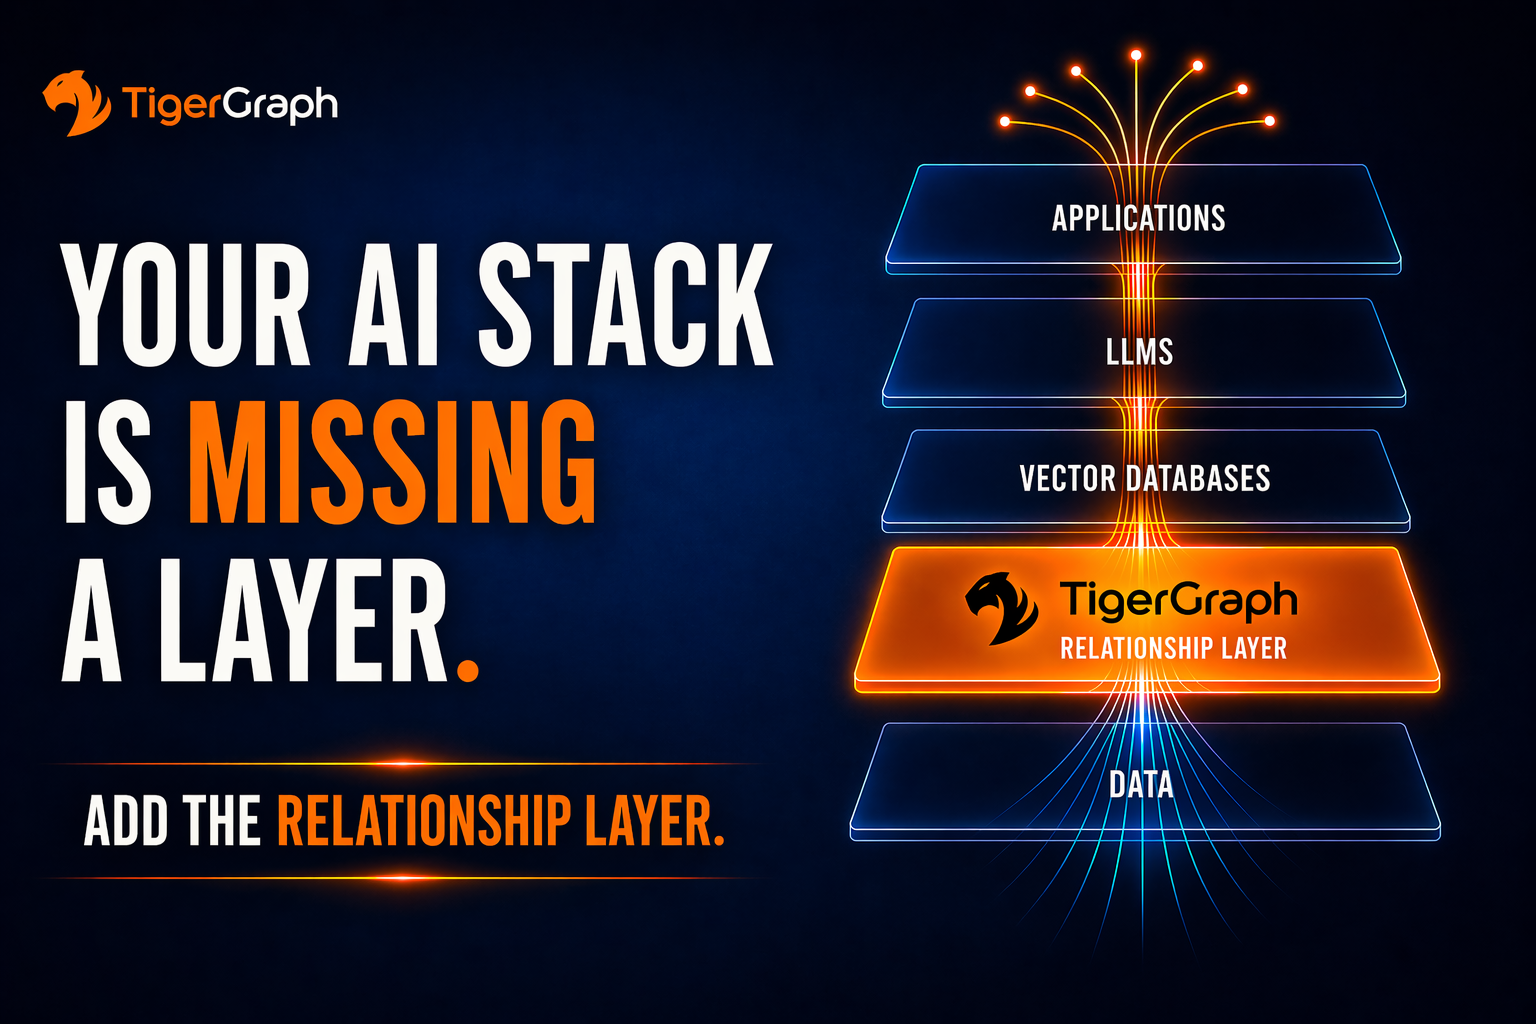
A graphic shows an AI stack with five layers: Applications, LLMs, Vector Databases, Relationship Runtime for AI (highlighted), and Data. Text reads, Your AI stack is missing a layer. Add the relationship layer. TigerGraph logo included.
The Missing Layer in Your AI Stack
Discover
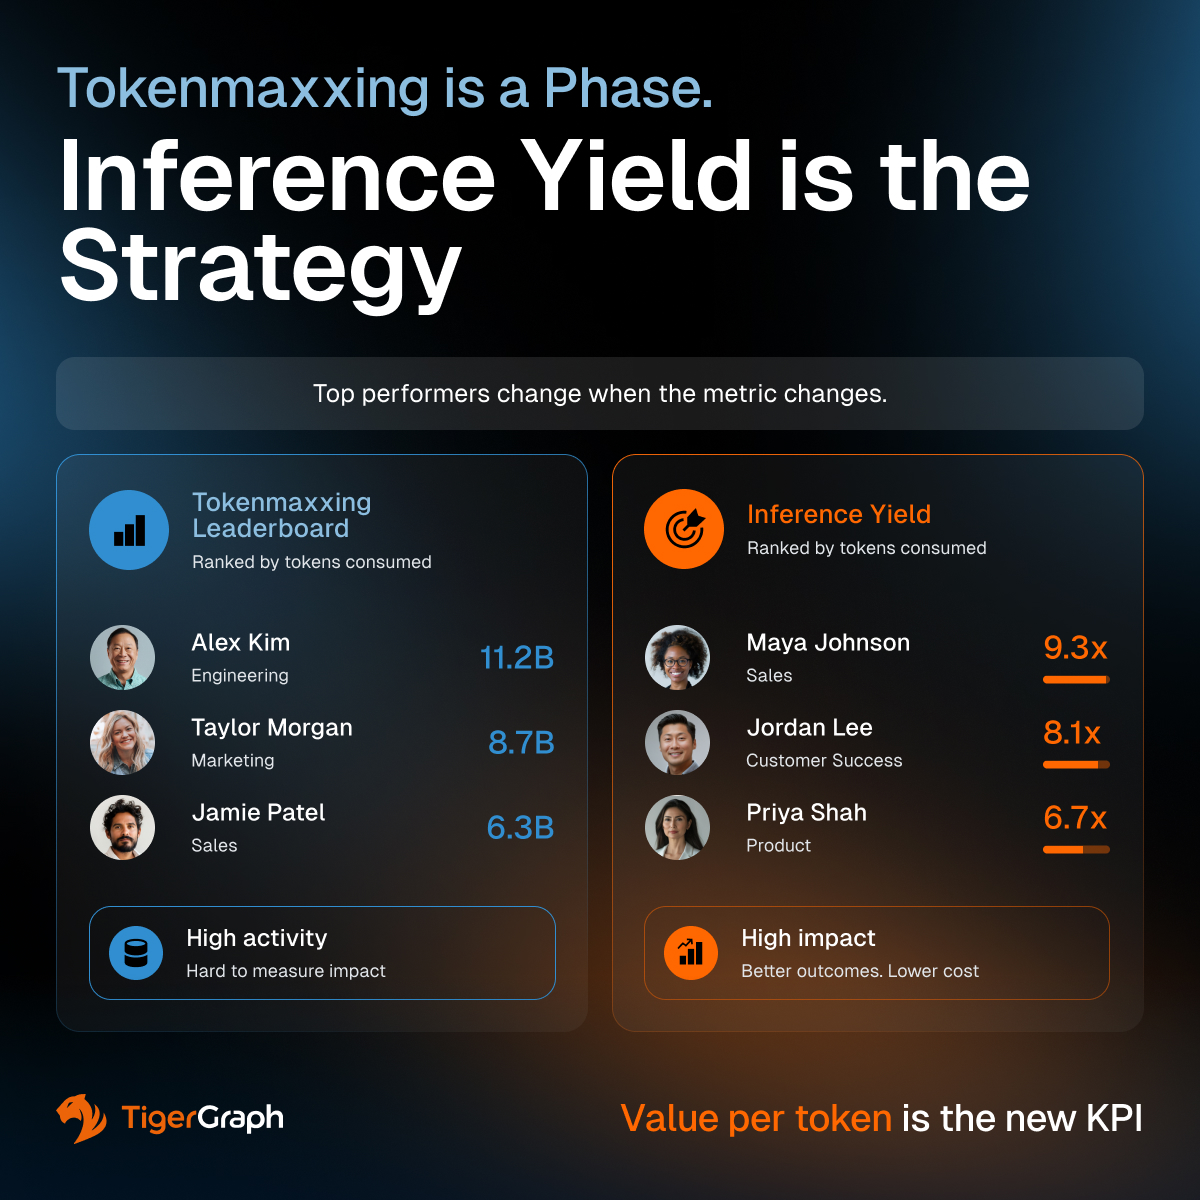
An infographic compares Tokenmaxxing and Inference Yield leaderboards, showing top performers change as metrics shift. Tokenmaxxing lists Alex Kim, Taylor Morgan, Jamie Patel; Inference Yield lists Maya Johnson, Jordan Lee, Priya Shah.
Tokenmaxxing is a Phase. Inference Yield is the Strategy.
Discover
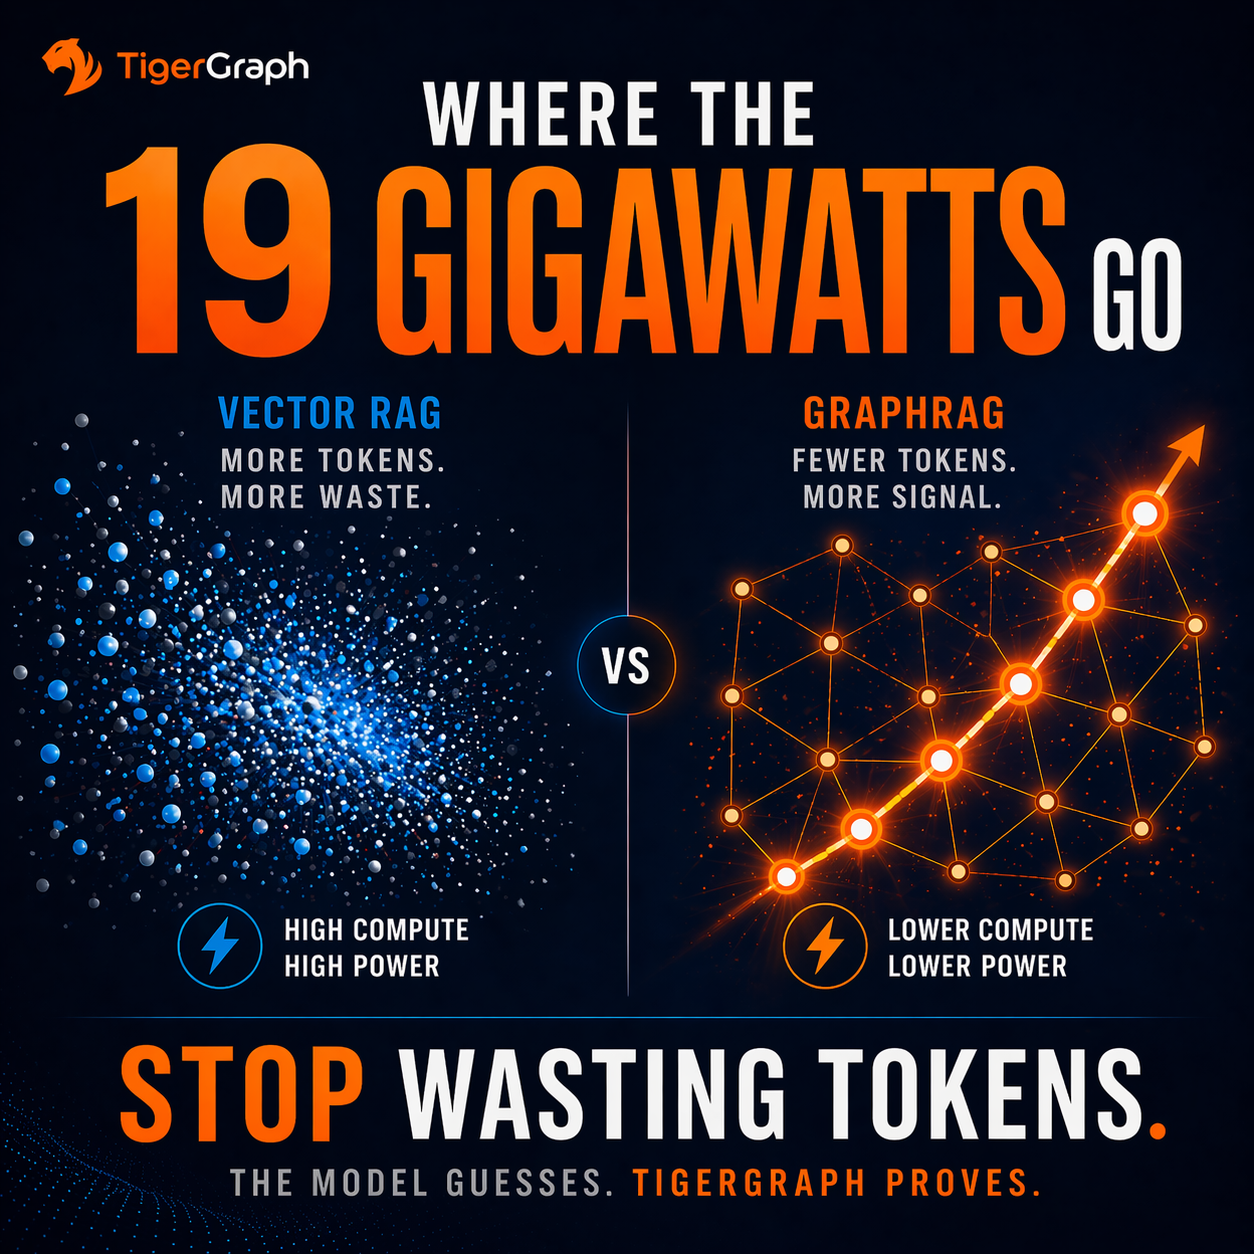
Infographic compares Vector RAG and GraphRAG token usage: scattered blue dots (high compute/power) vs. connected orange nodes (lower compute/power). Learn how to reduce AI inference cost and tokens—stop wasting resources today!.
AI Is Facing a 19-Gigawatt Power Gap. Here’s the Fix.
Discover
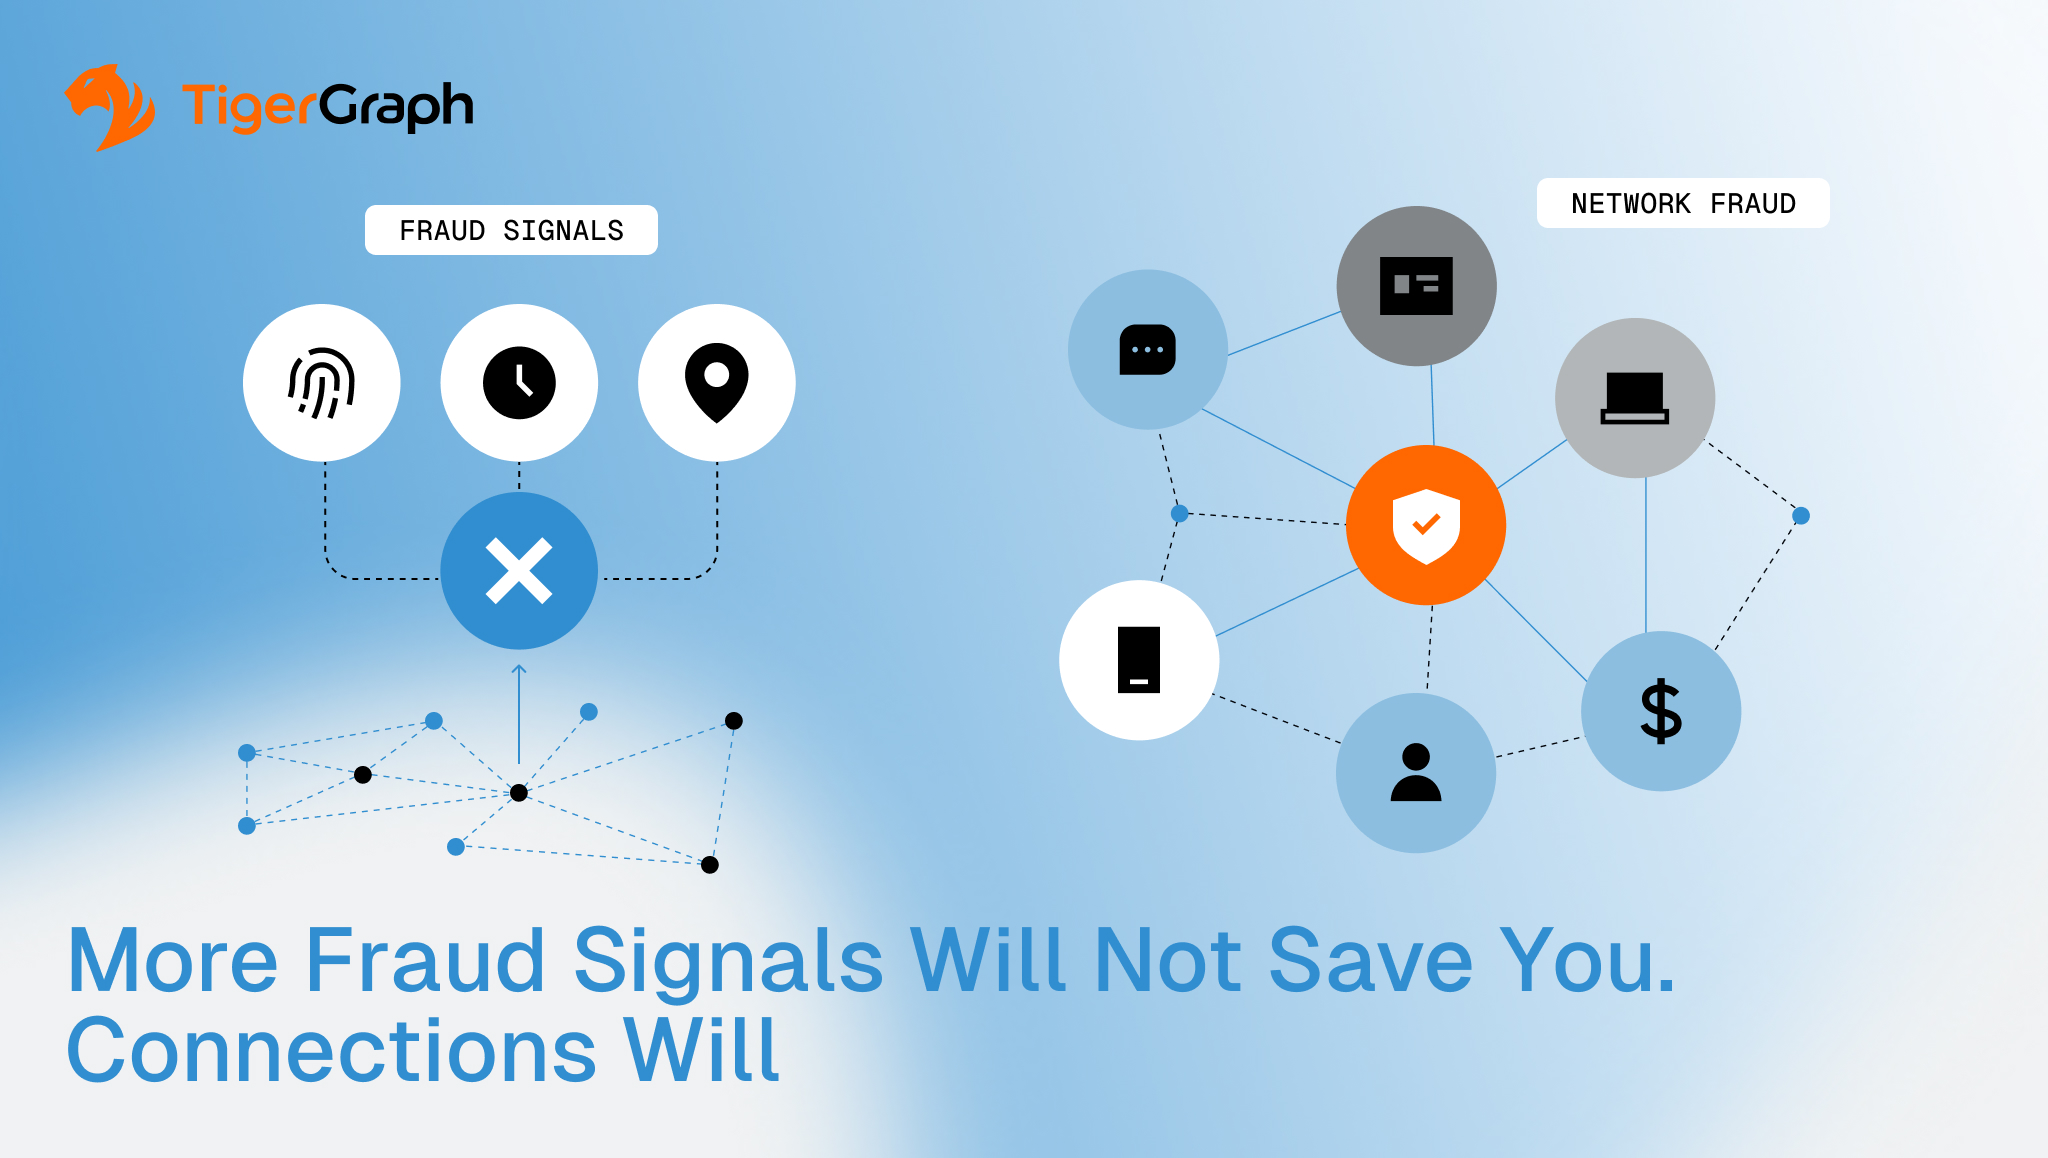
A graphic shows icons for fraud signals and connected network devices, with the text: More Fraud Signals Will Not Save You. Connections Will. The TigerGraph logo appears in the top left corner.
More Fraud Signals Will Not Save You. Connections Will.
Discover
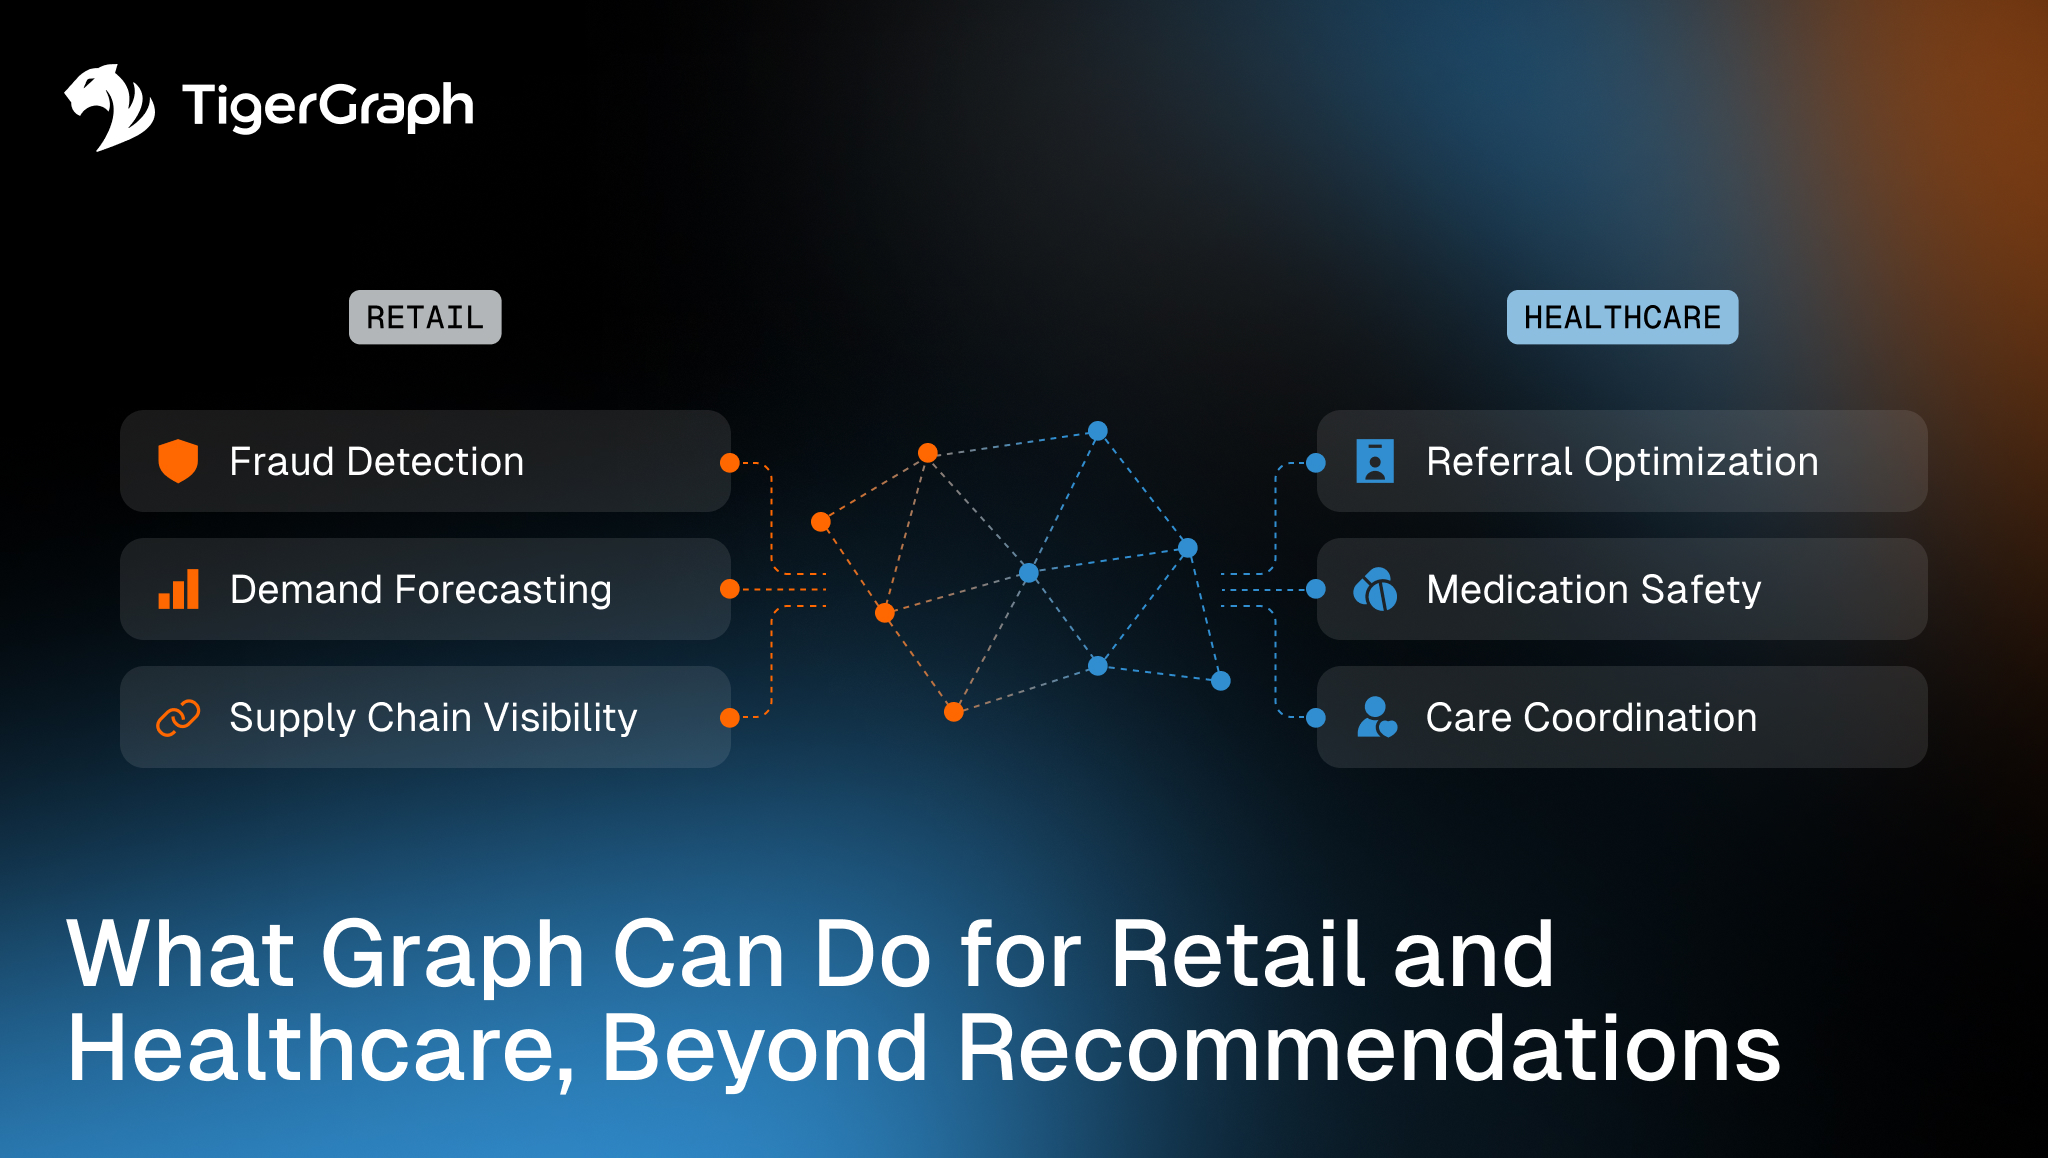
An infographic by TigerGraph shows how graph technology benefits retail—fraud detection, demand forecasting, supply chain visibility—and healthcare—referral optimization, medication safety, care coordination—beyond recommendations.
What Graph can do for Retail and Healthcare, Beyond Recommendations
Discover
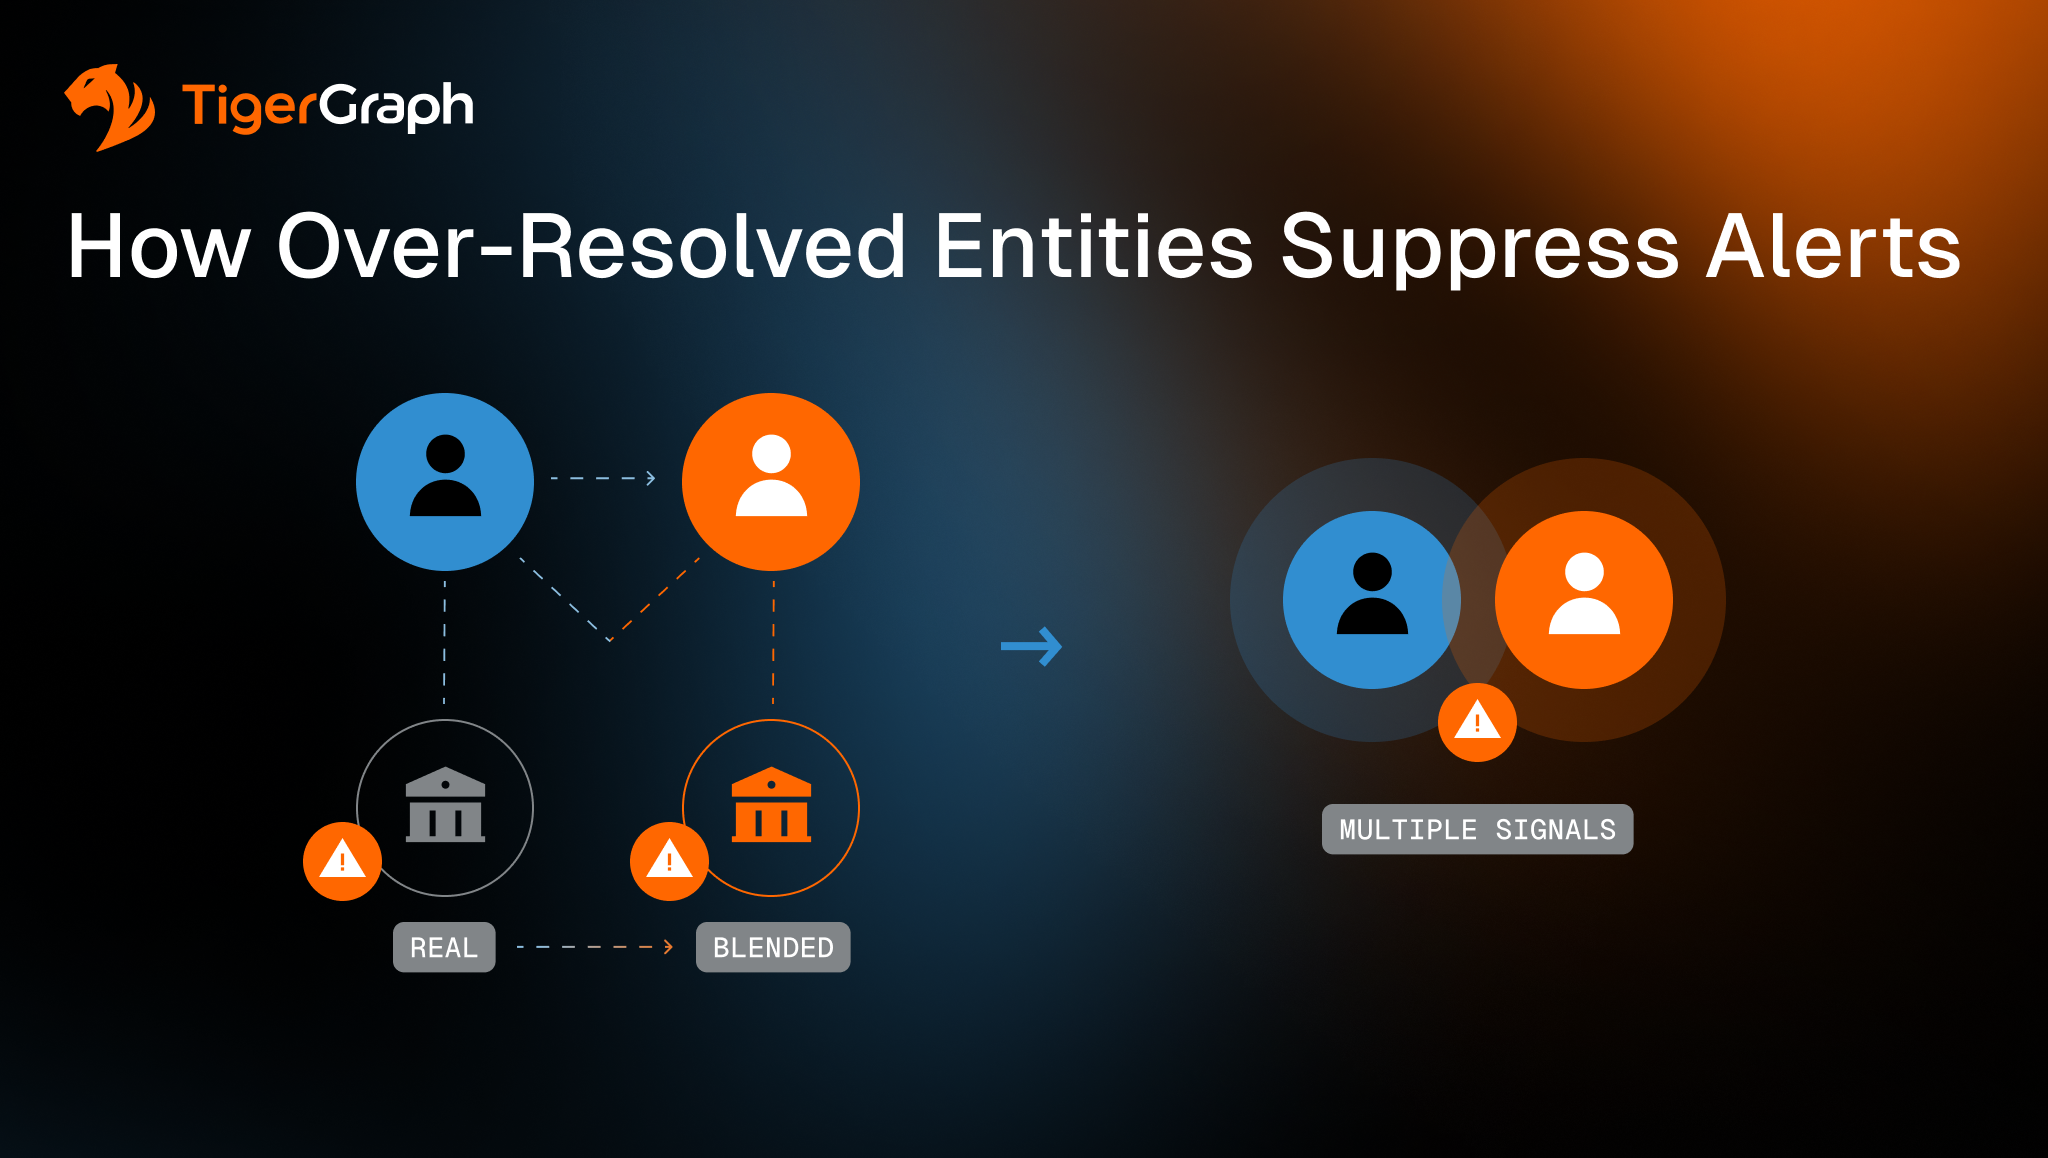
Infographic titled How Over-Resolved Entities Suppress Alerts shows user icons linked to institutions with alert symbols, merging into overlapping circles labeled Multiple Signals. TigerGraph logo is at the top left.
How Over-Resolved Entities Suppress Alerts 
Discover
Show More