Skip to content
START FOR FREE
START FOR FREE
  • SUPPORT
  • COMMUNITY
  • CONTACT
Menu
  • SUPPORT
  • COMMUNITY
  • CONTACT
MENUMENU
  • Products
    • The World’s Fastest and Most Scalable Graph Platform

      LEARN MORE

      Watch a TigerGraph Demo

      PRODUCTS

      • Why Graph?
      • Products Overview
      • What's New
      • GraphStudio User Interface
      • Visualization Toolkits
      • GSQL Query Language
      • Connectors

      TigerGRAPH ENTERPRISE

      • Enterprise Overview
      • Features

      TIGERGRAPH CLOUD

      • Cloud Overview
      • Cloud Starter Kits
      • Login/Sign Up
      • FAQ
      • Pricing
      • Marketplaces

      Graph Data Science

      • Graph Data Science Library
      • Machine Learning Workbench

      TRY TIGERGRAPH

      • Get Started for Free
      • Compare Editions
      • Test Drive - Online Demo
      • Watch Demos
      • Request a Demo
  • Solutions
    • The World’s Fastest and Most Scalable Graph Platform

      LEARN MORE

      Watch a TigerGraph Demo

      Solutions

      • Solutions Overview

      INCREASE REVENUE

      • Customer Journey/360
      • Product Marketing
      • Entity Resolution
      • Recommendation Engine

      MANAGE RISK

      • Fraud Detection
      • Anti-Money Laundering
      • Threat Detection
      • Risk Monitoring

      IMPROVE OPERATIONS

      • Supply Chain Analysis
      • Energy Management
      • Network Optimization

      By Industry

      • Advertising, Media & Entertainment
      • Financial Services
      • Healthcare & Life Sciences

      FOUNDATIONAL

      • AI & Machine Learning
      • Time Series Analysis
      • Geospatial Analysis
  • Customers
    • The World’s Fastest and Most Scalable Graph Platform

      LEARN MORE

      CUSTOMER SUCCESS STORIES

      • Citrix
      • Ford
      • Intuit
      • JPMorgan Chase
      • READ MORE SUCCESS STORIES
      • Jaguar Land Rover
      • United Health Group
      • Xbox
  • Partners
    • The World’s Fastest and Most Scalable Graph Platform

      LEARN MORE

      PARTNER PROGRAM

      • Partner Benefits
      • TigerGraph Partners
      • Sign Up
      TigerGraph partners with organizations that offer complementary technology solutions and services.​
  • Resources
    • The World’s Fastest and Most Scalable Graph Platform

      LEARN MORE

      BLOG

      • TigerGraph Blog

      RESOURCES

      • Resource Library
      • Benchmarks
      • Demos
      • O'Reilly Graph + ML Book

      EVENTS & WEBINARS

      • Graph+AI Summit
      • Trade Shows
      • Graph for All - Million Dollar Challenge
      • Webinars

      DEVELOPERS

      • Documentation
      • Ecosystem
      • Developers Hub
      • Community Forum

      SUPPORT

      • Contact Support
      • Production Guidelines

      EDUCATION

      • Certification
      • Training
  • Company
    • Join the World’s Fastest and Most Scalable Graph Platform

      WE ARE HIRING

      COMPANY

      • Company Overview
      • Leadership
      • Legal Terms

      CAREERS

      • Join Us
      • Open Positions

      AWARDS

      • Awards and Recognition
      • Leader in Forrester Wave
      • Gartner Research

      PRESS RELEASE

      • Read All Press Releases
      TigerGraph Delivers 600% ROI and $20.81M in Net Present Value in Total Economic Impact Study
      May 12, 2022
      Read More »

      NEWS

      • Read All News
      News

      TigerGraph expands its presence in France

      entrepreneur

      We Asked Entrepreneur Readers: How Do You Inspire Yourself, and Others?

  • START FOR FREE
    • The World’s Fastest and Most Scalable Graph Platform

      GET STARTED

      • Request a Demo
      • CONTACT US
      • Try TigerGraph
      • GET STARTED FOR FREE
      • TRY AN ONLINE DEMO

Curating and Hyper-personalizing the Banking Customer Journey

  • TigerGraph
  • May 6, 2022
  • blog, Customer 360, Finance
  • Blog >
  • Curating and Hyper-personalizing the Banking Customer Journey

Why is it important for banks to hyper-personalize their customers’ journeys?

Customer experience (CX) is a widely known competitive differentiation factor for consumer companies. Retail banking as a sector has driven some significant advances in the digital banking journeys that customers can take. 

The revenue opportunity for banks in providing a leading CX is estimated to be $300m in growth for every $100bn in assets that a bank has. In fact, being in the top quartile for CSAT is associated with almost double the compound annual growth rate.

The pandemic has only accelerated the adoption of digital banking and “50% of consumers now interact with their bank through a mobile app or website at least once a week, compared with just 32% two years ago.”

But being a top quartile CX leader is not just about supporting omnichannel and customer 360 anymore. The new customer experience leaders center on the customer’s whole journey – using the end-to-end context within which any individual interaction is happening to optimize that single touchpoint.

Customers now expect their banks to help them with their deeper needs, and they want that help to be presented to them at exactly the right time and in the most convenient place.
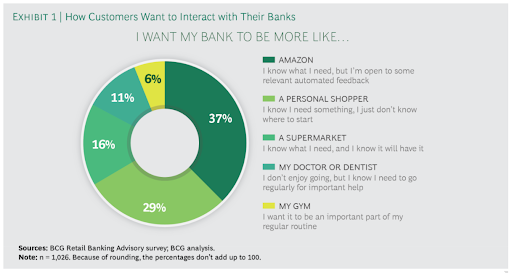
Banking customer expectations

Examples of Banks Helping Customers

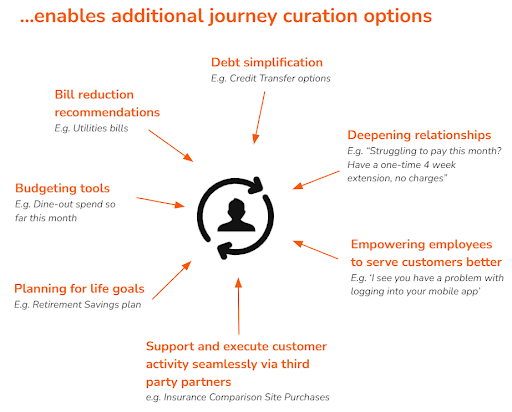
Here are some examples of proactive interventions a bank can make in a customer’s journey:

  • Bill reduction recommendations
  • Budgeting tools
  • Planning for life goals
  • Debt simplification
  • Deepening relationships
  • Empowering employees to serve customers better

Essentially, it’s anything in relation to helping a customer manage their money and optimize their budget – whether the proactive intervention can directly generate revenue for the bank or not.

So why doesn’t my bank seem to be hyper-personalizing my journey like this?

Not all banks are curating customers’ personal journeys yet because it is technically really difficult. Banks have complex technical architectures that traditionally were not built to support the real-time consumption environment they are being upgraded to support today.

Consider all of the systems in place to support every customer, their products, needs, and their digital journeys today … it might look something like this:
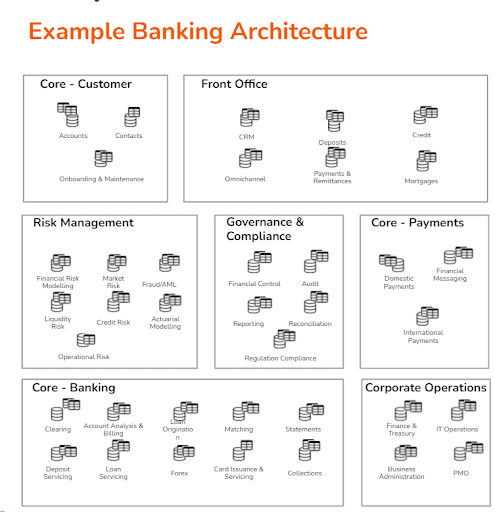
Example banking architecture

And consider the capabilities that this architecture would need to have in order to curate personal journeys at any time, on any channel, according to any relevant need.

Technical Capabilities Required

As-is Technical Structures

Data must be fully connected

X Siloed data

Data must be easily moveable, transformable, updateable

X Monolithic architecture

Data often needs to be available at real-time speeds

X Systems built for batch integration

Enterprise-grade connected scalability

X Scale only within data silo

Insight automation as triggers within the customer journey

X Manually generated customer insight

Curation of individual customer journeys is a really complex thing to achieve.

Let’s consider an example where a bank is looking to instate a recommendation system for customers whose mobile phone bills seem unnecessarily high. The system needs to identify an expensive mobile bill, determine a better and relevant mobile contract option, and then choose the most effective way to engage that customer with the recommendation.
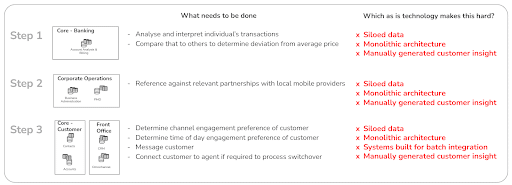
Mobile phone billing recommendations

The nature of the problem requires connected data, automated insight, and real-time availability, which is technically very difficult to do with traditional banking systems in place.

Enter TigerGraph’s Graph Database

TigerGraph’s native graph database and inbuilt analytics engine offer a solution to connect all of your data, produce automated insight, and make it available in real-time. Once you load your data into TigerGraph and connect it all together, you can then use its native analytics to perform sophisticated search queries over that connected data – the results of which are available as raw data (via CSV or API) or within native visualization.
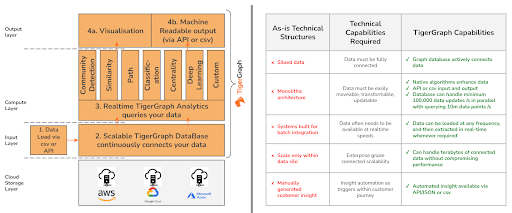
TigerGraph implementation layers

So how does TigerGraph help create the capabilities required to support a real-time journey curation engine?

Technical Capabilities Required

As-is Technical Structures

TigerGraph’s Capabilities

Data must be fully connected

X Siloed data

  • Graph database actively connects data

Data must be easily moveable, transformable, updateable

X Monolithic architecture

  • Native algorithms enhance data
  • API or CSV input and output
  • Database can handle minimum 100,000 data updates /s in parallel with querying 10m data points /s

Data often needs to be available at real-time speeds

X Systems built for batch integration

  • Data can be loaded at any frequency and extracted without compromising performance

Enterprise-grade connected scalability

X Scale only within data silo

  • Can handle terabytes of connected data without compromising performance

Insight automation as triggers within the customer journey

X Manually generated customer insight

  • Automated insight available via API/JSON or CSV

Mobile Phone Bill Recommendation in Practice

Let’s step through the mobile phone bill recommendation example to explore how TigerGraph can support the personalization of individual customer journeys.
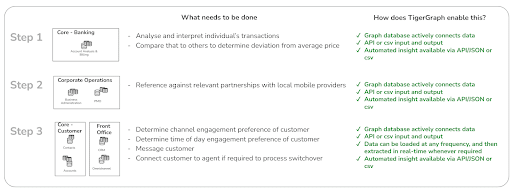
Mobile phone billing recommendation in practice

By querying connected data in TigerGraph, the relevant information can be returned to trigger a customer communication with the alert and recommendation. We can think of the three-step process as three query areas that together produce the information we need to perform the recommendation.
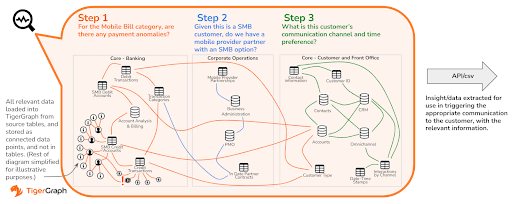
Three-step query process

And crucially, this information is available in real-time, via API. The queries you build in TigerGraph effectively become REST APIs available to the rest of your banking architecture whenever you need them.

With TigerGraph, it is now possible to run a real-time customer journey curation engine, including:

  • Connected data
  • Automated insight 
  • Real-time availability

Other Customer Journey Use Cases

If you have the data to load and connect within TigerGraph, you can support a variety of customer journey use cases. Loading and connecting more data within your TigerGraph database means you can perform more, and more sophisticated, analytics across all of that connected data.
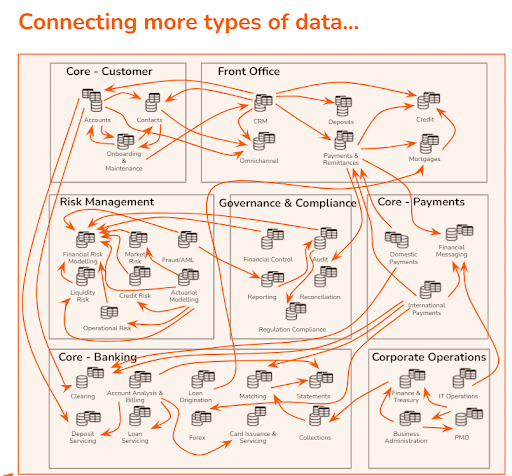
Connecting more data types

Journey curation options

“The business value of using TigerGraph is clear, but would introducing TigerGraph to my architecture require decommissioning of, or integration with, anything else?”

TigerGraph is additive to your architecture – and is really two technologies for the price of one: a graph database and a relationship analytics engine. Its primary contribution to your business is its unique analytical insight – derived from a combination of its ability to connect your data together and at the same time perform sophisticated analytical queries on that connected data. And you choose whether that insight is visualized or automatically actioned.

TigerGraph runs on top of your strategic cloud provider, compressing the data it stores – meaning lower storage and compute costs than alternative cloud-based approaches. It does not replace your cloud architecture.

It then outputs insight into your strategic AI/ML or data visualization tools – and it can make that insight available to you in whichever format is most appropriate – whether through the native visualization UI or in a machine-readable output such as CSV or JSON. Again, TigerGraph is additive to your data architecture – and is intended to enhance and not replace your AI or visualization stack.

Getting Started with TigerGraph

You can download our free product if you’d like to get your hands on it straight away. Or you can reach out directly to our sales team if you’d like to see a demo, and talk about how we could run a proof of concept with you using some of your data.

You Might Also Like

Graph + AI Summit - Getting the Most from Your Virtual Summit Experience

Graph + AI Summit - Getting...

May 18, 2022
3 Real-time Banking Scenarios for Operational Excellence with TigerGraph

3 Real-time Banking Scenarios for Operational...

May 17, 2022
Speeding the Process for Pharmaceutical Drug Approvals

Speeding the Process for Pharmaceutical Drug...

May 12, 2022

Introducing TigerGraph 3.0

July 1, 2020

Everything to Know to Pass your TigerGraph Certification Test

June 24, 2020

Neo4j 4.0 Fabric – A Look Behind the Curtain

February 7, 2020

TigerGraph Blog

  • Categories
    • Analyst Research
    • blog
    • blogs
      • About TigerGraph
      • Benchmark
      • Business
      • Community
      • Customer
      • Customer 360
      • Cybersecurity
      • Developers
      • eCommerce
      • Entity Resolution
      • Executive Brief
      • Finance
      • Fraud / Anti-Money Laundering
      • GQL
      • Graph Database Market
      • Graph Databases
      • Graph Gurus
      • GSQL
      • Healthcare
      • Machine Learning
      • Machine Learning / AI
      • Meetup
      • Mini Guide
      • Podcast
      • Press
      • Press Releases
      • Product
      • Supply Chain
      • TigerGraph
      • TigerGraph Cloud
      • TigerGraph Press Release
    • Cloud
    • Data Science
    • EMEA EVENTS
    • Emerging Use Cases
    • Fraud / Anti-Money Laundering
    • Healthcare
    • Machine Learning / AI
    • On-Demand Event
    • Partners
    • Recommendation Engine
    • Success Stories
    • Uncategorized
    • US EVENTS
  • Recent Posts

    • Le Big Boss /Supply Chain Dinner – Paris
    • EBA Day Vienna
    • Graph + AI Summit – Getting the Most from Your Virtual Summit Experience
    • HPE Discover
    • CDAO Exchange
    TigerGraph

    Product

    SOLUTIONS

    customers

    RESOURCES

    start for free

    PRODUCT
    • Overview
    • What's New
    • Toolkits
    • Connectors
    • Data Science Library
    TIGERGRAPH DB
    • Overview
    • No-Code Graph Analytics
    • Features
    • GSQL Query Language
    TIGERGRAPH CLOUD
    • Overview
    • Cloud Starter Kits
    • Login
    • FAQ
    • Pricing
    • Cloud Marketplaces
    GRAPHSTUDIO
    • Overview
    • Take a Test Drive
    TRY NOW
    • Get Started for Free
    • Compare Editions
    • License FAQ
    SOLUTIONS
    • Why Graph?
    industry
    • Advertising, Media & Entertainment
    • Financial Services
    • Healthcare & Life Sciences
    use cases
    • Benefits
    • Product & Service Marketing
    • Entity Resolution
    • Customer 360/MDM
    • Recommendation Engine
    • Anti-Money Laundering
    • Cybersecurity Threat Detection
    • Fraud Detection
    • Risk Assessment & Monitoring
    • Energy Management
    • Network & IT Management
    • Supply Chain Analysis
    • AI & Machine Learning
    • Geospatial Analysis
    • Time Series Analysis
    success stories
    • Customer Success Stories

    Partners

    Partner program
    • Partner Benefits
    • TigerGraph Partners
    • Sign Up
    LIBRARY
    • Resources
    • Benchmark
    • Webinars
    Events
    • Trade Shows
    • Graph + AI Summit
    • Million Dollar Challenge
    EDUCATION
    • TigerGraph Academy
    • Certification
    Blog
    • TigerGraph Blog
    DEVELOPERS
    • Developers Hub
    • Community Forum
    • Documentation
    • Ecosystem

    COMPANY

    Company
    • Overview
    • Careers
    • News
    • Press Release
    • Awards
    • Legal
    Get Started
    • Get TigerGraph
    • Compare Editions
    • Online Demo - Test Drive
    • Request a Demo

    Product

    • Overview
    • TigerGraph 3.0
    • TIGERGRAPH DB
    • TIGERGRAPH CLOUD
    • GRAPHSTUDIO
    • TRY NOW

    customers

    • success stories

    RESOURCES

    • LIBRARY
    • Events
    • EDUCATION
    • BLOG
    • DEVELOPERS

    SOLUTIONS

    • SOLUTIONS
    • use cases
    • industry

    Partners

    • partner program

    company

    • Overview
    • news
    • Press Release
    • Awards

    start for free

    • Request Demo
    • take a test drive
    • SUPPORT
    • COMMUNITY
    • CONTACT
    • Copyright © 2022 TigerGraph
    • Privacy Policy
    • Linkedin
    • Facebook
    • Twitter

    Copyright © 2020 TigerGraph | Privacy Policy

    Copyright © 2020 TigerGraph Privacy Policy

    • SUPPORT
    • COMMUNITY
    • COMPANY
    • CONTACT
    • Linkedin
    • Facebook
    • Twitter

    Copyright © 2020 TigerGraph

    Privacy Policy

    • Products
    • Solutions
    • Customers
    • Partners
    • Resources
    • Company
    • START FOR FREE
    START FOR FREE
    START FOR FREE
    TigerGraph
    PRODUCT
    PRODUCT
    • Overview
    • GraphStudio UI
    • Graph Data Science Library
    TIGERGRAPH DB
    • Overview
    • Features
    • GSQL Query Language
    TIGERGRAPH CLOUD
    • Overview
    • Cloud Starter Kits
    TRY TIGERGRAPH
    • Get Started for Free
    • Compare Editions
    SOLUTIONS
    SOLUTIONS
    • Why Graph?
    use cases
    • Benefits
    • Product & Service Marketing
    • Entity Resolution
    • Customer Journey/360
    • Recommendation Engine
    • Anti-Money Laundering (AML)
    • Cybersecurity Threat Detection
    • Fraud Detection
    • Risk Assessment & Monitoring
    • Energy Management
    • Network Resources Optimization
    • Supply Chain Analysis
    • AI & Machine Learning
    • Geospatial Analysis
    • Time Series Analysis
    industry
    • Advertising, Media & Entertainment
    • Financial Services
    • Healthcare & Life Sciences
    CUSTOMERS
    read all success stories


    PARTNERS
    Partner program
    • Partner Benefits
    • TigerGraph Partners
    • Sign Up
    RESOURCES
    LIBRARY
    • Resource Library
    • Benchmark
    • Webinars
    Events
    • Trade Shows
    • Graph + AI Summit
    • Graph for All - Million Dollar Challenge
    EDUCATION
    • TigerGraph Academy
    • Certification
    Blog
    • TigerGraph Blog
    DEVELOPERS
    • Developers Hub
    • Community Forum
    • Documentation
    • Ecosystem
    COMPANY
    COMPANY
    • Overview
    • Leadership
    • Careers  
    NEWS
    PRESS RELEASE
    AWARDS
    START FOR FREE
    Start For Free
    • Try TigerGraph Now
    • Request a Demo
    • SUPPORT
    • COMMUNITY
    • CONTACT
    Dr. Jay Yu

    Dr. Jay Yu | VP of Product and Innovation

    Dr. Jay Yu is the VP of Product and Innovation at TigerGraph, responsible for driving product strategy and roadmap, as well as fostering innovation in graph database engine and graph solutions. He is a proven hands-on full-stack innovator, strategic thinker, leader, and evangelist for new technology and product, with 25+ years of industry experience ranging from highly scalable distributed database engine company (Teradata), B2B e-commerce services startup, to consumer-facing financial applications company (Intuit). He received his PhD from the University of Wisconsin - Madison, where he specialized in large scale parallel database systems

    Todd Blaschka | COO

    Todd Blaschka is a veteran in the enterprise software industry. He is passionate about creating entirely new segments in data, analytics and AI, with the distinction of establishing graph analytics as a Gartner Top 10 Data & Analytics trend two years in a row. By fervently focusing on critical industry and customer challenges, the companies under Todd's leadership have delivered significant quantifiable results to the largest brands in the world through channel and solution sales approach. Prior to TigerGraph, Todd led go to market and customer experience functions at Clustrix (acquired by MariaDB), Dataguise and IBM.