
Summary
- Modern cyberattacks move laterally across connected systems over hours or days; the initial entry point is rarely where the greatest damage occurs.
- Most security tools, including SIEMs and rule-based platforms, analyze events in isolation and cannot easily connect how those events relate across users, devices, systems, and time.
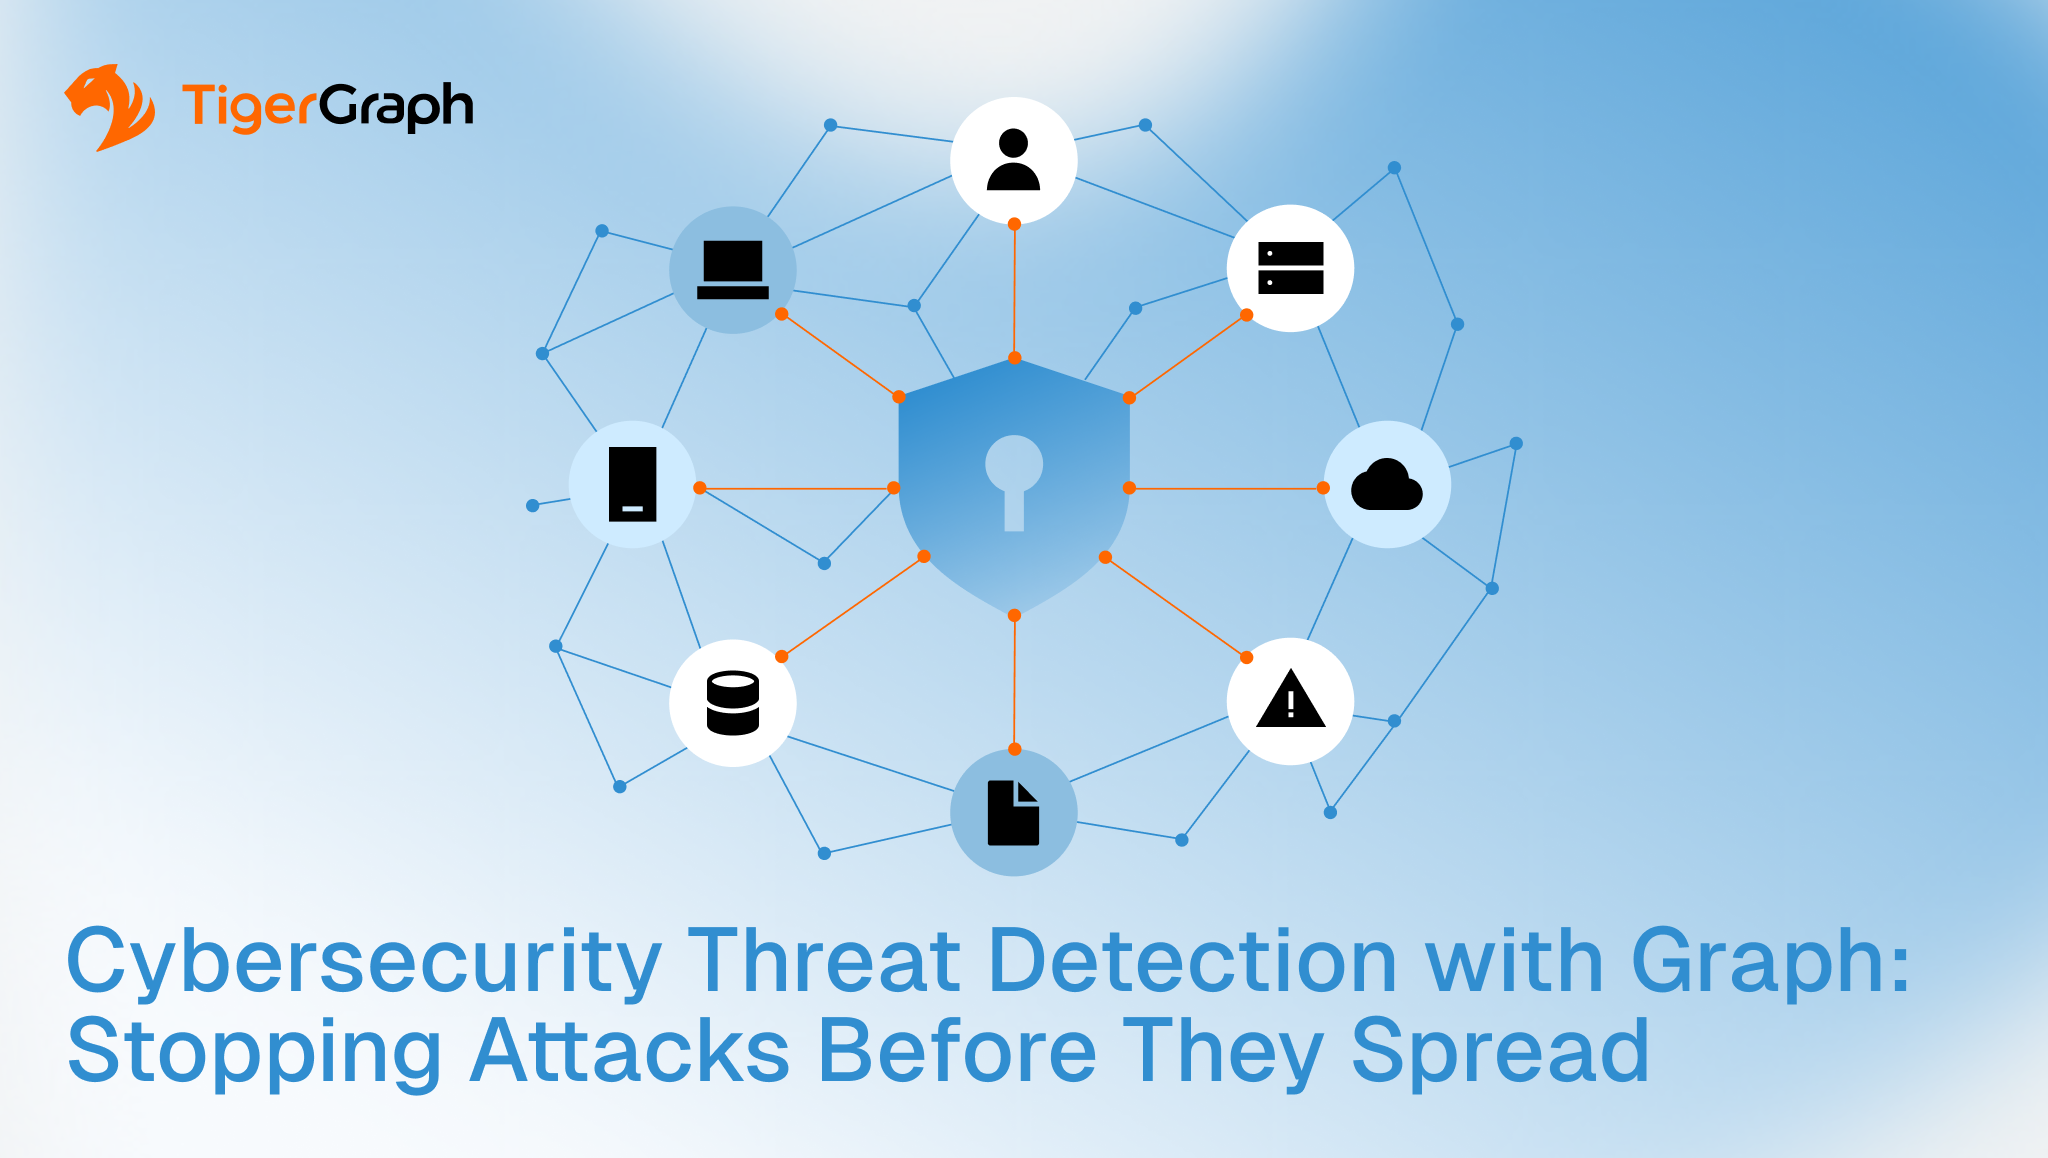
- A cybersecurity graph maps users, devices, IP addresses, applications, files, and processes as a connected network, so attack chains can be surfaced in real time rather than reconstructed afterward.
- Graph analytics enables detection capabilities that are difficult to achieve with traditional architectures: pattern detection, anomaly detection, and lateral movement tracing across systems in milliseconds.
- TigerGraph operationalizes this at enterprise scale with multi-source data integration, deep link analytics, real-time anomaly detection, and AI-ready relationship features for cybersecurity threat detection AI models.
Modern cyberattacks are not single-point events. They move laterally, escalate privileges, and exfiltrate data across connected systems over hours or even days. The initial entry point is rarely where the greatest damage occurs, making cybersecurity threat detection an increasingly complex challenge that demands both greater visibility and faster response.The attack is rarely defined by one event. It is defined by the sequence of connected events that follow.
This happens because most security tools, including SIEMs and rule-based platforms, analyze events in isolation. They generate alerts from individual log entries but cannot easily identify how those events connect across users, devices, systems, and time. As a result, these systems often detect symptoms rather than the attack chains that produce them. The limitation is not the volume of telemetry collected. It is the inability to understand the relationships within that telemetry.
You will learn:
- Why cyberattacks are fundamentally a connected-data problem
- Where traditional detection approaches fall short
- How graph analytics changes what security teams can see
- Which threat scenarios benefit most from graph analytics, and how TigerGraph operationalizes this at enterprise scale
What Is a Cybersecurity Graph?
A cybersecurity graph is a data model that represents users, devices, IP addresses, applications, files, and processes as connected entities, with the relationships between them (authentication events, communications, data transfers, access chains) stored as first-class data. Instead of reconstructing attack paths after the fact by joining separate log tables, a cybersecurity graph allows security teams to query relationships directly and see multi-stage attacks as they unfold. It transforms security data from isolated events into a connected model of how an attack actually progresses through an environment.
Why Cyberattacks Are a Connected Data Problem
An enterprise network is not a collection of isolated machines but a densely connected ecosystem of users, endpoints, credentials, applications, cloud services, and data stores. Attackers understand this and exploit the relationships between these assets, not just individual entry points. Every stage of an attack depends on moving through trusted relationships that already exist inside the environment.
Attackers often begin by compromising a single credential before moving laterally to adjacent systems using that account’s access rights. They may then escalate privileges by exploiting trusted account relationships before extracting sensitive data through additional connected systems. Every stage depends on relationships between users, systems, identities, and data, the same relationships that flat log analysis struggles to capture.
Some of the most damaging attack categories rely on relationship patterns, including:
- Lateral movement. An attacker moves from system to system by exploiting legitimate trust relationships, credentials, or administrative access paths.
- Insider threat. A credentialed user behaves outside their normal relationship and access patterns, creating subtle anomalies that isolated event analysis often misses.
- Coordinated external attack. Multiple attackers or bots operate together across separate entry points while sharing common infrastructure, objectives, or downstream targets.
If attackers move through relationships, cybersecurity threat detection must also reason across those relationships. That is precisely what a cybersecurity graph is designed to do. The architecture used for detection should reflect the architecture of the attack itself.
Where Traditional Security Tools Fall Short
SIEMs, endpoint detection systems, and firewall logs all generate essential data for network security analytics. The challenge is rarely the volume of data collected; it is the analytical model used to process it. Organizations generally have enough security data. What they often lack is the ability to connect that data into meaningful attack context.
When security data is distributed across separate tables (e.g., one for log sources, another for device records, another for user identities), correlating events requires expensive joins that can take minutes or even hours. By the time those correlations are complete, an attacker may already have progressed through multiple stages of the attack.
Traditional cybersecurity threat detection tools typically trigger rule-based alerts from individual events such as failed logins, unusual outbound connections, or large file transfers. While valuable, these alerts rarely reveal how multiple events combine into a coordinated attack. The result is a high volume of false positives alongside missed detections of slow-moving, low-signal attacks.
If your SIEM is generating high alert volume but still missing slow-moving lateral movement, this is the gap graph analytics is built to close. This challenge becomes even greater in enterprise environments, which generate terabytes of log and network telemetry every day from dozens of disparate sources. Relational architectures that depend on complex joins struggle to maintain sub-second query performance at this scale, forcing organizations to balance analytical depth against detection speed.
Security teams do not need more alerts. They need greater context. A cybersecurity knowledge graph provides that context by revealing how events, users, devices, and systems relate to one another as attacks unfold. Context is what transforms alerts into actionable intelligence.
Traditional Tools vs. Graph-Powered Detection
Here is a quick comparison between traditional tool-based versus graph-powered cybersecurity threat detection.
| Dimension | Traditional Security Tools | Graph-Powered Detection |
| Detection basis | Individual events and rule-based alerts | Connected relationships across users, devices, and systems |
| Multi-stage attack visibility | Limited; requires manual correlation after the fact | Attack paths visible as they develop |
| Query performance at scale | Degrades as joins grow across separate tables | Sub-second performance across billions of connected records |
| False positive rate | Higher; isolated events lack context | Lower; alerts include full relationship context |
| Investigation speed | Minutes to hours of manual correlation | Milliseconds to trace a full attack chain |
| Best-fit scenarios | Simple, single-event anomalies | Lateral movement, insider threats, coordinated attacks, ransomware, supply chain risk |
The widest gap is investigation speed under multi-stage attacks. When an alert fires, the question that matters most is not just what happened, but what else is connected to it, and graph-powered detection answers that question in the same query rather than a separate investigation. That shift changes graph from an investigation tool into a real-time operational capability.
How Graph Changes Threat Detection
Instead of storing events in separate tables that must be joined at query time, a cybersecurity graph stores users, devices, IP addresses, applications, files, and processes as connected entities.
The relationships between them, including authentication events, communications, data transfers, and access chains, become first-class data that can be queried directly in a graph. This enables security teams to analyze attack paths as they develop rather than reconstructing them after an incident. Detection becomes relationship-aware instead of event-aware.
A cybersecurity knowledge graph enables several detection capabilities that are difficult to achieve with traditional security architectures, including:
- Pattern detection. Pattern detection models the behavioral sequences associated with known attack techniques and continuously compares them against live network activity. For example, a user authenticating to an unfamiliar device, accessing a sensitive file share, and then initiating an outbound connection to an unknown IP can be recognized as a coordinated attack pattern before data exfiltration is complete.
- Anomaly detection. Graph builds a model of normal relationship behavior for every entity. When a service account suddenly begins accessing systems it has never interacted with before, or a user authenticates from geographically distant locations within an implausibly short period, graph immediately surfaces those deviations without relying on manually written detection rules.
- Lateral movement tracing. When an alert is triggered, graph traces the complete chain of activity connected to that event across multiple systems in milliseconds. Rather than investigating a single compromised endpoint, analysts can immediately see how an attacker entered the environment, which assets were accessed, and where the attack is likely to progress next.
These capabilities also strengthen AI in cybersecurity threat detection by providing relationship-based features that conventional security analytics cannot generate. Graph analytics produces signals such as the number of high-risk connections within a user’s access network, the proximity of an endpoint to known malicious infrastructure, or the similarity between current behavior and historical attack patterns.
These features significantly improve the accuracy of cybersecurity threat detection AI models by capturing the broader context surrounding each security event rather than evaluating events independently. AI models become more effective because they learn from connected behavior instead of isolated observations.
Threat Scenarios Where Graph Makes the Difference
The following scenarios illustrate where a cybersecurity graph provides clear advantages over traditional cybersecurity threat detection tools:
- Insider threats. A graph model of normal user behavior, including the systems users access, the devices they use, the times they typically log in, and the sequence of their activities, makes behavioral drift immediately visible. An employee who suddenly begins accessing sensitive information outside established patterns or communicating with unfamiliar external endpoints generates a relationship-level alert rather than an isolated event notification.
- Coordinated external attacks. Attackers operating across multiple compromised accounts or bot networks leave relationship patterns through shared infrastructure, synchronized timing, and common downstream targets. Graph analytics connects seemingly unrelated activities into a single, coordinated campaign, even when each action appears benign in isolation.
- Ransomware propagation. Ransomware spreads by exploiting trusted relationships between connected systems. Graph detects rapid patterns of privilege escalation and lateral movement across endpoints before encryption reaches critical assets, enabling security teams to contain attacks while propagation is still underway.
- Supply chain and third-party risk. Graph maps how third-party vendor accounts, APIs, and services connect to internal systems. When a vendor credential is compromised, graph immediately identifies every internal asset that the credential can access, allowing organizations to isolate potential exposure before attackers expand further into the environment.
Graph-Powered Cybersecurity with TigerGraph
Enterprise environments generate terabytes of security telemetry every day from dozens of sources while requiring sub-second query performance for real-time detection. Traditional architectures often struggle to maintain this performance as data volumes and relationship complexity grow. TigerGraph’s purpose-built cybersecurity graph is designed to address these challenges by providing:
- Multi-source data integration. TigerGraph connects log data, network telemetry, identity records, and endpoint activity into a unified graph model. Relationships between events across previously disconnected sources become queryable in real time without requiring complex join logic for every investigation.
- Deep link analytics at scale. TigerGraph performs complex multi-step queries that trace attacker activity across connected systems, supporting investigations from the initial compromise through lateral movement to data exfiltration. Even across billions of connected records, queries execute in milliseconds, making real-time analysis of multi-stage attacks operationally practical rather than theoretical. This allows security teams to investigate complete attack paths while the attack is still active rather than after forensic reconstruction begins.
- Real-time anomaly and pattern detection. TigerGraph supports streaming ingestion of live security events and continuously evaluates them against established behavioral patterns. When a new activity matches a known threat sequence or deviates significantly from normal behavior, alerts include the full relationship context rather than only the triggering event.
- AI-ready architecture. TigerGraph’s graph data science library generates relationship-based features that strengthen machine learning models used for AI cybersecurity threat detection. These include connection-based risk scores, community membership, path similarity, and relationship centrality, providing the contextual information that enhances ML models and AI threat detection capabilities in cybersecurity beyond traditional event-based models. As AI becomes more central to security operations, relationship-aware features increasingly become one of the strongest differentiators between graph-based and traditional detection approaches.
- Enterprise deployment. TigerGraph can be deployed on AWS, Azure, GCP, or on-premises. SOC 2 Type 2, HIPAA, and ISO 27001 certifications, role-based access control, and SAML 2.0 SSO support the governance, security, and operational requirements of large enterprise environments.
Why Connected Detection Wins
Cybersecurity is fundamentally a connected-data problem. Modern attacks succeed because they exploit relationships between users, devices, identities, applications, and systems that isolated event analysis cannot fully capture. Effective cybersecurity threat detection must reason across those same relationships in real time. The better an organization understands those relationships, the earlier it can detect attacks before they propagate across the network.
A cybersecurity graph enables security teams to view multi-stage attacks as connected sequences of activity while they are unfolding, rather than reconstructing them from isolated alerts after damage has already occurred. This relationship-first perspective shortens investigations, improves detection accuracy, and provides the context analysts need to prioritize genuine threats. Instead of asking analysts to connect the dots manually, graph makes the connections part of the detection process itself.
As enterprise environments continue to expand through cloud adoption, hybrid work, SaaS applications, and third-party integrations, the number of relationships that security teams must understand will continue to grow. Traditional event-based detection alone becomes increasingly difficult to scale, making relationship-aware network security analytics an essential capability for modern security operations.
TigerGraph’s purpose-built cybersecurity graph gives security teams the relationship context to detect, trace, and contain attacks before they spread. Explore pricing and free trial options, request a demo, or read more about how TigerGraph’s cybersecurity threat detection solutions can future-proof your organization’s security strategy. TigerGraph combines real-time graph analytics, AI-ready relationship intelligence, and enterprise-scale performance to help security teams stop attacks before they become breaches.
FAQs
What is a cybersecurity graph?
A cybersecurity graph is a data model that represents users, devices, IP addresses, applications, files, and processes as connected entities, with relationships between them stored as first-class, queryable data. This allows security teams to see how an attack moves across systems in real time, rather than reconstructing the attack path after the fact from separate logs.
How does graph-based threat detection differ from a SIEM?
A SIEM aggregates and analyzes events from individual log sources, typically triggering alerts based on rules applied to single events. Graph-based threat detection instead models relationships between users, devices, and systems directly, so security teams can trace how multiple events connect into a single coordinated attack rather than reviewing isolated alerts.
Can graph analytics detect insider threats?
Yes. Graph analytics builds a model of each user’s normal relationship and access patterns, including the systems they use, their typical login times, and their activity sequences. When a credentialed user’s behavior drifts from that established pattern, such as accessing unfamiliar systems or communicating with unknown external endpoints, graph surfaces the deviation as a relationship-level alert.
How fast can graph analytics trace lateral movement?
Graph-powered systems like TigerGraph can trace the complete chain of activity connected to a triggering event across multiple systems in milliseconds, even across billions of connected records. This lets analysts see how an attacker entered the environment and which assets were accessed without manually correlating logs across separate tables.
What is the difference between a cybersecurity graph and a cybersecurity knowledge graph?
In practice, the terms are used interchangeably to describe the same underlying approach: modeling users, devices, and systems as connected entities so relationships can be queried directly. Some teams use “cybersecurity knowledge graph” when emphasizing the layer of business and threat-intelligence context added on top of the raw connection data.