
Summary
- Data lineage describes how data moves through an organization: where it originates, how it is transformed, and which systems, models, and reports depend on it downstream.
- Traditional lineage approaches (spreadsheets, static diagrams, dependency lists) struggle at enterprise scale because they cannot efficiently represent or navigate chains of indirect dependencies across thousands of connected assets.
- Data lineage is a graph problem: dependencies form a network, not a list, and understanding cascading impact requires following chains of relationships across multiple systems and transformation layers.
- A graph database models data assets as connected entities with explicit relationship types (depends on, feeds, transforms, produces), enabling real-time impact analysis, root cause investigation, and cross-system dependency tracing.
- TigerGraph’s native massively parallel architecture is designed for analyzing highly connected data at enterprise scale, with integrations across cloud storage, warehouses, and streaming platforms including Snowflake, Databricks, BigQuery, Kafka, and Apache Iceberg.
As data environments grow, understanding where data comes from, how it changes, and where it goes becomes increasingly difficult. A modern organization may have thousands of tables, dashboards, pipelines, models, reports, APIs, and applications connected across multiple platforms, and a change to a single dataset can affect dozens or even hundreds of downstream assets.
This is where data lineage becomes essential, providing visibility into how data moves across an organization, helping teams understand dependencies, identify risks, troubleshoot issues, and maintain trust in analytics.
The challenge is that traditional approaches to data lineage struggle at scale. Simple lists, static documentation, and point-to-point dependency maps can describe individual relationships, but they become difficult to navigate when the number of connections grows. For complex environments, graph-based data lineage tools offer a more natural way to represent and explore these relationships.
You’ll learn:
- What data lineage is and why it matters for enterprise data governance
- Why traditional lineage tools break down as dependency networks grow
- How graph databases model and query connected data dependencies more effectively
- How TigerGraph provides a foundation for enterprise-scale data lineage across modern data infrastructure
What Is Data Lineage?
Data lineage describes how data moves through an organization’s technology environment, tracing where it originated, which systems have processed it, what transformations were applied, and which datasets, dashboards, models, and applications depend on it. It answers the question “If this source changes, what could break?” and supports impact analysis, root cause investigation, regulatory compliance, and data quality governance.
Data lineage answers questions such as:
- Where did this data originate?
- Which systems have processed it?
- What transformations were applied?
- Which datasets depend on it?
- Which dashboards, applications, or models consume it?
- What could be affected if the source changes?
- Where did an unexpected value or error come from?
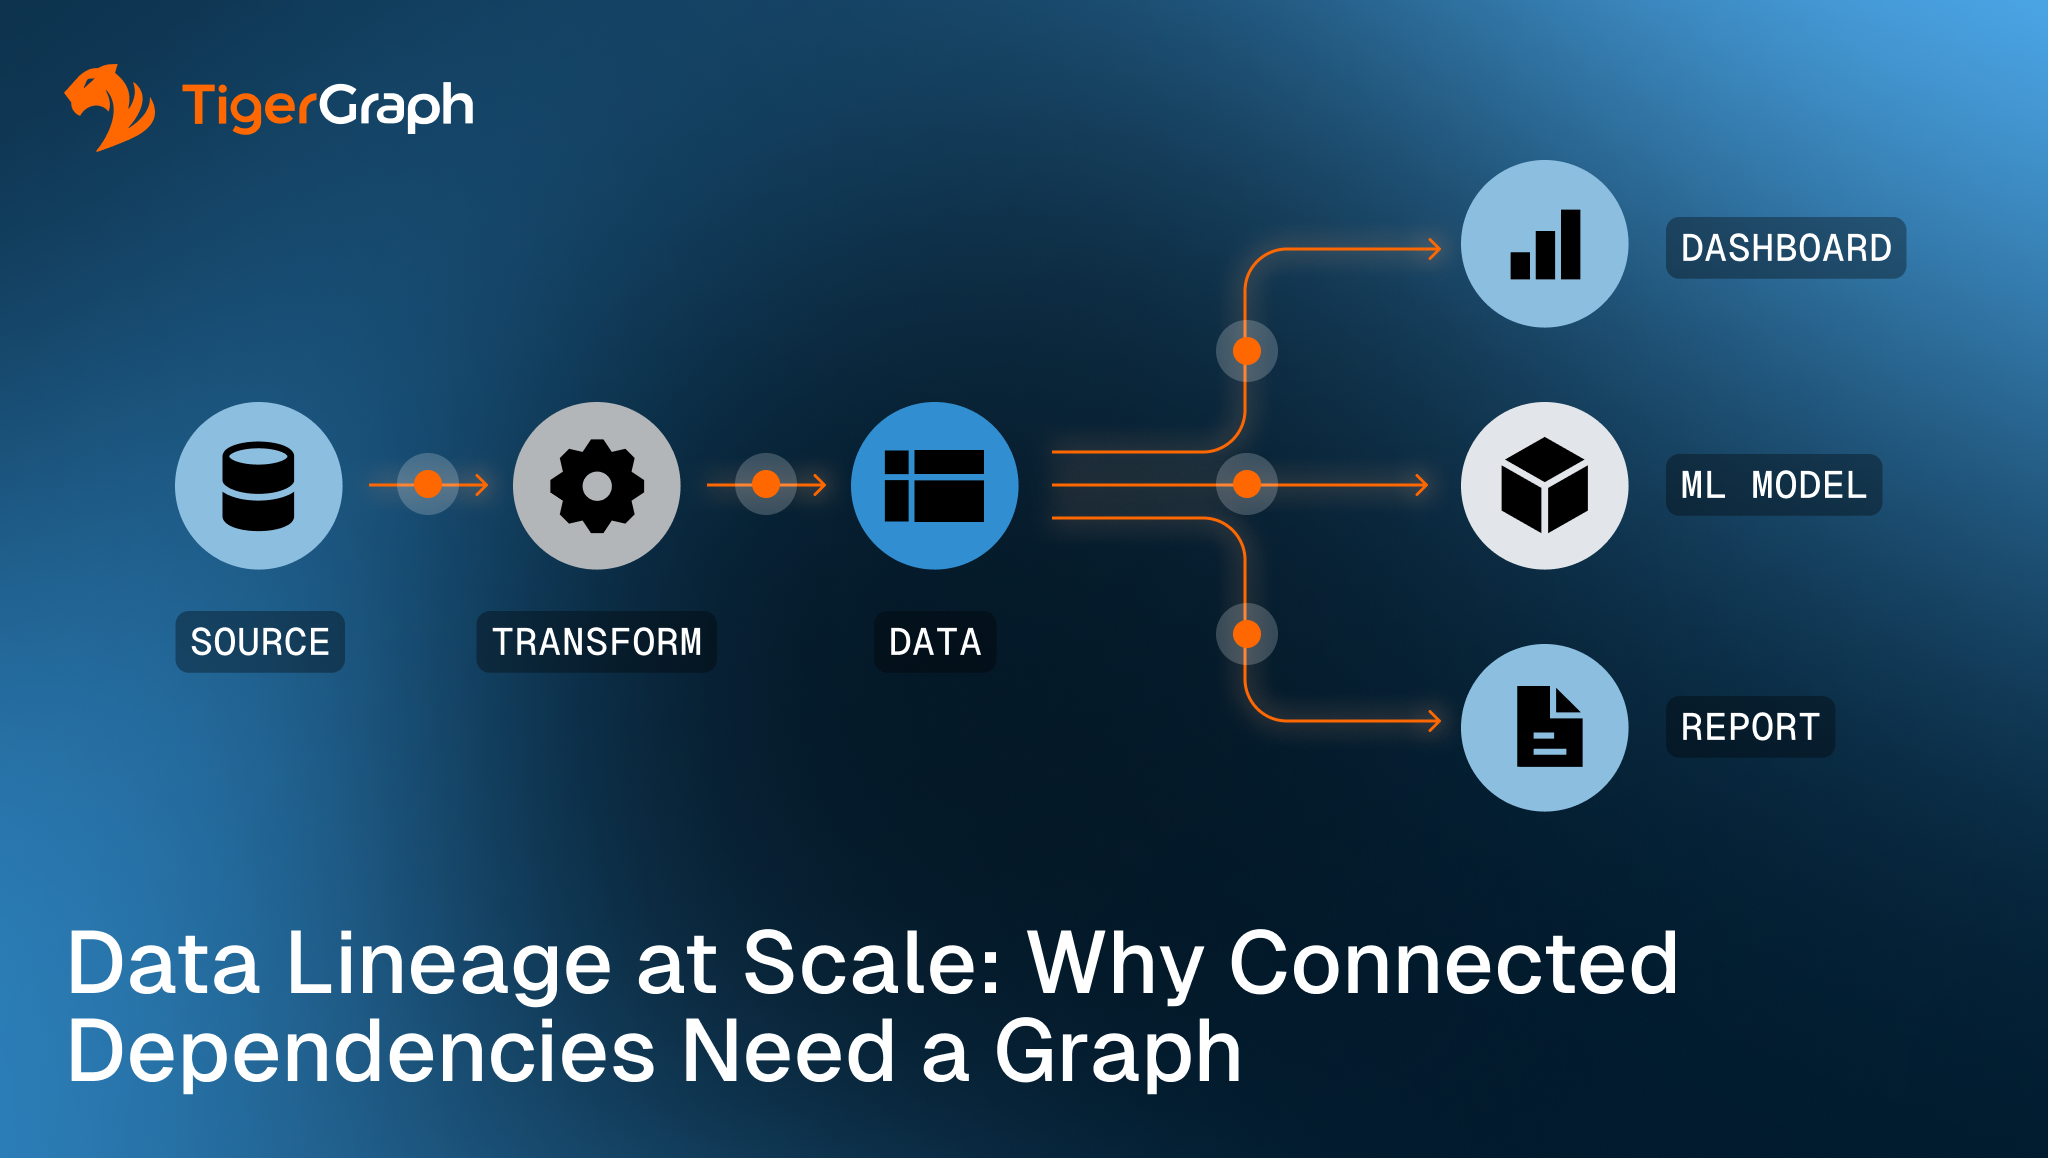
Consider a financial reporting dashboard. It may depend on a semantic model that relies on several transformation tables, which ultimately depend on raw data from multiple operational systems:
Source system → Raw data → Transformation → Analytical model → Dashboard
While this structure works in small environments, it does not hold up at enterprise scale. Sources branch into multiple pipelines that feed multiple models that support different reports and applications. Some datasets may also be reused across machine learning workflows or customer-facing products.
As these relationships multiply, the potential impact of even a small change becomes increasingly difficult to predict. A single data asset can sit at the center of several interconnected workflows, meaning that its downstream impact may extend far beyond the systems that directly consume it. This is why scalable lineage requires more than simply documenting dependencies. It requires a way to understand the network formed by those dependencies.
Why Traditional Approaches Struggle at Scale
Many organizations initially document data lineage using spreadsheets, catalogs, static diagrams, or dependency lists. These approaches can be useful, but they become harder to maintain as the number of relationships increases.
The problem is not necessarily the volume of data, but the number of connections between data assets.
For example, changing one field in a source table could potentially affect:
- Several transformation pipelines
- Dozens of analytical models
- Business intelligence dashboards
- ML features
- Regulatory reports
- Operational applications
- Data products used by other teams
A flat list may suffice for identifying direct dependencies, but it becomes much harder to understand the complete chain of indirect relationships. This is when graph technology becomes a practical solution.
Why Data Lineage Is a Graph Problem
A graph database is designed to represent entities and the relationships between them. In a data lineage graph:
- Entities such as tables, columns, pipelines, reports, applications, and business concepts can be stored as nodes.
- Relationships such as depends on, feeds, transforms, produces, or consumes connect those nodes directly.
Instead of treating each dependency as an isolated record, the graph preserves the entire network, enabling organizations to ask questions that span multiple relationship steps.
A question such as “If this source changes, which business reports could eventually be affected?” requires following several connections in sequence. A graph can follow those dependency paths directly, allowing organizations to analyze the dependency network rather than reconstructing it manually each time.
This multi-step capability is particularly important because the most significant dependencies are not always direct. A source table may feed a transformation, which feeds a model, which feeds a dashboard used for a critical business decision. Looking only at the first connection would provide an incomplete picture. A graph preserves the complete path, enabling investigation of both immediate and indirect dependencies.
Building a Graph Foundation for Connected Data
TigerGraph is built around the idea that important insights often exist in the relationships between data points. Its purpose-built graph database is designed to store and analyze highly connected data, with a native massively parallel architecture optimized for enterprise-level graph processing.
That architecture is particularly relevant to data lineage because enterprise lineage can involve enormous numbers of assets and relationships. Rather than treating data lineage as a static diagram, organizations can model their data environment as a connected graph and then use graph queries and analytics to explore those relationships.
TigerGraph also supports integration with a range of data sources, including cloud storage, warehouses, and processing engines such as S3, Snowflake, Kafka, Spark, BigQuery, PostgreSQL, and Apache Iceberg. This can help organizations integrate data from different parts of their environment into a connected graph architecture, creating a foundation for analyzing dependencies across systems rather than viewing each platform in isolation.
This cross-system perspective is particularly valuable for enterprises where lineage information is distributed across different technologies and teams. Rather than creating another isolated repository of metadata, a graph-based architecture provides a connected layer through which organizations can explore relationships across their existing data environment.
Extending Data Lineage with Graph
The value of a graph foundation goes beyond tracing where data came from and where it goes. By connecting data lineage with the business, operational, and security entities surrounding that data, graph-based lineage can support a broader and deeper range of enterprise questions.
| Industry and use case | Traditional data lineage | How graph extends the analysis |
| Financial services and regulatory reporting | Trace regulated data from source systems through transformations to reports and downstream datasets. | Link regulated data and transformations with reports, owners, policies, controls, and other governance metadata. TigerGraph easily traverses multiple stages to trace how a regulated entry propagates across complex systems and identifies the people and policies associated with that movement. |
| Risk and fraud data | Trace the sources, transformations, and models that contribute data to a risk score, fraud alert, or decision. | Extend data lineage to the customers, accounts, transactions, devices, models, and decisions represented by the data. TigerGraph’s fraud, AML, and KYC solutions perform multi-hop analysis at scale to reveal how data, money, and influence travel through a complex network. |
| Cybersecurity threat and access lineage | Trace the sources and transformations that feed security data, alerts, models, and analytical systems. | Supplement the data lineage with identities, devices, credentials, permissions, events, and assets, to spot unusual activity and attack patterns in context. TigerGraph for cybersecurity can trace not only where security information originated, but also the relationships and access paths that give the information operational context. |
| Production and supply chain data | Trace operational data from source systems and pipelines into analytics, reports, forecasts, and models. | Connect data lineage with the suppliers, plants, parts, machines, shipments, and other operational entities represented by the data. TigerGraph highlights supply chain and digital twin use cases involving root causes, downstream effects, and highly connected operational dependencies. |
The key advantage of a graph is that relationships are treated as first-class data. Instead of repeatedly joining tables to reconstruct a dependency path, the relationships themselves become part of the data model, making multi-step analysis more natural and efficient.
Connected Data Matters for the Future of Data Lineage
Data environments will continue to become more interconnected. Analytics, applications, machine learning, AI, and operational systems increasingly rely on shared data.
Organizations, therefore, need to understand not only individual assets, but the relationships between them.
TigerGraph brings a graph-first approach to enterprise-scale connected data, combining graph storage, parallel computation, real-time analytics, and integrations with modern data infrastructure. By representing data assets as connected entities, organizations can investigate upstream and downstream dependencies, perform impact analysis, trace potential root causes, and connect technical lineage with business and governance context.
Ready to build enterprise-scale lineage? Start with TigerGraph’s free tier or request a demo.
FAQs
What is data lineage and why does it matter?
Data lineage tracks how data moves through an organization: where it originates, how it is transformed across systems and pipelines, and which dashboards, models, reports, and applications ultimately depend on it. It matters because a change to any upstream asset can cascade through many downstream systems, and teams need to understand that impact before making changes, after errors occur, and for regulatory compliance and audit purposes.
Why do traditional data lineage tools struggle at enterprise scale?
Traditional tools store dependencies as lists, static diagrams, or catalog entries. These approaches work well for small environments with a manageable number of direct relationships, but they break down when a single dataset feeds dozens of pipelines that each feed multiple models and reports. Reconstructing the full chain of indirect impact requires manually following each connection, which becomes impractical as the number of assets and relationships grows into the thousands.
How does a graph database improve data lineage tracking?
A graph database stores data assets (tables, pipelines, models, dashboards, reports) as nodes and the dependency relationships between them (feeds, transforms, produces, consumes) as explicit connections. Because those connections are stored as first-class data rather than reconstructed through table joins, a single graph query can follow the entire dependency chain across any number of relationship steps in real time, answering questions like “What would break if this source field changed?” without manual investigation.
What are the most important data lineage use cases for graph technology?
The highest-value use cases are those where indirect dependencies matter most: regulatory reporting (tracing how a regulated field propagates through multiple transformation layers), fraud and AML investigation (connecting data sources, models, and risk signals to understand how information flows through detection systems), cybersecurity (tracing access paths across identities, permissions, devices, and applications), and supply chain operations (modeling how changes to upstream data propagate through production analytics and operational systems).
How does TigerGraph support data lineage at enterprise scale?
TigerGraph provides a native massively parallel graph database designed to store and analyze highly connected data at enterprise scale. It supports integration with modern data infrastructure including Snowflake, S3, BigQuery, Kafka, Spark, PostgreSQL, and Apache Iceberg, allowing organizations to model their data environment as a connected graph rather than a siloed catalog. Its parallel architecture enables real-time impact analysis and multi-step dependency tracing across large, complex dependency networks.