Summary
- Relational databases store data in tables linked by keys and excel at transactional, statistical, and aggregation workloads.
- Graph databases store entities and relationships natively, making multi-hop relationship queries far faster than SQL JOINs, and that performance advantage grows as data scales.
- The core decision factor is your data’s relationship complexity: if analyses require traversing many connections, graph wins; if data is regularly structured and the workload is transactional, relational wins.
- The seven warning signs that it’s time to consider graph are frequent multi-table JOINs, diminishing query performance, relationship logic handled in app code, use cases like fraud detection failing due to missing complex relationships, flat recommendation quality, painful schema changes, and a roadmap centered on networks or paths.
- Most organizations don’t replace their relational database. They run both in a polyglot architecture, letting each handle the workloads it does best.
Relational databases have long been the heart and soul of data management and analytics. Now, as more analyses demand understanding the complex relationships between data points, some teams are hitting performance or flexibility walls with traditional row and column-based databases. New machine learning and AI workloads also demand a different way to think about data. Graph databases are coming into their own as more and more organizations see the power in them. You shouldn’t have to be a database expert to understand when one is more useful than the other. In this article, you’ll learn the essential differences between graph and relational databases and learn to recognize the seven warning signs that it’s time to switch to graph.
What Is a Relational Database?
A relational database is a way to store and retrieve data that organizes data in tables made up of rows and columns. A table contains multiple rows of a particular type of entity, such as an actor, customer, part, account, or transaction. Each row has information relating to a single entity, with a unique row identifier, a key. Columns are generally a particular type of data, such as date of birth, or email address. For repeating data, such as if a single actor made several movies, that data goes into a new table for that entity type, such as movies.
Relational Databases Explained
Let’s start with a basic definition of that stalwart of data management since the 1980’s, the relational database, aka the relational database management system (RDBMS). This is not going to be news to most of you reading this, but it’s useful to level-set on one database type so you can clearly see the contrasts with another.
A relational database is a way to store and retrieve data that organizes data in tables, with a separate table for each type of entity, such as an actor, customer, part, account, or transaction. Each row of a table has information relating to a single entity, with a unique row identifier, a key. Each column is a particular type of fact about an entity, such as date of birth, or email address. To record relationships between entities, such as actor Tony Curtis appearing in multiple movies, the unique identifier (key) of one entity appears in a dedicated column of the other entity [see Figure 1].

Querying, or asking a question of the data in a relational database, is done using Structured Query Language (SQL). SQL can also be used for simple data analyses such as totaling the sales data per region, comparisons and trends over past time like price fluctuations and differences between last year and now, and statistical evaluations like sum or average value such as average balance in an account.
Often, to answer a query about the data in a relational database, it is necessary to look at data from multiple tables and link them together by their keys, aka, join the tables. An example using the simple data above would be “How many major movies was James Dean in?” Indexes in an RDBMS store information about where to find keys and other data, and are useful for speeding up queries, but have to be re-created periodically as datasets grow or change.
Many-to-many relationships, such as “Marilyn Monroe and Tony Curtis were both in Some Like it Hot and Monkey Business” are difficult to represent. To avoid duplicating data, another table that shows this relationship has to be created, adding to the data model’s complexity and maintenance overhead. If there are many entities, each with a relationship to the others – minor actors, directors, producers, locations, etc. – then asking a question like “Who acted in the movies that were made in this location?” requires joining several tables to answer.

Some common examples of relational databases include PostgreSQL, MySQL, and Microsoft SQL Server.
Relational Database Strengths
Relational databases have been the most common way to store and query data since the 1980’s for very good reasons. One of these is strong ACID compliance (Atomicity, Consistency, Isolation, and Durability), which makes it ideal for certain types of data and workloads, such as transactional. Relational databases include several advantages such as:
- Efficient data storage due to very little data duplication
- Transactions and similar data changes behave predictably
- Data is accurate and consistent between queries
Relational databases have been relatively unchanged for decades, and that has created other advantages in the data management industry like:
- Relational data modeling depth of expertise
- Software and hardware ecosystem maturity
- Widespread SQL proficiency
Relational Database Weaknesses
While the relational model is ideal for some workloads, it does have its flaws. Weaknesses include:
- Multi-join, multi-hop relationship queries: SQL JOIN operations require a fair amount of computational resources. Multi-hop analyses requiring multiple table joins can bog down performance greatly. Use cases such as anti-money laundering or fraud detection require many hops.
- Schema evolution and data scaling: The structure of data often changes over time, and also often grows in volume. Relational databases are fairly set in structure once created. Changing the rows and columns, adding a column, removing a relationship, etc. requires a fair amount of re-work, re-indexing, re-doing the data model. As the data scales up, this maintenance work vastly increases.
- Unstructured data: The row and column format may not work well for some data, such as log files, json files, social media firehoses, or emails. In some cases, data coming from outside your organization may contain inconsistencies of structure – a column appears in this record, but not in that one for instance – that may cause failures and difficulties with RDMSs.
- Unique queries: The data is structured once, to answer specific questions, possibly to provide data for a particular chart on a dashboard. However, if someone asks an unanticipated question, the relational database may not have the information or be well-structured to answer it.
What Is a Graph Database?
A graph database is a way to store and retrieve data that stores entities (nodes) with their properties and relationships (edges) in an interconnected network so you can analyze relationships between entities easily. Storing data with emphasis on the relationships between data points mirrors many real-world situations such as computers on a network, people in social media, objects in a supply chain, or corporate connections in a money laundering process.
Because these relationships are stored directly in the primary data model, queries that analyze those relationships tend to perform far better on a graph database. Multi-hop relationship queries in graph query languages tend to perform especially well compared to relational databases, regardless of the total volume of the stored data.
A good example would be “Which movies did Tony Curtis and Marilyn Monroe both act in?” or “Were Tony Curtis and James Dean in any movies together?”

Instead of SQL, graph databases use graph query languages such as Cypher or OpenCypher, Gremlin, GQL, or GSQL. GSQL has the advantage of being the most similar to SQL, which allows people with SQL proficiency to easily master GSQL. GQL is becoming an industry standard. As you would expect, all of these languages are better designed for relationship and pattern analyses, rather than aggregation and statistical analyses.
Using a graph database, questions like “How many major movies did James Dean act in?” are still simple to answer, but in this case, no join is required since the relationships are part of the data structure. This means that queries are likely to perform more quickly. For a query that simple, you would probably not see much performance improvement. However, for queries requiring more relationship hops or transversals in graph terms, or more table joins in relational terms, the graph database performance increase will become more and more noticeable. Some good example use cases where graph databases outperform relational databases include fraud detection, recommendations, cybersecurity threat detection, and supply chain optimization. You’ll learn about those in greater detail later in the article.
Some examples of graph databases include TigerGraph, Neo4j, and Amazon Neptune.
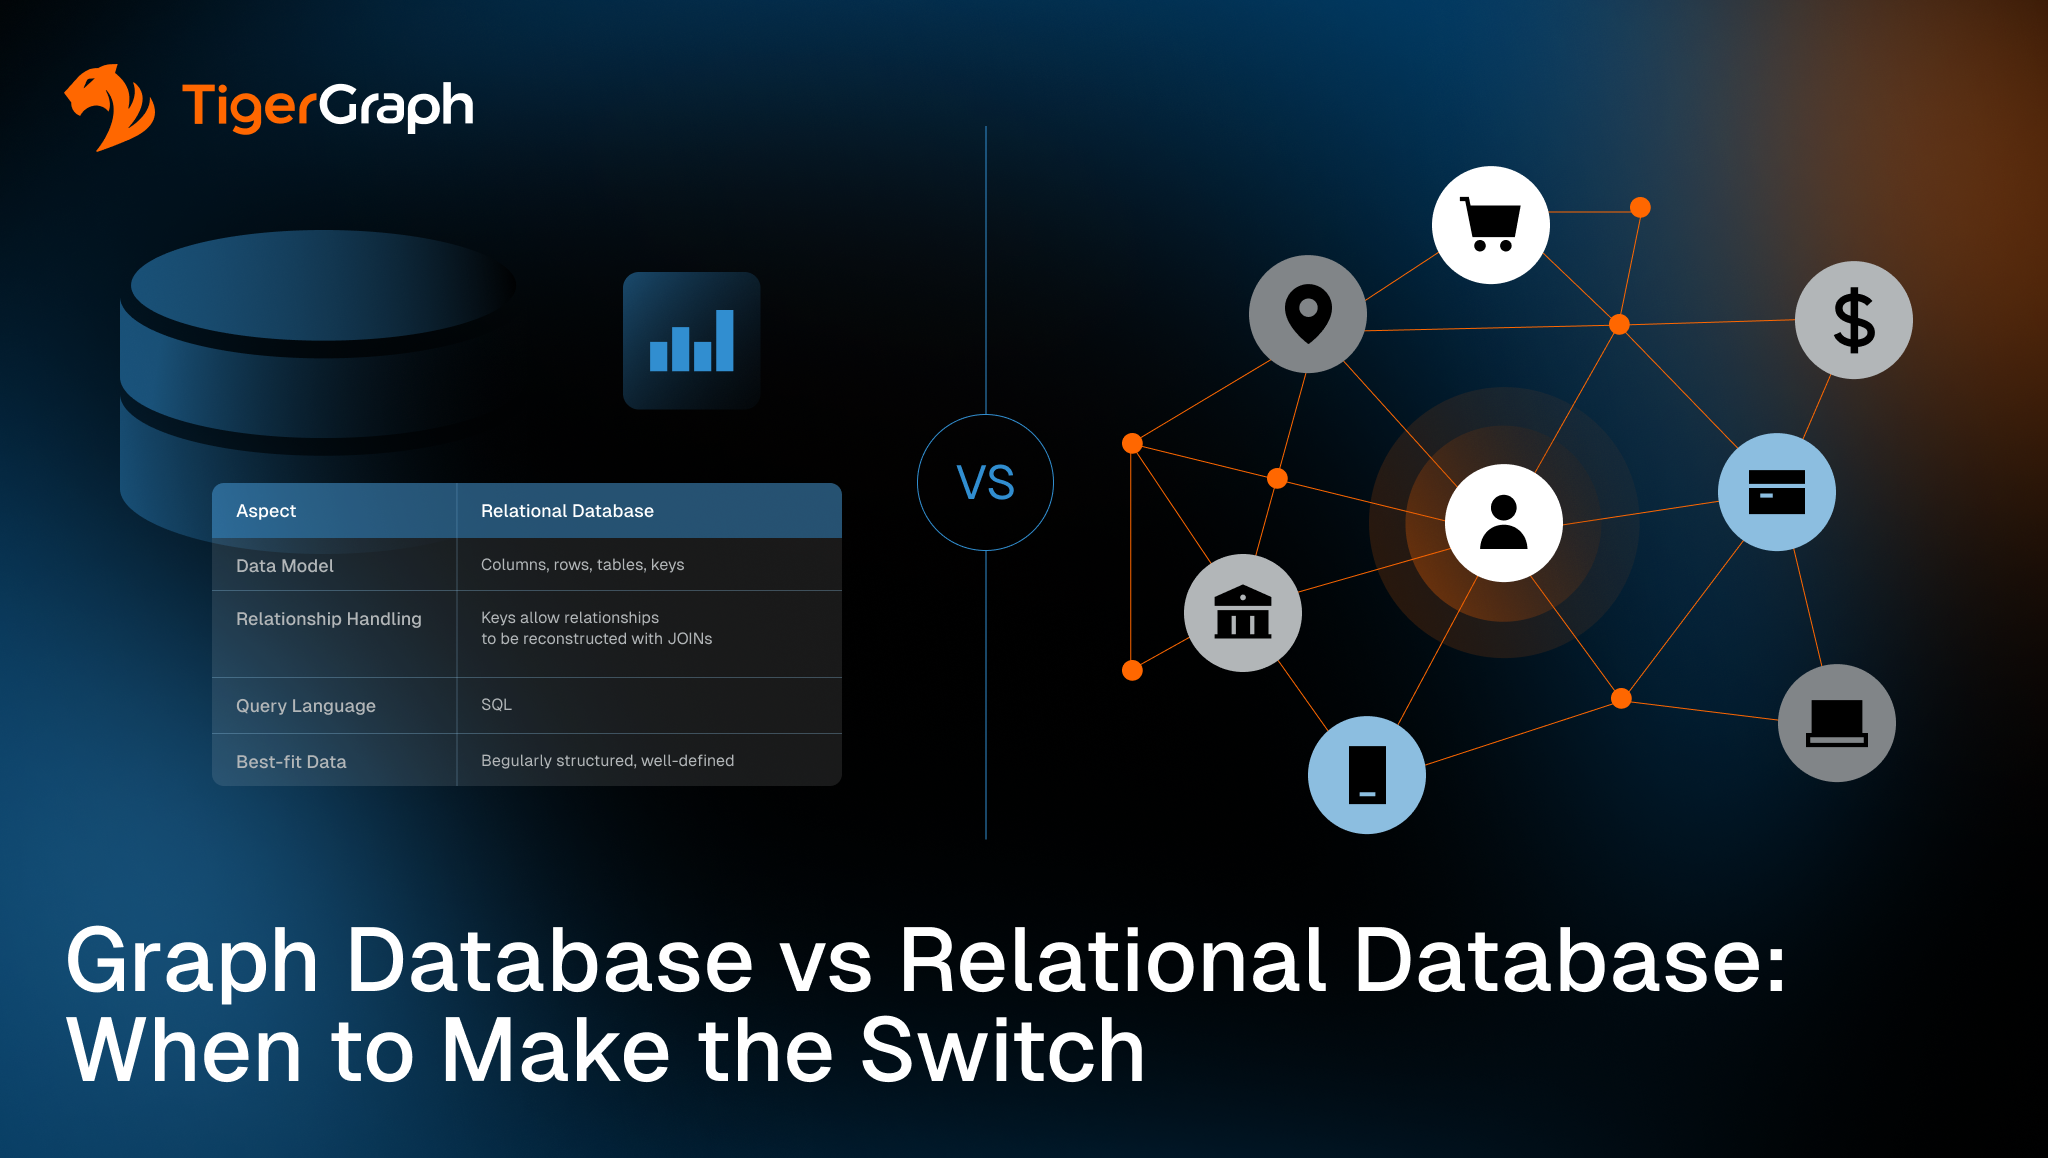
Graph Database vs Relational Database: Key Differences
Relational and graph databases are generally not competitors; they are each ideal for solving different problems. Knowing the key differences between graph and relational databases is essential when deciding the best way to handle data for your organization’s needs.
Have a look at a direct comparison of features:
| Graph Database | Relational Database | |
| Data model | Nodes, relationships, properties | Columns, rows, tables, keys |
| Relationship handling | Relationships are a primary data type | Keys allow relationships to be reconstructed with JOINs |
| Query language | Cypher, Gremlin, GQL, or GSQL | SQL |
| Multi-hop relationship query performance | Fast, regardless of overall dataset volume | Slow, sometimes to the point of never completing |
| Schema flexibility | Very flexible. Add new nodes, properties, or relationships freely. | Somewhat rigid. Predefined schema before data ingestion. |
| Best-fit data | Highly connected, less structured
(social networks, knowledge graphs, etc.) | Regularly structured, well-defined |
| Best-fit workloads | Analytic, unknown, or deep relationships, recursive queries, pattern recognition | Transactional, set-oriented operations, aggregations, statistical analyses |
The most significant of these differences is the performance when doing multi-hop relationship analyses. This is the one that you should look at the most closely when considering a graph database. Watch for the seven signs listed below to give you a good idea when your workload would be better suited to a graph database.
When to Use a Relational Database
Relational databases are particularly powerful for any data workload that needs the assurance that comes from decades of stable design. When well-defined, rarely-changing schemas are the norm, and data integrity and strong consistency is critical, a relational database shines. Processing economic transactions is the most obvious place where transactional completeness or rollbacks, and stable schemas are a huge advantage, but relational databases are also right for many other use cases where it’s important for multiple different records to be changed together, such as inventory and order management.
Switching databases is not always the right answer, even if ACID compliance isn’t a key need. If your data doesn’t have a lot of deep relationships or if your analyses don’t require diving into those relationships, sticking with a mature, tried and true relational database may be the answer. Relational databases power a lot of business intelligence dashboards that expect data to be in a tabular form and perform analyses like sales by region, buying behavior by season, or year-over-year stock price comparison.
Expertise is also a factor you should consider. There is always a learning curve with any new type of technology. If your team has a lot of experience with SQL and relational databases, and none with graph databases, switching to something your people don’t understand may not make sense.
When to Use a Graph Database
Graph databases provide adaptable representations of complex environments. This simplifies analysis of the underlying relationships in real time. The advantages of graph databases over relational databases lie in key use cases like detecting risk earlier, uncovering hidden patterns in massive datasets, and getting advanced analytics like machine learning and AI into production faster. Beyond analyzing individual transactions or records, a graph database helps you understand how entities interact across networks, ecosystems, and behaviors.
Here are some examples of use cases where a graph database is more performant and why:
- Fraud detection and other financial crime detection – Fraud schemes are becoming more complex. Integrated graph machine learning algorithms and centrality clustering of suspicious accounts is often the only way to catch them. In fintech and large financial institutions, the speed of transactions for example, 50 million/day is often far too high for a multi-join relational database analysis to complete within the very small required electronic transaction fraud analysis response time (80 milliseconds).
- Real-time recommendations – Early recommendation engines performed statistical computations offline of often days-old snapshots of data. Modern graph databases use machine learning/AI on current data with a relationship-first data model, giving better insight to customer needs at that exact moment.
- Supply chain analysis and logistics dependency mapping – Reduce disruption from problems like forecasting errors, supplier failures, and general change impacts. Jaguar Land Rover had their data in 23 relational tables. It used to take three weeks to make evaluations with that many joins, if the queries finished at all. Switching to a graph database lets them do the same calculations in 45 minutes.
- Customer 360 and entity resolution – For example, Xandr, the analytics division of WarnerMedia, created a digital advertising platform that combines consumer data from 15 different properties so the user journey could be followed across all of them in a multi-hop data traversal.
There are a wide variety of other use cases ideally suited to graph, such as energy optimization, marketing campaign optimization, customer experience, customer intelligence, and customer loyalty optimization, anti-money laundering, cybersecurity threat detection, and customer journey optimization. Graph is going to be the better choice for any use case that requires analyzing relationships across many things.
7 Signs Your Data Model Has Outgrown a Relational Database
One of the best ways to determine if you need a graph database is to look carefully at your current issues. In many cases, slow performance or rising infrastructure costs are mistaken for a hardware or indexing problem.
Watch for these 7 signs:
- Queries regularly require multiple JOINs. Chances are high that if this happens a lot, your analyses are focusing on relationships.
- Query performance degrades as data volume grows. Your first instinct is probably to re-index. However, if you see a combination of one and two, a lot of JOINs, and a growing dataset, no amount of indexing will help.
- Relationship logic is being handled in application code rather than the database layer. Chances are high that taking that burden off your developers is the right move. They’re never going to be as good at relationship analysis as a database designed specifically for that.
- Fraud or anomaly detection failing to detect complex patterns. If your analyses need to see relationships to function, then a relationship-centric data storage model is the clear answer.
- Recommendation quality is weak because user behavior context is too shallow. If your recommendation algorithm is working with stale or partial data, it’s not going to provide recommendations that reach their full revenue-boosting potential.
- Schema changes require significant planning, migration effort, and rollback contingencies. This could just be normal, but if a large percentage of your use cases require multiple JOINs, your future self might thank you for switching to a graph model where schema changes have virtually zero impact.
- The product roadmap includes use cases centered on networks, paths, or connections. If the direction your organization needs to go is focused on interactions, it makes sense to switch now to a data model that supports that type of analysis.
Making the Switch? Here’s What to Consider
Switching all your organization’s business processes and data from one database to another is likely to be disruptive and expensive. It’s also likely to be unnecessary. Many organizations run graph and relational databases side by side, with the relational databases handling the use cases they do best, and the graph databases taking a lot of the burden off them by doing what they do best. Very few organizations do a full replacement.
Identify a single high-value use case centered around relationships, especially if that use case is putting an onerous burden on your existing relational database. Start by moving over that workload. Your relational database users will breathe a sigh of relief. Once one use case has proven its value, then tackle the next one.
What you should first consider is your team’s skillset. You may need to upskill your team on graph technology, and possibly hire a graph consultant to get you started. Consider whether you will host the new database internally or use a managed cloud service, and how the new database will be integrated into existing systems. Ensure the graph database vendor you choose offers a good support plan as well.
Check out the TigerGraph free trial option or their Getting Started resources as a low-risk first step.
Key Takeaway
Relational databases are powerful for structured data and transactional and statistical workloads while graph databases provide far better performance and insight for use cases that analyze networks and relationships. Check the 7 signs section, and consider if you are experiencing some of those on a regular basis. If so, a good next step is to contact TigerGraph to request a demo or try it out yourself with their free trial option.
FAQs
Is a graph database faster than a relational database?
Graph databases are generally faster for connected, multi-hop queries. Relational databases are generally faster and more efficient for transactional and single-table statistical workloads. As datasets scale larger, the performance for multi-hop relationship analyses tends to remain fast on a graph database, but slows down considerably on a relational one.
What is the main difference between a graph database and a relational database?
In a relational database, data is stored in tables and relationships are defined by keys within those tables. When queried, compute-intensive JOIN operations are necessary to retrieve relationships, and when many relationships need to be queried, performance slows to a crawl, and may even fail entirely. In a graph database, data is stored as entities and relationships with properties. Finding patterns and networks and multi-hop relationships between entities is far more performant and robust.
When should I use a graph database instead of a relational database?
When your use case is centered around relationships, a graph database will be far more efficient and effective than a relational database. Some examples of ideal graph database use cases include: fraud detection, entity resolution, cybersecurity threat detection, recommendations, supply chain analysis, energy optimization, marketing campaign optimization, customer experience, customer intelligence, and customer loyalty optimization, anti-money laundering, and customer journey optimization.
Can graph and relational databases be used together?
Yes. There’s even a word for when multiple different types of database are used in a single enterprise: polyglot architecture. Relational databases are ideal for certain workloads and graph databases are ideal for other workloads. Many organizations use both, with each one doing the work it does best.
Does TigerGraph replace my existing database?
Not necessarily. Relational databases are ideal for certain workloads and graph databases are ideal for other workloads. Many organizations use both, with each one doing the work it does best.