
Summary
- Machine learning models can only learn from the signals they receive: when business outcomes depend on relationships between entities, features drawn only from individual records leave part of the predictive signal unused.
- Graph feature engineering converts connections, paths, communities, influence, and network position into numerical features that can be combined with conventional attributes and supplied to existing models such as gradient-boosted trees, random forests, and neural networks.
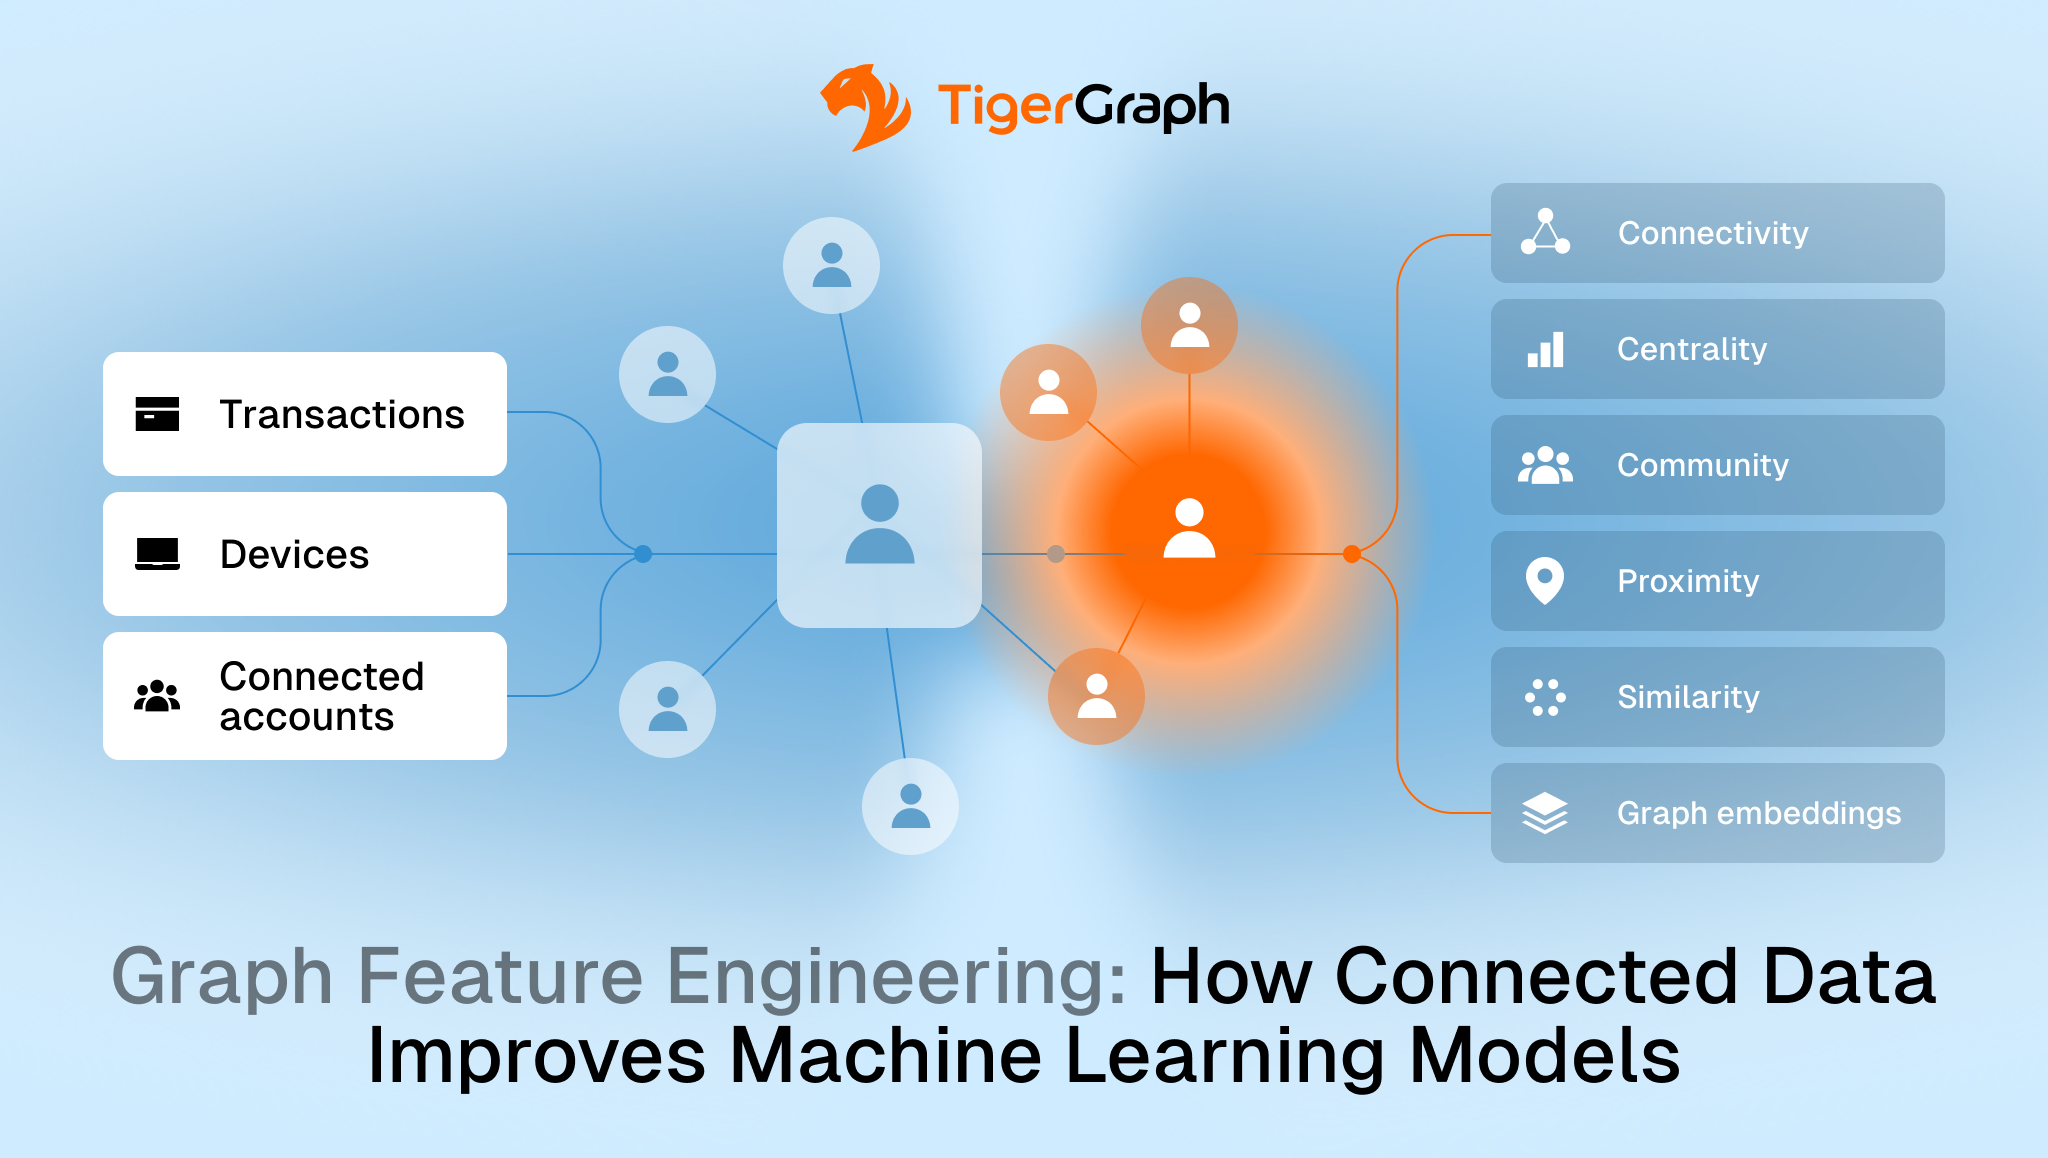
- Six categories of graph features address different aspects of connected behavior: connectivity, centrality, community, proximity, similarity, and graph embeddings.
- Graph feature engineering is distinct from graph embeddings (which encode network structure as dense vectors) and graph neural networks (which are model architectures that learn directly from graph topology during training rather than consuming pre-computed features).
- TigerGraph’s Graph Data Science Library provides more than 50 algorithms across centrality, community detection, similarity, pathfinding, and node embeddings for generating relationship-aware features at enterprise scale.
Two bank accounts can have similar transaction histories and radically different fraud risk. One may be connected through shared devices, beneficiaries, and intermediary accounts to a known fraud network. The other may have no suspicious connections. Transaction-level features alone cannot capture that difference. Graph feature engineering can.
Graph feature engineering captures that context. It converts connections, paths, communities, influence, similarity, and network position into measurable features that machine learning models can use. Instead of describing only the entity being scored, the model can also learn from the connected environment around it.
You’ll learn:
- Why traditional feature engineering misses network signals that shape fraud, risk, and customer behavior
- Six types of graph features and the ML problems each one addresses
- How graph feature engineering differs from graph embeddings and graph neural networks
- Best practices for combining graph features with conventional attributes in production ML pipelines
What Is Graph Feature Engineering?
Graph feature engineering is the process of transforming relationships and structural characteristics in connected data into numerical features for machine learning models.
A conventional customer dataset might include account tenure, transaction count, average order value, or location. A graph extends that view by representing which devices the customer uses, which accounts receive money from them, which products they purchase, and which other customers share those connections.
Those relationships can then become features. A fraud model, for example, might use:
- Number of devices shared with risky accounts
- Percentage of suspicious connected accounts
- Community membership
- Distance to confirmed fraud
- Network centrality
- Number of common counterparties
These features can be combined with conventional attributes and supplied to models such as gradient-boosted trees, random forests, logistic regression, or neural networks.
Graph-based feature engineering, therefore, does not require organizations to replace their existing machine learning stack. It adds relationship-aware signals to the data those models already use.
Why Traditional Feature Engineering Misses Network Signals
Most feature engineering techniques start with attributes attached directly to an individual record. That approach works well when predictions depend mainly on the characteristics of a single entity. Many enterprise problems, however, are shaped by relationships between entities.
Fraud provides a clear example. A transaction may appear normal based on its value, location, and timing but become suspicious when the originating account shares a device with several accounts previously associated with fraud. A supplier may look financially healthy in isolation while sitting at the center of several critical production dependencies. A customer may appear unremarkable based on purchase history but occupy an influential position within a valuable customer network.
These patterns are difficult to capture when the underlying data is represented only as individual records and tables. Relational systems can calculate some relationship measures, but deeper network features often require repeated joins, recursive logic, and aggregation across multiple tables. The process becomes more complex as the number and depth of relationships increase.
Graph-based feature engineering makes this structural context explicit. By converting connections, communities, paths, similarity, and network position into model-ready features, it gives machine learning models access to signals that would otherwise be difficult to capture. Graph models preserve these relationships directly, making it easier for data science teams to incorporate network context into existing machine learning workflows, improving their ability to detect meaningful patterns and make more accurate predictions.
Six Types of Graph Features That Improve ML Models
Different graph algorithms expose different aspects of connected behavior.
| Feature type | Example | What it captures | Typical use |
| Connectivity | Node degree, shared connections | Breadth of relationships | Fraud, engagement |
| Centrality | PageRank, betweenness | Importance of an entity in the overall structure | Risk, recommendations |
| Community | Community membership | Group structure | Segmentation, fraud rings |
| Proximity | Shortest-path distance | Closeness to important entities | Fraud, cybersecurity |
| Similarity | Jaccard, common neighbors | Structural resemblance | Recommendations, matching |
| Embeddings | node2vec-style vectors | Broader network context | Classification, prediction |
Connectivity Features
Connectivity features measure how an entity interacts with the surrounding network. Examples include the number of counterparties associated with an account, unique devices used by a customer, or suppliers serving a facility.
These measures can distinguish activity volume from relationship patterns. An account with 500 transactions involving three familiar counterparties represents a different behavioral pattern from one with the same transaction volume spread across hundreds of new accounts.
Centrality and Influence Features
Centrality algorithms measure how important an entity is to the structure of a network.
A supplier with modest purchase volume may still create significant operational risk if many important supply paths depend on it. An account positioned between multiple suspicious groups may also warrant additional scrutiny even when its own transaction volume appears normal.
Community Features
Community detection identifies groups whose members are more closely connected to one another than to the wider network.
Community ID, community size, the proportion of risky entities within a community, and the number of connections crossing between communities can all become model features.
These signals are useful for detecting fraud rings, identifying customer segments, and finding coordinated behavior that individual-level metrics can miss.
Path and Proximity Features
Many predictions depend on how close an entity is to something important. Useful features might include shortest-path distance to confirmed fraud, the number of suspicious entities within a defined neighborhood, or the distance between a cybersecurity asset and compromised infrastructure.
Proximity features turn questions such as “How closely connected is this entity to known risk?” into values a model can learn from.
Similarity and Neighborhood Features
Similarity algorithms compare entities based on the relationships they share. Common-neighbor counts and Jaccard similarity, for example, can quantify overlapping products, devices, counterparties, or behaviors.
These features are useful for recommendation systems, entity resolution, customer intelligence, and link prediction.
Graph Embeddings
Graph embeddings encode structural information as numerical vectors. Rather than defining every structural signal individually, an embedding captures aspects of an entity’s position and neighborhood in a lower-dimensional representation.
Algorithms such as node2vec generate representations that preserve network structure and can be used as inputs to downstream classification, ranking, and prediction models.
From Connected Data to Model Features
Effective graph feature engineering begins with the prediction problem, not with the algorithm. First, identify the relationships that could influence the outcome. A fraud graph might connect customers, accounts, transactions, devices, merchants, and IP addresses. A supply chain graph might connect suppliers, parts, manufacturing facilities, shipments, and products.
Next, calculate relevant structural signals. Depending on the use case, these might include centrality scores, community membership, shared-device counts, risky-neighbor ratios, similarity scores, or distance from known fraud.
The graph-derived features can then be combined with conventional attributes such as transaction value, account age, geography, product category, or historical behavior. The resulting dataset can feed an existing classifier, regression model, or ranking system.
Feature generation also needs to continue as the underlying network changes. A customer’s community, a supplier’s importance, or an account’s proximity to risk can shift as new relationships appear.
TigerGraph combines native graph storage, distributed parallel processing, and graph analytics to calculate relationship-aware features across large, connected datasets. Rather than repeatedly reconstructing multi-hop relationships through joins or external processing pipelines, teams can compute graph features closer to the underlying data and incorporate them into existing ML workflows. TigerGraph’s Graph Data Science Library provides algorithms for centrality, community detection, similarity, pathfinding, and node embeddings to support these workflows.
Measuring the Impact of Graph Features
The value of graph feature engineering should be measured, not assumed. Compare a baseline model trained on conventional attributes with the same model trained on those attributes plus graph-derived features. Keep the dataset, train/test split, and model configuration consistent. Evaluate precision, recall, and PR-AUC, particularly for imbalanced problems such as fraud detection.
Graph Feature Engineering vs. Graph Embeddings vs. Graph Neural Networks
Graph feature engineering, graph embeddings, and graph neural networks all use connected data, but they do so differently.
Graph feature engineering explicitly calculates relationship-aware measures. A feature might indicate that an account is two connections from confirmed fraud, belongs to a high-risk community, or shares four devices with suspicious accounts. These features are often interpretable because their meaning is defined before training.
Graph embeddings encode network structure into dense numerical vectors. Instead of providing a named feature for every structural characteristic, an embedding captures broader information about an entity’s position and neighborhood. Special algorithms or machine learning techniques are used to generate embeddings. If two nodes have similar embedding vectors, then they have similar-looking surroundings.
A graph neural network, or GNN, is different. A GNN is a type of neural network designed specifically to learn from graph structure, typically by aggregating information from neighboring entities during training.
Adding graph-derived features to a conventional neural network does not make it a graph neural network. Graph feature engineering works with existing algorithms such as gradient-boosted trees, logistic regression, random forests, and standard neural networks. It can therefore be a practical starting point for teams that want to incorporate connected context while retaining familiar models and feature-level explainability. GNNs become relevant when the model itself needs to learn directly from graph topology and neighborhood information.
Where Graph-Based Feature Engineering Creates Business Value
Graph feature engineering is particularly valuable when relationships influence the outcome being predicted.
Fraud and financial crime. Fraud networks rarely reveal themselves through individual transactions. Shared devices, common beneficiaries, intermediary accounts, and multi-hop money flows can expose coordinated activity that appears legitimate when transactions are evaluated independently. Graph-derived features turn these relationships into measurable risk signals that existing models can use to identify suspicious activity and prioritize investigations.
Entity resolution and connected identity. Records that appear unrelated may represent the same individual, organization, or network. Shared addresses, devices, contact information, and transaction relationships provide additional signals for identifying potential matches, resolving identities, and exposing hidden connections across fragmented enterprise data.
Recommendations and personalization. Product similarity, shared behavior, common neighbors, community membership, and graph embeddings can reveal affinities beyond static customer segmentation.
Customer intelligence and churn. Household relationships, account connections, customer influence, and interaction communities can complement behavioral features used to predict churn, customer value, or next-best actions.
Supply chain risk. Supplier centrality, dependency depth, alternative supply paths, and proximity to disrupted suppliers can show which entities create the greatest network-wide exposure.
Cybersecurity. Distance to compromised assets, reachable critical systems, shared credentials, and position on potential attack paths can add structural exposure to traditional security risk scores.
In each case, the objective is not simply to generate more features. It is to identify relationship patterns that have a meaningful connection to the prediction target.
What Makes Graph Feature Engineering Difficult at Enterprise Scale?
Graph feature engineering becomes more challenging when features must be calculated repeatedly across large, changing networks. Every new transaction, device, customer interaction, supplier, or security event can change an entity’s network context. A feature calculated from yesterday’s graph may no longer represent today’s risk or opportunity.
Scale compounds the challenge. A single entity may connect indirectly to thousands or millions of others. Pipelines that repeatedly extract data, reconstruct relationships, run algorithms, and move the resulting features into another system add both latency and operational complexity.
Production ML also requires consistency. The same feature definition used during training should be reproducible when models score new data.
TigerGraph addresses these problems first by employing distributed, massively parallel processing and second by bringing graph analytics closer to the connected data itself. Its Graph Data Science capabilities support in-database algorithms for calculating structural signals at scale, while pyTigerGraph enables data science teams to incorporate those results into Python-based analytics and machine learning workflows.
The result is a more direct path from connected enterprise data to model-ready features without requiring teams to repeatedly reconstruct the network outside the graph platform.
Visualize the Signals Behind the Features
A graph feature should not become a model input simply because an algorithm produced a number. Data scientists and investigators often need to understand the relationships behind that value.
If an account receives a high centrality score, which connections made it important? If a community has an unusually high concentration of fraud, what connects its members? If an entity is close to known risk, what relationship path creates that proximity?
Visualization makes those structural signals easier to inspect before they become production features. It can also expose unexpected relationships, modeling assumptions, or data-quality problems that are difficult to identify from a feature table alone.
TigerGraph Insights provides interactive graph visualization and analytics for exploring connected data, investigating paths and neighborhoods, and examining the results of graph algorithms.
Best Practices for Graph Feature Engineering
Start with a prediction hypothesis. Avoid calculating every available graph metric. Identify which relationship behavior could plausibly influence the target, then select the feature engineering techniques that capture it.
Combine graph and conventional features. Transaction amount, account age, product category, geography, and historical behavior can remain predictive even when relationship context is available.
Prevent target leakage. A fraud model should not learn from relationships that appeared after the point when the prediction would have been made. Graph features should reflect the network as it existed at prediction time.
Validate incremental value. Compare a baseline model using conventional attributes with the same model after graph features are added. Evaluate embeddings and GNNs separately when the problem justifies them.
Preserve interpretability where it matters. Features such as proximity, centrality, community risk, and shared connections can provide understandable context for model predictions in fraud, risk, security, and other consequential applications.
Machine learning models do not automatically understand relationships. Those relationships must be represented in the features they consume or learned through graph-aware model architectures.
TigerGraph helps enterprises extract relationship-aware signals from connected data at scale, bringing critical network context into existing machine learning workflows.
Explore TigerGraph’s Graph Data Science Library or request a demo to see how graph feature engineering can strengthen your ML models.
FAQs
What is graph feature engineering?
Graph feature engineering converts relationships and network structure into numerical features for machine learning models. Examples include centrality, community membership, similarity, shared-neighbor counts, and distance to known risk.
How are graph features used in machine learning?
Graph features can be combined with conventional attributes and supplied to models such as gradient-boosted trees, random forests, logistic regression, and neural networks. They extend the feature set available to any model that accepts tabular inputs.
What graph algorithms are useful for machine learning?
Common approaches include centrality, community detection, shortest path, similarity, connected components, link prediction, and graph embedding algorithms. The right choice depends on which aspect of network structure is most predictive for the target outcome.
What are graph embeddings?
Graph embeddings are numerical vector representations that encode structural information about entities and their surrounding network for downstream machine learning tasks. Unlike named graph features, embeddings capture broader network context in a compact form.
Is graph feature engineering the same as a graph neural network?
No. Graph feature engineering calculates relationship-aware inputs for a downstream model. A graph neural network is a model architecture designed to learn directly from graph structure during training. Graph feature engineering works with any standard ML model and is often a practical starting point for teams that want to incorporate connected context while preserving feature-level interpretability.