Skip to content
START FOR FREE
START FOR FREE
  • SUPPORT
  • COMMUNITY
Menu
  • SUPPORT
  • COMMUNITY
MENUMENU
  • Products
    • The World’s Fastest and Most Scalable Graph Platform

      LEARN MORE

      Watch a TigerGraph Demo

      TIGERGRAPH CLOUD

      • Overview
      • TigerGraph Cloud Suite
      • FAQ
      • Pricing

      USER TOOLS

      • GraphStudio
      • Insights
      • Application Workbenches
      • Connectors and Drivers
      • Starter Kits
      • openCypher Support

      TIGERGRAPH DB

      • Overview
      • GSQL Query Language
      • Compare Editions

      GRAPH DATA SCIENCE

      • Graph Data Science Library
      • Machine Learning Workbench
  • Solutions
    • The World’s Fastest and Most Scalable Graph Platform

      LEARN MORE

      Watch a TigerGraph Demo

      Solutions

      • Solutions Overview

      INCREASE REVENUE

      • Customer Journey/360
      • Product Marketing
      • Entity Resolution
      • Recommendation Engine

      MANAGE RISK

      • Fraud Detection
      • Anti-Money Laundering
      • Threat Detection
      • Risk Monitoring

      IMPROVE OPERATIONS

      • Supply Chain Analysis
      • Energy Management
      • Network Optimization

      By Industry

      • Advertising, Media & Entertainment
      • Financial Services
      • Healthcare & Life Sciences

      FOUNDATIONAL

      • AI & Machine Learning
      • Time Series Analysis
      • Geospatial Analysis
  • Customers
    • The World’s Fastest and Most Scalable Graph Platform

      LEARN MORE

      CUSTOMER SUCCESS STORIES

      • Ford
      • Intuit
      • JPMorgan Chase
      • READ MORE SUCCESS STORIES
      • Jaguar Land Rover
      • United Health Group
      • Xbox
  • Partners
    • The World’s Fastest and Most Scalable Graph Platform

      LEARN MORE

      PARTNER PROGRAM

      • Partner Benefits
      • TigerGraph Partners
      • Sign Up
      TigerGraph partners with organizations that offer complementary technology solutions and services.​
  • Resources
    • The World’s Fastest and Most Scalable Graph Platform

      LEARN MORE

      BLOG

      • TigerGraph Blog

      RESOURCES

      • Resource Library
      • Benchmarks
      • Demos
      • O'Reilly Graph + ML Book

      EVENTS & WEBINARS

      • Graph+AI Summit
      • Graph for All - Million Dollar Challenge
      • Events &Trade Shows
      • Webinars

      DEVELOPERS

      • Documentation
      • Ecosystem
      • Developers Hub
      • Community Forum

      SUPPORT

      • Contact Support
      • Production Guidelines

      EDUCATION

      • Training & Certifications
  • Company
    • Join the World’s Fastest and Most Scalable Graph Platform

      WE ARE HIRING

      COMPANY

      • Company Overview
      • Leadership
      • Legal Terms
      • Patents
      • Security and Compliance

      CAREERS

      • Join Us
      • Open Positions

      AWARDS

      • Awards and Recognition
      • Leader in Forrester Wave
      • Gartner Research

      PRESS RELEASE

      • Read All Press Releases
      TigerGraph Recognized in 2022 Gartner® Critical Capabilities for Cloud Database Management Systems for Analytical Use Cases
      January 12, 2023
      Read More »

      NEWS

      • Read All News

      A Shock to the System: ShockNet Predicts How Economic Shocks Could Affect the World Economy

      TigerGraph Recognized for the First Time in the 2022 Gartner® Magic Quadrant™ for Cloud Database Management Systems

  • START FREE
    • The World’s Fastest and Most Scalable Graph Platform

      GET STARTED

      • Request a Demo
      • CONTACT US
      • Try TigerGraph
      • START FREE
      • TRY AN ONLINE DEMO

Graph Neural Network-based Graph Outlier Detection: A Brief Introduction

  • Yingtong Dou
  • September 15, 2022
  • blog, Developers, Machine Learning / AI
  • Blog >
  • Graph Neural Network-based Graph Outlier Detection: A Brief Introduction

This blog is written by Yingtong Dou, a Ph.D. candidate at the University of Illinois Chicago, working on graph mining, fraud detection, and secure machine learning. The content of this blog is based on his recent paper and a tutorial at Machine Learning in Finance workshop at KDD 2022.

This blog will introduce the basic mechanism of graph neural networks and the concepts and methods in unsupervised node outlier detection on graphs. Some findings and thoughts in this direction are also shared. Last, I will introduce a GNN-based graph outlier detection library (PyGOD) and its integration with TigerGraph ML Workbench.

Graph Neural Networks

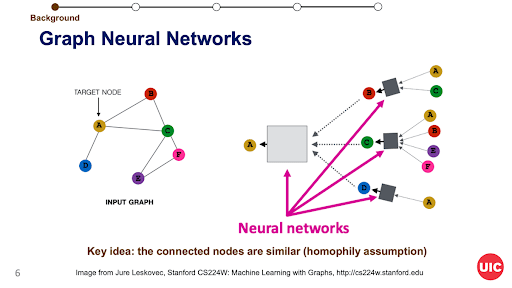
The graph neural network (GNN) has recently become a dominant and powerful tool in mining graph data. Like the CNN for image data, the GNN is a neural network designed to encode the graph structure and learn a node’s embedding via iteratively aggregating its neighbors’ embedding (see Figure 1). Most GNNs hold the homophily assumption that the connected nodes are similar; therefore, aggregating the neighbors’ information would help learn a more informative center node representation. The center node representation can be used for downstream tasks like node classification, link prediction, and outlier detection (OD).
Graph neural network
Figure 1: The Graph Neural Network

Outliers on Graph

The outlier is a sample that is significantly different from the remaining data. As a mainstream research direction in data mining research, outlier detection is also crucial in the industry. An outlier in real-world data usually indicates fraudulent behavior, system error, network intrusion, or network failure. Those outliers may result in significant financial loss and security issues.

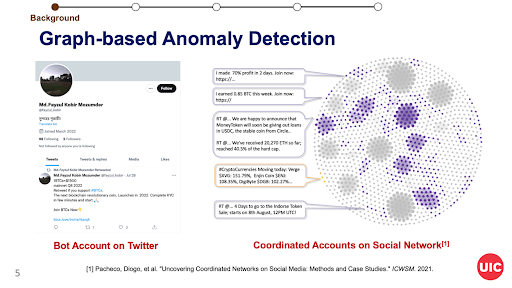
Besides the outliers in traditional tabular data, the graph model could elevate the outlier detection performance, especially when data instances share common properties and have proximities. As Figure 2 shows, the bot account is less suspicious individually, but its co-retweet is densely connected, which can be easily spotted from the graph perspective.
graph-based anomaly detection
Figure 2: Graph-based anomaly detection

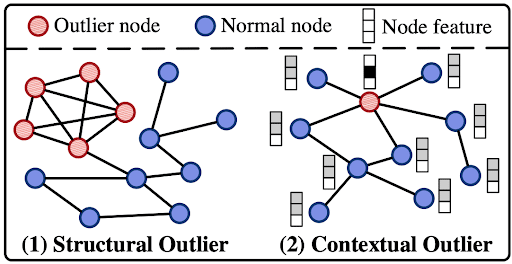
In graph outlier detection, two typical types of outliers are defined and studied by previous literature. According to Figure 3, (1) structural outliers are densely connected nodes in contrast to sparsely connected regular nodes, and (2) contextual outliers are nodes whose attributes differ significantly from their neighboring nodes. The structural outliers are illustrated above, in Figure 2. The contextual outlier depicts nodes dissimilar to their neighbors in the graph, e.g., compromised devices in the computer network. Its definition is like the assumption of the outlier in the classic proximity-based OD methods.
node outlier types
Figure 3: Two typical node outlier types

GNN-based Node Outlier Detection

Before the advance of the GNNs, matrix factorization, density-based clustering, and relational learning methods are leveraged to encode the graph information and identify outliers. More non-GNN graph OD methods can be found in this comprehensive survey.

Let us come back to GNNs. After obtaining the node representations, the GNN is optimized using different loss functions (objective functions) for different tasks. For instance, a cross-entropy loss is used to optimize GNN for the node classification task.

For node outlier detection, the common practice is to integrate GNNs into the auto-encoder, where the GNN is used as the encoder and decoder. This neural architecture is called graph auto-encoder (GAE). Like vanilla autoencoders, the GAE encodes the graph information by reconstructing the graph data, i.e., reconstructing node features and edges. In terms of outlier detection, GAE can be used to encode the normal graph information, and the node with a high reconstruction error will indicate its outlier degree. Figure 4 shows the first model using GAE for node outlier detection.

DOMINANT OD framework
Figure 4: The OD framework of DOMINANT (SDM’ 19)

Note that using GAE for outlier detection has two implicit assumptions for the graph data: (1) the outliers only take a small amount of data, and the majority of the data is normal; (2) the normal data share common attribute and structure properties. With this assumption, the GAE can be leveraged to detect structural and contextual outliers, and there have been many variants of GAE in the recent two years.

Findings from Benchmark

Next, I will share some valuable findings from our recent benchmark for GNN-based node outlier detection methods:

  1. Many existing GNN-based OD methods are developed based on synthetic outliers with the relatively naive assumption for the outliers; thus, many do not have an ideal performance in detecting organic outliers in the wild. The organic outliers are usually complicated, and their distribution may be diverse. Nevertheless, our benchmark shows that the GNN-based OD methods will be effective if the organic outliers follow the predefined outlier types.
  2. Like most deep learning methods, the GNN-based OD methods will be sub-optimal on small graphs. At the same time, most GNN-based OD methods are not scalable on large graphs with tens of millions of nodes.
  3. The performance of unsupervised GNN-based OD methods relies heavily on hyperparameters, and the hyperparameter tuning under unsupervised learning remains a challenge in machine learning research and practice.
  4. Most GNN-based OD methods prefer a specific type of outliers. It is not easy to balance and optimize the detection performance for each outlier type. Meanwhile, no method has consistent performance or outperforms other methods across different datasets in expectation.

A Guideline for Graph-based OD

Based on the above findings, we argue that there is still a gap between the GNN-based OD and industry application due to its scalability constraints. Developing automatic, scalable, and task-oriented GNN-based OD methods would be a promising direction. As for applying GNN-based OD or graph-based OD, I give a guideline in the following figure to facilitate practitioners.
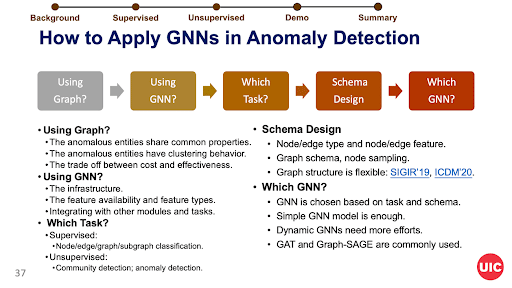
GNN to Graph OD
Figure 5: A Guideline for Applying GNNs in Graph OD

From the above guideline, I want to highlight that the exploratory analysis of the data and a precise problem definition are crucial for applying graph-based OD.

PyGOD and TigerGraph ML Workbench

Last, I would like to introduce, PyGOD, a Python library developed along with our graph OD benchmark. The library is developed based on PyTorch and PyTorch Geometric (PyG) and the API style follows the popular ML library scikit-learn, where we can easily detect outliers on graphs with five lines of code:

PyGOD
Figure 6: Running PyGOD with Five Lines of Code

The PyGOD is continually developed toward covering more detection capabilities and higher scalabilities. Thanks to the TigerGraph ML Workbench, which enables the graph data transformation from TigerGraph DB to PyG data object, the PyGOD can be easily installed and tested on TigerGraph. 

Please follow the tutorial and this jupyter notebook for instructions on running PyGOD under the TigerGraph environment.

You Might Also Like

TigerGraph Showcases Unrivaled Performance at Scale

TigerGraph Showcases Unrivaled Performance at Scale

January 12, 2023
How to Create a Visual Graph Analytics Application Using TigerGraph Insights in 30 mins

How to Create a Visual Graph...

November 14, 2022
Turbocharge your business intelligence with TigerGraph’s ML Workbench on TigerGraph Cloud

Turbocharge your business intelligence with TigerGraph’s...

November 14, 2022

Introducing TigerGraph 3.0

July 1, 2020

Everything to Know to Pass your TigerGraph Certification Test

June 24, 2020

Neo4j 4.0 Fabric – A Look Behind the Curtain

February 7, 2020

TigerGraph Blog

  • Categories
    • blogs
      • About TigerGraph
      • Benchmark
      • Business
      • Community
      • Compliance
      • Customer
      • Customer 360
      • Cybersecurity
      • Developers
      • Digital Twin
      • eCommerce
      • Emerging Use Cases
      • Entity Resolution
      • Finance
      • Fraud / Anti-Money Laundering
      • GQL
      • Graph Database Market
      • Graph Databases
      • GSQL
      • Healthcare
      • Machine Learning / AI
      • Podcast
      • Supply Chain
      • TigerGraph
      • TigerGraph Cloud
    • Graph AI On Demand
      • Analysts and Research
      • Customer 360 and Entity Resolution
      • Customer Spotlight
      • Development
      • Finance, Banking, Insurance
      • Keynote
      • Session
    • Video
  • Recent Posts

    • It’s Time to Harness the Power of Graph Technology [Infographic]
    • TigerGraph Showcases Unrivaled Performance at Scale
    • TigerGraph 101 An Introduction to Graph | Jan 26th @ 9am PST
    • Data Science Salon New York
    • Tech For Retail
    TigerGraph

    Product

    SOLUTIONS

    customers

    RESOURCES

    start for free

    TIGERGRAPH DB
    • Overview
    • Features
    • GSQL Query Language
    GRAPH DATA SCIENCE
    • Graph Data Science Library
    • Machine Learning Workbench
    TIGERGRAPH CLOUD
    • Overview
    • Cloud Starter Kits
    • Login
    • FAQ
    • Pricing
    • Cloud Marketplaces
    USEr TOOLS
    • GraphStudio
    • TigerGraph Insights
    • Application Workbenches
    • Connectors and Drivers
    • Starter Kits
    • openCypher Support
    SOLUTIONS
    • Why Graph?
    industry
    • Advertising, Media & Entertainment
    • Financial Services
    • Healthcare & Life Sciences
    use cases
    • Benefits
    • Product & Service Marketing
    • Entity Resolution
    • Customer 360/MDM
    • Recommendation Engine
    • Anti-Money Laundering
    • Cybersecurity Threat Detection
    • Fraud Detection
    • Risk Assessment & Monitoring
    • Energy Management
    • Network & IT Management
    • Supply Chain Analysis
    • AI & Machine Learning
    • Geospatial Analysis
    • Time Series Analysis
    success stories
    • Customer Success Stories

    Partners

    Partner program
    • Partner Benefits
    • TigerGraph Partners
    • Sign Up
    LIBRARY
    • Resources
    • Benchmark
    • Webinars
    Events
    • Trade Shows
    • Graph + AI Summit
    • Million Dollar Challenge
    EDUCATION
    • Training & Certifications
    Blog
    • TigerGraph Blog
    DEVELOPERS
    • Developers Hub
    • Community Forum
    • Documentation
    • Ecosystem

    COMPANY

    Company
    • Overview
    • Careers
    • News
    • Press Release
    • Awards
    • Legal
    • Patents
    • Security and Compliance
    • Contact
    Get Started
    • Start Free
    • Compare Editions
    • Online Demo - Test Drive
    • Request a Demo

    Product

    • Overview
    • TigerGraph 3.0
    • TIGERGRAPH DB
    • TIGERGRAPH CLOUD
    • GRAPHSTUDIO
    • TRY NOW

    customers

    • success stories

    RESOURCES

    • LIBRARY
    • Events
    • EDUCATION
    • BLOG
    • DEVELOPERS

    SOLUTIONS

    • SOLUTIONS
    • use cases
    • industry

    Partners

    • partner program

    company

    • Overview
    • news
    • Press Release
    • Awards

    start for free

    • Request Demo
    • take a test drive
    • SUPPORT
    • COMMUNITY
    • CONTACT
    • Copyright © 2023 TigerGraph
    • Privacy Policy
    • Linkedin
    • Facebook
    • Twitter

    Copyright © 2020 TigerGraph | Privacy Policy

    Copyright © 2020 TigerGraph Privacy Policy

    • SUPPORT
    • COMMUNITY
    • COMPANY
    • CONTACT
    • Linkedin
    • Facebook
    • Twitter

    Copyright © 2020 TigerGraph

    Privacy Policy

    • Products
    • Solutions
    • Customers
    • Partners
    • Resources
    • Company
    • START FREE
    START FOR FREE
    START FOR FREE
    TigerGraph
    PRODUCT
    PRODUCT
    • Overview
    • GraphStudio UI
    • Graph Data Science Library
    TIGERGRAPH DB
    • Overview
    • Features
    • GSQL Query Language
    TIGERGRAPH CLOUD
    • Overview
    • Cloud Starter Kits
    TRY TIGERGRAPH
    • Get Started for Free
    • Compare Editions
    SOLUTIONS
    SOLUTIONS
    • Why Graph?
    use cases
    • Benefits
    • Product & Service Marketing
    • Entity Resolution
    • Customer Journey/360
    • Recommendation Engine
    • Anti-Money Laundering (AML)
    • Cybersecurity Threat Detection
    • Fraud Detection
    • Risk Assessment & Monitoring
    • Energy Management
    • Network Resources Optimization
    • Supply Chain Analysis
    • AI & Machine Learning
    • Geospatial Analysis
    • Time Series Analysis
    industry
    • Advertising, Media & Entertainment
    • Financial Services
    • Healthcare & Life Sciences
    CUSTOMERS
    read all success stories


    PARTNERS
    Partner program
    • Partner Benefits
    • TigerGraph Partners
    • Sign Up
    RESOURCES
    LIBRARY
    • Resource Library
    • Benchmark
    • Webinars
    Events
    • Trade Shows
    • Graph + AI Summit
    • Graph for All - Million Dollar Challenge
    EDUCATION
    • TigerGraph Academy
    • Certification
    Blog
    • TigerGraph Blog
    DEVELOPERS
    • Developers Hub
    • Community Forum
    • Documentation
    • Ecosystem
    COMPANY
    COMPANY
    • Overview
    • Leadership
    • Careers  
    NEWS
    PRESS RELEASE
    AWARDS
    START FREE
    Start Free
    • Request a Demo
    • SUPPORT
    • COMMUNITY
    • CONTACT
    Dr. Jay Yu

    Dr. Jay Yu | VP of Product and Innovation

    Dr. Jay Yu is the VP of Product and Innovation at TigerGraph, responsible for driving product strategy and roadmap, as well as fostering innovation in graph database engine and graph solutions. He is a proven hands-on full-stack innovator, strategic thinker, leader, and evangelist for new technology and product, with 25+ years of industry experience ranging from highly scalable distributed database engine company (Teradata), B2B e-commerce services startup, to consumer-facing financial applications company (Intuit). He received his PhD from the University of Wisconsin - Madison, where he specialized in large scale parallel database systems

    Todd Blaschka | COO

    Todd Blaschka is a veteran in the enterprise software industry. He is passionate about creating entirely new segments in data, analytics and AI, with the distinction of establishing graph analytics as a Gartner Top 10 Data & Analytics trend two years in a row. By fervently focusing on critical industry and customer challenges, the companies under Todd's leadership have delivered significant quantifiable results to the largest brands in the world through channel and solution sales approach. Prior to TigerGraph, Todd led go to market and customer experience functions at Clustrix (acquired by MariaDB), Dataguise and IBM.