Summary
- Collaborative filtering recommendation system algorithms predict preferences from past interactions, but hit hard limits with cold starts, data sparsity, and no awareness of relationship context.
- Graph database recommendation system algorithms store users, items, and their relationships together, enabling multi-hop traversal, real-time personalization, and explainable recommendations.
- The core difference is the data model: a flat interaction matrix versus a rich, traversable relationship network that reflects how people and products actually connect.
- Graph recommendations outperform collaborative filtering when explainability, real-time context, cold-start coverage, or complex relationship signals are required – financial services, healthcare, B2B, and streaming are high-fit use cases.
- Most enterprise systems use both approaches: collaborative filtering for dense interaction baselines, graph for real-time, context-rich, and explainable personalization at scale.
When recommendation systems first made an impact, nearly all operated on collaborative filtering recommendation system algorithms. The results were significant: personalized recommendations drove up to 5x growth in sales for e-commerce, streaming, and social media companies. But as customer data has grown richer and relationships more complex, collaborative filtering has started to show its structural limits. It only understands what users have done, not who they are, how they connect to others, or what context they are in right now.
A fundamentally different class of recommendation system algorithms, built on graph databases, is powering the next generation of personalization. These systems understand the full relationship network around every user and product, respond to real-time behavior, and produce recommendations that are transparent and explainable.
In this article, you’ll learn:
- How collaborative filtering recommendation system algorithms work and where they break down
- How graph database recommendation system algorithms represent and query richer relationship data
- Where the two approaches differ and which enterprise use cases favor each
- How a Customer 360 graph architecture raises the quality of every recommendation
How Collaborative Filtering Works – And Where It Breaks Down
What Is Collaborative Filtering?
Collaborative filtering is the technique behind most traditional recommendation system algorithms. It predicts what a user will prefer by analyzing patterns in past interactions across all users – if two users liked similar items, what one liked next is recommended to the other. Two main variants exist: user-based filtering, which finds similar users and recommends what they liked; and item-based filtering, which finds items similar to ones the user has already shown interest in.
Collaborative filtering has a long, well-documented history in recommendation system algorithms. Over that time, four structural limitations have emerged consistently.
- Cold start problem. New users or new items have no interaction history, making reliable recommendations impossible at the start of a relationship.
- Data sparsity. Most users interact with only a small fraction of available items, leaving large gaps in the similarity matrix that make calculating meaningful similarity difficult.
- No relationship context. Collaborative filtering records that users are similar, but not how they are connected, what attributes items carry, or what external context the user is in – location, time, device, or current session behavior.
- Static recommendations. Similarity scores are computed offline from data snapshots, often days old. They do not update as a user’s session evolves.
Each limitation is manageable in isolation. Together, they point to an underlying data model problem. Collaborative filtering is built on a sparse, flat interaction matrix. It cannot represent the richness of real relationships between users and items.
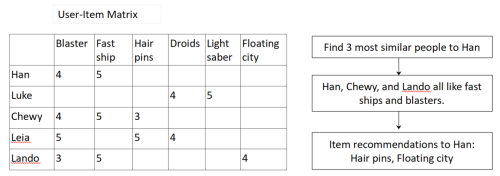
Consider a simple example. Chewy and Lando are the users most similar to Han in expressed preferences, so the recommendation for Han surfaces items both liked that Han has not yet seen. The system surfaces hair pins and a floating city – but it cannot tell Han about an item that Lando’s friend Wedge loves, because Wedge’s purchasing behavior sits two relationship steps away from Han’s interaction matrix. Those indirect connections are invisible to collaborative filtering recommendation system algorithms.
Content-based filtering is sometimes layered in to patch some of these cracks, but it does not resolve the underlying data model constraint: every user and item interaction is still analyzed in isolation. That cumulative fragility has driven a significant shift in newer recommendation system algorithms toward graph databases as the foundational data model.
How Graph Databases Power Recommendation System Algorithms
What Is a Graph Database?
A graph database is a database designed to store and query data as a network of entities and the relationships connecting them. Rather than organizing data in tables or vectors, a graph database treats relationships as first-class data – stored, indexed, and traversable at query time. This makes graph databases the natural fit for recommendation system algorithms that need to follow chains of connections across users, items, behaviors, and context. Examples of graph databases include TigerGraph, Neo4j, and Amazon Neptune.
Using a graph database for recommendation system algorithms enriches the context and structure of the data in ways a flat interaction matrix cannot. Graph databases store not just data points, but equally the relationships between them – and those relationships carry meaning.
In a graph recommendation system, users, items, categories, attributes, and events are modeled as entities. Interactions, preferences, similarities, and hierarchies are modeled as relationships. Moving from a matrix to a traversable graph provides a representation that mirrors the complexity of reality more closely than any flat data structure.
The graph stores not just that Leia likes Luke, but that they love each other, are family, and are siblings. Not just that someone bought a game, but that they disliked it and which game they preferred. Not just that someone visited a new store, but that they stayed for nearly an hour. Every signal becomes part of a queryable relationship network.
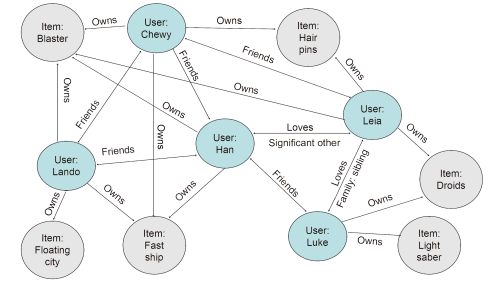
Relationship weights quantify the strength and importance of connections, giving the algorithm far more signal than simple user similarity scores. In the example above, Han is friends with Luke and in love with Leia – Luke and Leia are siblings. As both own droids, the graph recommendation for Han surfaces droids. More importantly: Lando’s friend Wedge loves X-wing fighters and automatic targeting systems. Because Han and Wedge are connected through two relationship steps, those items surface in a graph recommendation that collaborative filtering would never produce.
Here’s another real life example: running shoes may be an excellent recommendation for a user who has never purchased athletic gear, but follows running athletes on social media and is connected to several people who bought running shoes in the past week – especially if those friends are themselves connected to five others who just bought the same product. The graph sees that signal. The flat interaction matrix does not.
There are three main types of graph database recommendation system algorithms:
- Graph traversal-based recommendations. Following relationships from the target user to items that connected users have interacted with, but the target user has not. Traversing deeper beyond a single relationship step surfaces more novel, indirect recommendations.
- Graph Neural Network algorithms using graph embeddings. Graph Neural Networks (GNNs) learn vector representations for each entity that encode both its attributes and its structural position in the graph. These embeddings power similarity-based recommendation system algorithms that incorporate relationship context, not just item features. GNNs significantly outperform traditional machine learning on this class of problem.
- Hybrid graph and vector search. Combining graph relationship following (including relationship filters, user context, and access constraints) with vector similarity search (for content or behavior similarity) gives a powerful boost to both recommendation novelty and accuracy.
The ideal platform for these recommendation system algorithms supports all three: graph analysis, GNN support, and hybrid graph and vector search in the same query engine.
Graph vs. Collaborative Filtering: Comparing Recommendation System Algorithms
Graph database recommendation system algorithms and collaborative filtering are not mutually exclusive. Many production systems use both. They handle different data conditions and offer different capabilities. The table below highlights where graph database recommendation system algorithms provide a measurable advantage.
| Graph | Collaborative Filtering | |
| Core data model | Entities (users, items, categories, attributes, events) connected by typed, weighted relationships. | Interaction matrix: user-item interactions only. |
| Handles cold start | Uses relationship connections and item attributes to recommend even without prior interactions. | Struggles with limited or no interaction history for new users or items. |
| Real-time personalization | Queries real-time, updated relationship data for every recommendation. | Computes offline from data snapshots, often days old. |
| Relationship and context signals | Rich context: quantified relationships, multi-hop indirect connections, behavioral and attribute signals. | Isolated user-item interactions. User similarity calculated from past item interactions only. |
| Explainability | Relationship paths in the graph explain recommendations directly. | Algorithmic calculations are difficult to trace or audit. |
| Scalability for complex queries | Fast response at enterprise scale. | Struggles above one million users for complex similarity calculations. |
| Best-fit use cases | Real-time personalization, cold-start coverage, explainability requirements, and complex relationship signals. | Baseline recommendations with dense interaction data and limited user metadata – music and video streaming, for example. |
Two differences carry the most commercial weight.
Explainability. Graph relationships are essentially self-explaining recommendation paths. Han loves Leia. Luke is her brother. Both own droids. Han might want a droid. Showing users why a recommendation was made increases trust and measurably improves response rates. Collaborative filtering produces a similarity score – difficult to audit and nearly impossible to present to an end user.
Real-time personalization. Recommending in real time requires fast queries across multiple related data points at any dataset size. New signals from a user’s current session are captured in the graph immediately, and included in the next recommendation calculation without waiting for a batch recompute. For enterprises where purchase intent changes by the minute, that responsiveness is a direct revenue driver.
Enterprise Use Cases: Where Graph Recommendation System Algorithms Outperform
Certain recommendation system use cases are particularly well-matched to graph database solutions. In each, the relationship richness of the graph provides an advantage that a flat interaction matrix cannot replicate.
- E-commerce and retail personalization. A graph data model connects browsing history, purchase history, social signals, product attributes, and real-time session behavior into a single queryable model. Recommendations respond to mid-session behavior changes without a full model retrain – a direct advantage over batch-computed collaborative filtering recommendation system algorithms.
- Streaming and content platforms. Graph databases model the full content catalog as a network of genres, creators, themes, and user communities. This allows graph recommendation system algorithms to surface relevant content a user has never interacted with, solving both the cold-start and long-tail content discovery problems at the same time.
- Financial services. Products, accounts, life events, and peer behavior all become part of the graph, making recommendations for the right financial product at the right moment in the customer journey highly explainable. Regulatory transparency requirements are met through traceable relationship paths – an audit trail that collaborative filtering recommendation system algorithms cannot provide.
- Healthcare and life sciences. Using a knowledge graph for recommender systems connects patient attributes, treatment pathways, research findings, and clinical outcomes. Making relationship context a primary feature of the data model surfaces more relevant care options or drug candidates.
- B2B and enterprise platforms. Company hierarchies, buying relationships, product dependencies, and account history all map naturally to a graph model. Representing these structures accurately powers more relevant next-best-action and cross-sell recommendation system algorithms in complex, multi-stakeholder sales environments.
Customer 360: The Foundation That Makes Graph Recommendation System Algorithms Work
A graph recommendation system is only as good as the graph data behind it. A well-built Customer 360 project feeds all available information from across the enterprise into the graph, providing the richest, most complete picture of each customer that is possible.
What Is Customer 360?
Customer 360 is a strategy for deeply understanding a customer’s needs, wants, and position in their journey by aggregating every piece of information an enterprise holds about them: purchases, browsing data, support interactions, social connections, account attributes, and real-time actions. In a graph database, information scattered across enterprise systems becomes a single, traversable relationship network.
A recommendation system is only as good as its picture of the customer. That picture depends on two things working together: a unified view of who the customer is, and a continuously updated view of what they are doing.
That is where customer 360 and entity resolution reinforce each other. Entity resolution consolidates multiple data versions of the same customer across systems, eliminating misleading duplicates and combining a customer’s full history into a single model. Without it, the same person appears as several fragmented records, and recommendations are built on an incomplete, sometimes contradictory picture. Once those records are resolved into a single entity, a graph database customer 360 makes everything an enterprise knows about that customer queryable in one place. Add real-time updates that capture what customers are doing in their current session, and recommendation accuracy increases significantly because the algorithm is finally working from a complete, live picture rather than a static, fragmented one.
Closing Remarks on Graph-Powered Recommendation System Algorithms
Collaborative filtering remains useful for simple, baseline recommendations with dense item interaction data and limited data about the user. But the best way to boost the response rate of any recommendation system is a Customer 360 project that provides a richer picture of both the customer and where they fit in their web of relationships and interactions. Graph is the only data model that represents both the entities and the relationships that give them meaning. For the real-time personalization, cold start coverage, explainability, and full customer context that enterprises need most, graph database recommendation systems are ideal.
Explore the TigerGraph recommendation engine or check out pricing and the free trial to see how graph works at your scale.
FAQs: Graph Database Recommendation System Algorithms
What is the difference between collaborative filtering and graph-based recommendation system algorithms?
Collaborative filtering uses a flat interaction matrix that records only user-item interactions. Graph recommendation system algorithms use a relationship network that includes user connections, item attributes, contextual signals, and real-time behavior – producing richer, more explainable recommendations, particularly in cold-start conditions and for users with complex relationship contexts.
What are the main recommendation system algorithms used in graph databases?
There are three primary types: graph traversal-based recommendations that follow relationship paths from a target user to indirectly connected items; Graph Neural Network algorithms that use graph embeddings to encode both entity attributes and structural position; and hybrid graph and vector search that combines relationship following with semantic similarity for improved novelty and accuracy.
Does a graph database solve the cold-start problem in recommendation systems?
Yes. Even when a user has no interaction history, graph recommendation system algorithms can recommend based on demographic similarity, network connections, and item attribute relationships. The graph finds signal in who the user is connected to and what attributes they share – not just what they have previously purchased.
What is the best graph database for recommendation system algorithms?
TigerGraph is designed for enterprise-scale recommendation workloads, with massively parallel processing architecture, real-time multi-hop relationship analysis, and native hybrid graph and vector search capabilities in a single query engine. It is built for the production-scale performance and explainability requirements that mission-critical recommendation system algorithms demand.
How does Customer 360 improve recommendation accuracy?
A complete, connected view of the customer provides richer contextual signals for recommendation system algorithms – purchase history, browsing behavior, support interactions, social connections, and real-time session activity all in one traversable model. This eliminates the reliance on interaction history alone, giving graph recommendation system algorithms the full context they need to surface relevant, timely, and explainable recommendations.