Protecting Telco Customers from Identity Theft and Artificially High Phone Bills
- Blog >
- Protecting Telco Customers from Identity Theft and Artificially High Phone Bills
TigerGraph is only the anti-fraud solution that is flexible enough to continuously fight the constantly evolving nature of fraud.
Are telco fraudsters just like financial fraudsters?
We have grown accustomed to the warnings our banks now display in our personalised banking experience, in their attempt to combat financial crime. We all know not to give our bank details to unknown people over the phone; we know to be covert with our credit card details; and we know to check twice before transferring money to anyone.
But fewer measures are in place to help combat the activities performed by fraudsters who are crossing from banking into the telco space. The more our phones have become our chief validation device for bank transfers, eCommerce transactions, and web application logins, the more damage a fraudster can do with our telephone details. All it takes is a simple SMS code, or a simple call pickup to confirm a potentially major transaction. In fact, victims of banking fraud are now suing their telco providers under identity privacy law.
Fraud in telco has always been a problem, but it is more so now than ever.
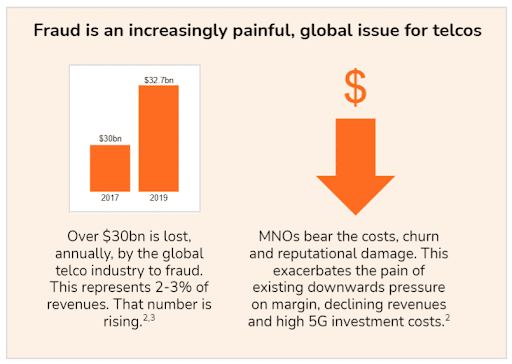
Sources: (2) r3 Telco Fraud Market Insights Report, 2021, and (3) Global Fraud Loss Survey, 2017
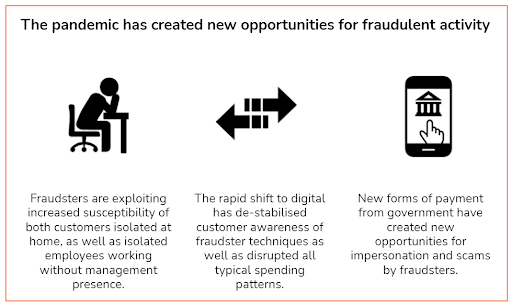
COVID has made things worse. Remote working, new government payment channels, and the digitisation of everything have created a prime breeding ground for new fraudster techniques.
What Sort of Problems Is it Causing for Telcos?
Fraud causes issues for telcos like revenue leakage, brand damage, and customer churn – all of which ultimately affect overall company value and share price.
Revenue Leakage
In the same way that banks often cover fraudulent purchases on your credit card, telcos have come to cover expensive calls made fraudulently on your account. Calls that have been made to international or premium-rate numbers via your account can be refunded to you if you did not want or mean to make them – without any refund to the telco on facilitating the transaction to begin with.
Brand Damage
The more you are targeted as a telco customer, the less safe you feel using a telco’s products. The telco can become associated with negligence, lack of due care for customers, and an inability to adhere to security standards.
Customer Churn
If you don’t feel safe, or if you’ve wasted too much time rectifying fraudulent activities on your account, you’re likely to leave your telco provider in pursuit of a better experience elsewhere.
What Kinds of Fraud Are We Talking About?
There are many types of fraud in telco, but there are two categories that we are particularly focused on: Identity Theft and Exploitation of Operational Weakness.
By Identity Theft, we are referring to fraud such as SIM Swap Fraud, SIM Registration under a False Identity, Call Diversion/Forwarding, and Mock-Provider Call to generate General Purpose Reloadable Top Up. Generally, Identity Theft fraud involves pretending to be someone in order to gain access to the benefits or capabilities their mobile brings.
By Exploitation of Operational Weakness, we are referring to fraud such as Wangiri Fraud, Toll Free Fraud, International NANPA Fraud, Call Forwarding Fraud, Multiple Transfer Fraud, and International Revenue Share Fraud. Generally, this type of fraud exploits customers by tricking them into driving higher bills for themselves through the use of lines that financially benefit the fraudster.
Other types of fraud are addressable with TigerGraph too but are out of the scope of this blog post. For reference, these include False Answer Supervision Fraud, Wholesale SIP Trunking Fraud, Boomeranging, Location Routing Number Fraud, Bypass Fraud (SIM Box Fraud, Leaky PBX Fraud, OTT Bypass Fraud, Call Transfer Fraud, Inter/Intra State Toll Fraud), Employee-provided Unpaid Credit, and Topping Up with Stolen Card Details.
How Does TigerGraph Combat Identity Fraud?
TigerGraph combats identity fraud by connecting all data sources together to create an intricate, consolidated digital representation of every customer that is impossible for fraudsters to fully emulate when they interact with the telco. TigerGraph can combine data such as identity data, billing records, account information, sales data, device information, customer service data, location data, phone usage data, and anything else that might help truly identify an individual into its database. The telco can then run native (and customisable) algorithms over all of that connected data to determine whether or not an individual calling or texting is really the same person as usual.
Is There an Example To Show How it Works?
Let’s take SIM Swap Fraud as an example to show how TigerGraph can combat identity theft – and this TigerGraph capability is applicable to all identity theft-based fraud.
Sim Swap fraud is when a fraudster uses stolen identity information to impersonate a mobile customer when making a call into telco customer service and passing all security questions … in order to ask customer service to switch that customer’s mobile number onto a SIM the fraudster owns. This means the fraudster can make calls or texts for free because they are charged to the original customer’s account.
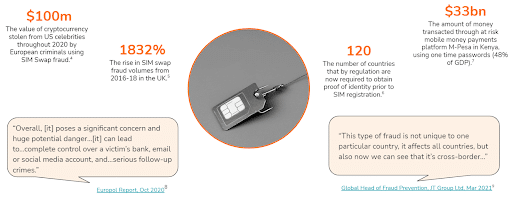
Sources: (4) Europol, Feb 2021, (5) The Times, Jul 2020, (6) GSMA, 2017, (7) SecureList, Apr 2019, (8) Europol Report, Oct 2020, (9) Global Head of Fraud Prevention, JT Group Ltd, Mar 2021
SIM Swap fraud is a growing issue, especially due to COVID-accelerated digitisation.
The problem is when the fraudster calls into customer service to request the swapping of a real customer’s number onto their fraudulent SIM, how can the customer service rep detect that the person is a fraudster if they are able to pass all security questions?
The solution is in surfacing to the customer service rep all aggregated data about that customer, in an instant – so that they may catch the fraudster out because it’s clear that they’re calling from an unusual device, or an unknown location – or they’re not able to answer deeper security questions, for example about the latest bill or payment.
But pulling all of that data together is hard – because the data needs to be properly connected throughout – connected into a golden thread for that customer. Details about that customer need to be holistically searchable, in an instant. Putting all of the data into a data lake does not suffice – the data must be connected, and not stored in separate tables. And connecting the data is hard when there is no easily cross-referenceable ID in every data source.
TigerGraph connects your data together and then matches holistic information about an individual through indirect connections. For example, in this diagram, you can see that the CDR record relates to the same individual as the Order Information, even though the two sources don’t share any of the same data (much less any cross-referenceable unique ID!)
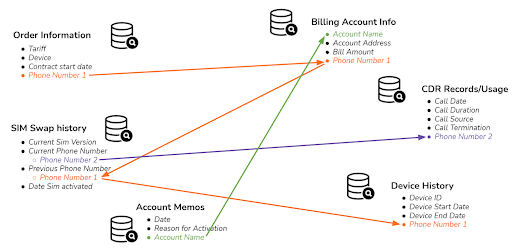
TigerGraph helps telcos weave together an intricate digital identity for each customer – an identity that fraudsters will not be able to impersonate for their own benefit. We call this the identity graph.
Customer identities can then be surfaced either as information or as visualisation to any employee – or it can be used as machine-readable input into an automated process that stops fraudsters. For example, it could surface a warning to a customer service rep that the call is from an unusual device or location – or it could trigger an additional deep security question process in the IVR before the fraudster even gets through to the customer service rep.
Does TigerGraph Combat Fraud Exploiting Operational Weakness in Exactly the Same Way?
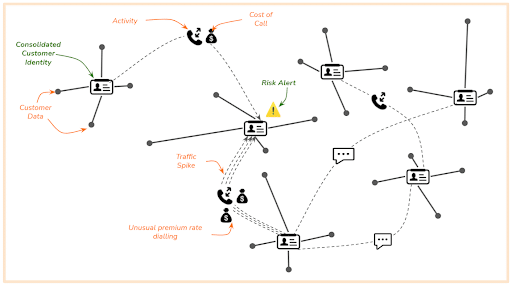
Fraud that exploits operational weakness is much easier to spot once the identity graph is in place. With a consolidated digital identity, every customer can be seen to have ‘usual’ usage habits – such as calling and texting specific types of numbers at specific times of day – habits that ‘fit’ with their identity and profile. Where calls or texts are suddenly unusual, for example to premium numbers at significant cost, it’s possible that fraud has taken place, exploiting the operational weakness of the network or phone number code norms.
Overlaying network and product usage to the identity graph can isolate fraud risks through the detection of unusual activity. TigerGraph native algorithms can spot these risks and surface them to the appropriate person (as human-readable info) or system (as machine-readable info).
In the visual below, you can see how the graph is able to identify risks in unusual activity or call costs.
The beauty of TigerGraph algorithms is that they can be customised to ask any question you need to ask of your connected data.
For example:
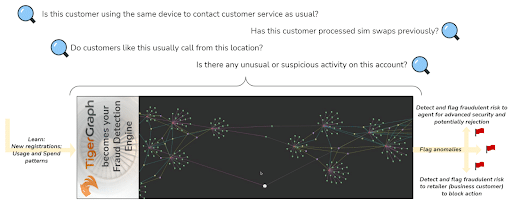
With such flexibility in which data you load into your graph and then which questions you ask of all of that data, the same TigerGraph application can be used to support as many different use cases as you like. It can even be used to supercharge business fraud prevention products:
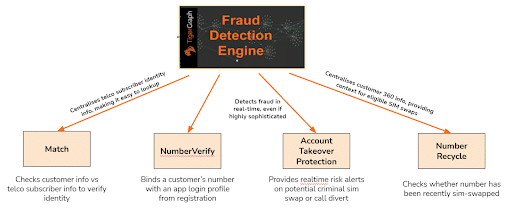
And importantly, your TigerGraph application can evolve in parallel with the evolving threat of fraud. Where fraudsters are constantly changing tactics to find new loopholes and evade detection, TigerGraph is able to maintain total flexibility, surfacing new insights from existing and new data, always at real-time speeds.
Does TigerGraph Replace Anything in My Existing Architecture?
TigerGraph is additive to your architecture and is really two technologies for the price of one: a graph database and a relationship analytics engine. Its primary contribution to your business is its unique analytical insight, derived from a combination of its ability to connect your data together and at the same time perform sophisticated analytical queries on that connected data. And you choose whether that insight is visualised or automatically actioned.
TigerGraph runs on top of your strategic cloud provider, compressing the data it stores – meaning lower storage and compute costs than alternative cloud-based approaches. It does not replace your cloud architecture.
It then outputs insight into your strategic AI/ML or data visualisation tools – and it can make that insight available to you in whichever format is most appropriate – whether through the native visualisation UI or in a machine-readable output such as CSV or JSON. Again, TigerGraph is additive to your data architecture and is intended to enhance, not replace, your AI or visualisation stack.
The Database
- Compatible with and underpinned by any major cloud server (AWS, GCP, Azure), whether private or public, as well as being available on-premises
- Consumes data in multiple input formats – e.g. CSV, JSON – in batch or via real-time API – to suit your data sources
- Automatically scales horizontally, meaning the user experiences a single database even if underneath it’s spread across multiple servers
- Produces query results in real-time (TigerGraph can query more than the population of Greece every second, per server) to support real-time call handling requirements
The Analytics Engine on Top of the Database
- Stop fraudsters from day one with built-in native algorithms such as Community Detection and Classification
- De-duplicate and match data using native identity resolution algorithms even if there is no easy matching ID, enhancing the quality of your data from day one
- Infer information using native algorithms such as Cosine or Jaccard similarity
- Write any query you can possibly think of using our query language, GSQL, which is a fully customisable, Turing-complete query language that is very similar to SQL
- Use queries to print results back into your database, enabling a deep learning, iterative insight mechanism
Are There Any Limits I Should Be Aware of?
- Types of data. With TigerGraph, there are no limits to the number of types of data you want to include in the graph – whether it’s customer data, usage data, metadata, or location data. All of your data types and how they relate together are mastered in the schema you can create manually within the TigerGraph Graph Studio UI. You can choose to include any new data type at any time by just updating your schema and loading the data.
- Scale. TigerGraph is built for scale – and whilst it doesn’t provision cloud servers automatically (because we believe that is a cost and technical design that you should be able to control), it does distribute and partition data across your provisioned servers automatically. This means that the TigerGraph user experience feels like there is only one server – and the user is never asked to do anything more than once, like being asked to create queries or schema for every additional server.
- Complexity of analytics. TigerGraph’s analytics engine is built for depth and breadth of query, meaning there is no limit to the number of data types or points you can include in a single query. We know that some of the most important insight comes from combining a significant number of data types and data points together at once – so we built the analytics engine to support you in whatever you need to ask of your data. We also recognise that native algorithms don’t always garner the details of the answer you need – and so we made our query language fully customisable – catering not just to any number of ifs, buts, and whens, but also enabling you to print results back into your database as new or overlaid data to be included in future queries.
- Speed. It’s important to note that where other technologies purport to be able to support the flexibility, scale, and analytical power referenced above, usually it is to the detriment of speed. This is because in effect the technology isn’t built natively to operate like that, and instead there are technical workarounds that make it possible if given the time to run. By contrast, TigerGraph was built natively for all of the above, meaning it really does deliver insight at real-time speeds. This is of paramount importance for catching fraud, which can cause significant financial outlay if not stopped the moment it happens.
So How Do I Get Started with TigerGraph?
You can download our free product if you’d like to get your hands on it straight away. Or you can reach out directly to our sales team if you’d like to see a demo and talk about how we could run a proof of concept with you using some of your data.


