Contact Us
Abstract digital network overlaid on financial data charts, illustrating connected data insights and ROI growth. Text reads “The Business Case for Graph in Banking: Turning Connected Data into ROI” with the TigerGraph logo, symbolizing graph analytics transforming financial performance.
The Business Case for Graph in Banking: Turning Connected Data into ROI
Discover
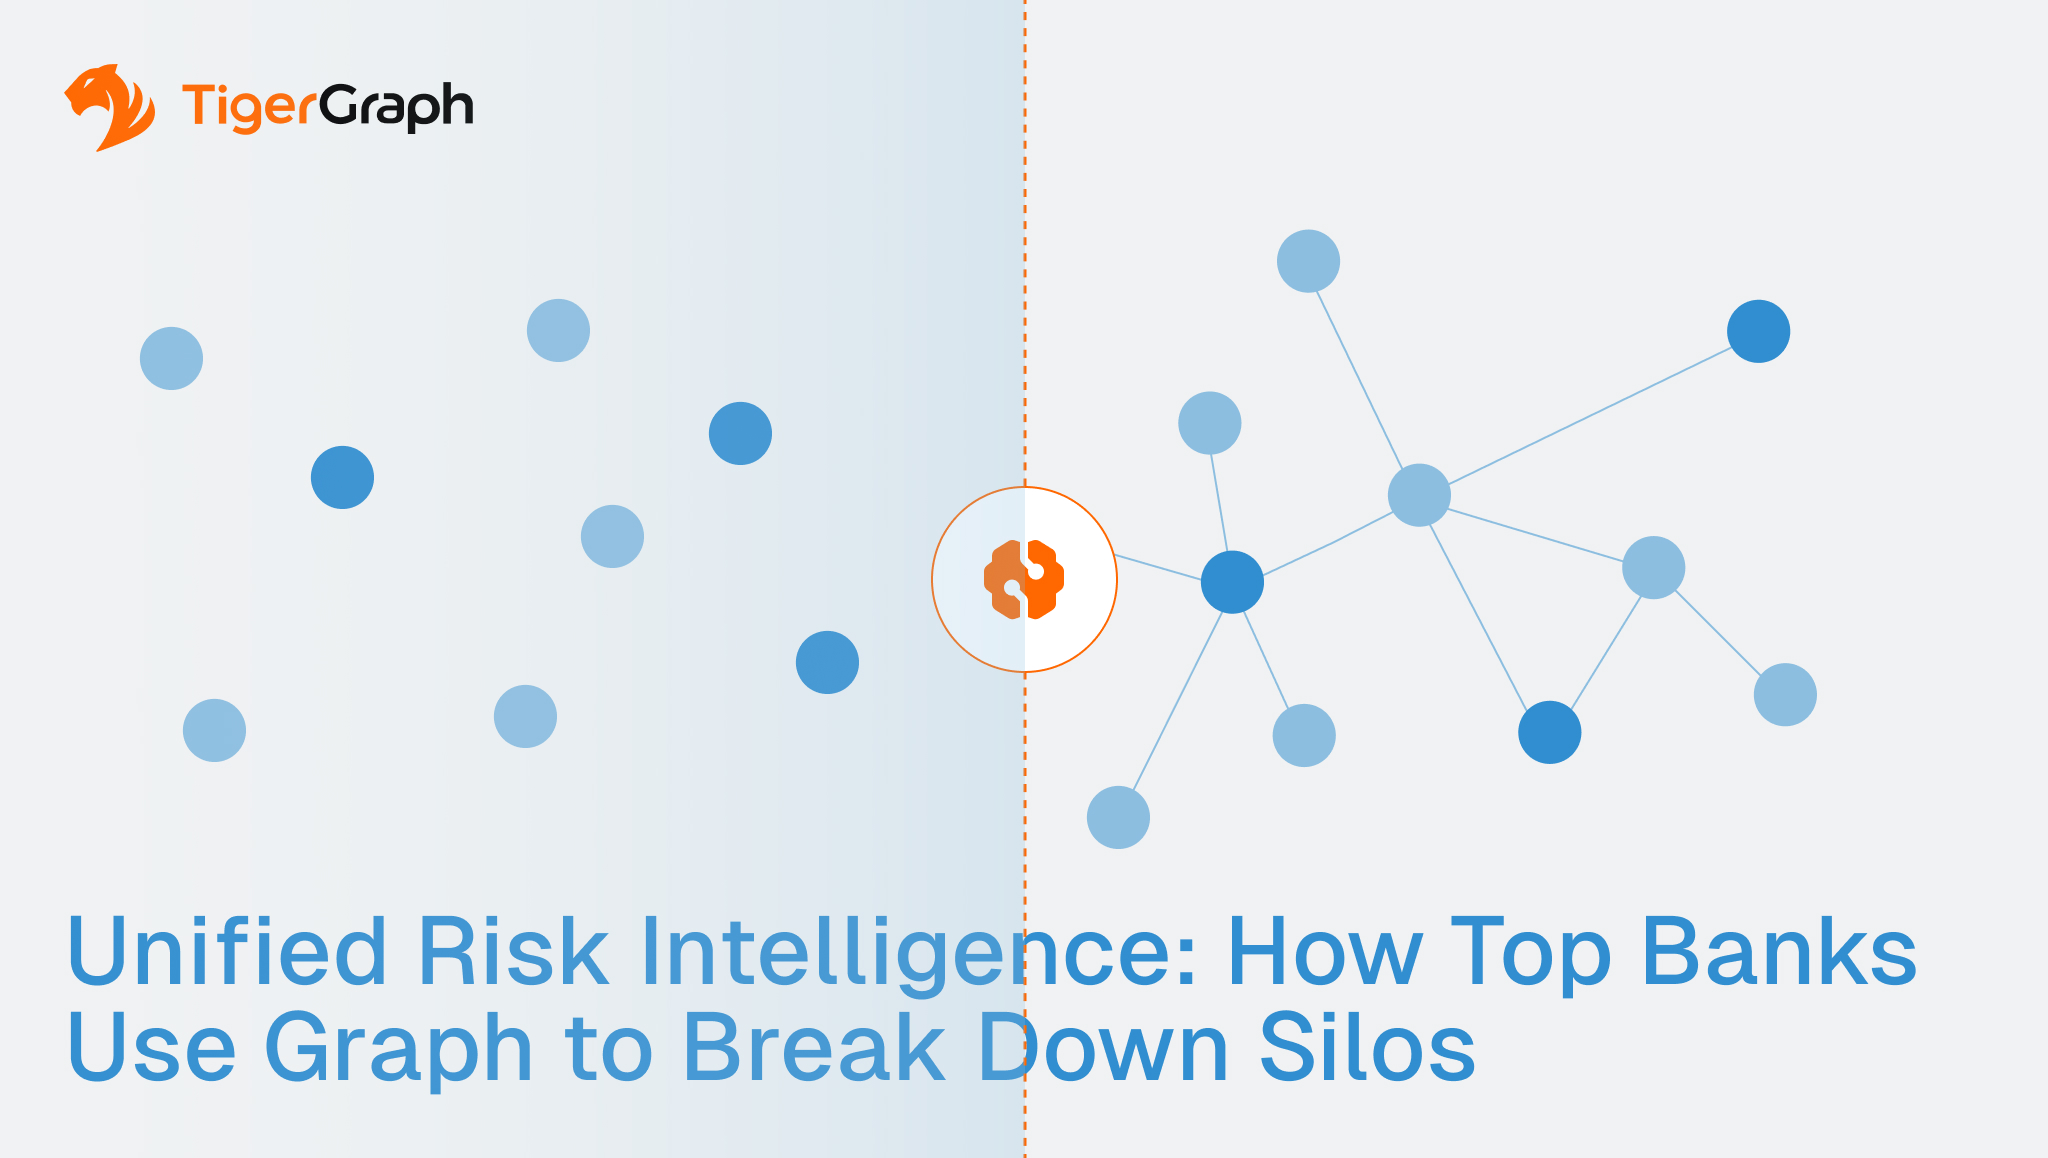
TigerGraph’s eBook Unified Risk Intelligence: How Top Banks Use Graph to Break Down Silos, featuring modern network graphics symbolizing connected data relationships in financial risk, fraud, and compliance—illustrating how leading banks achieve real-time visibility and $100M+ in savings using graph analytics.”
Unified Risk Intelligence: How Top Banks Use Graph to Break Down Silos
Discover
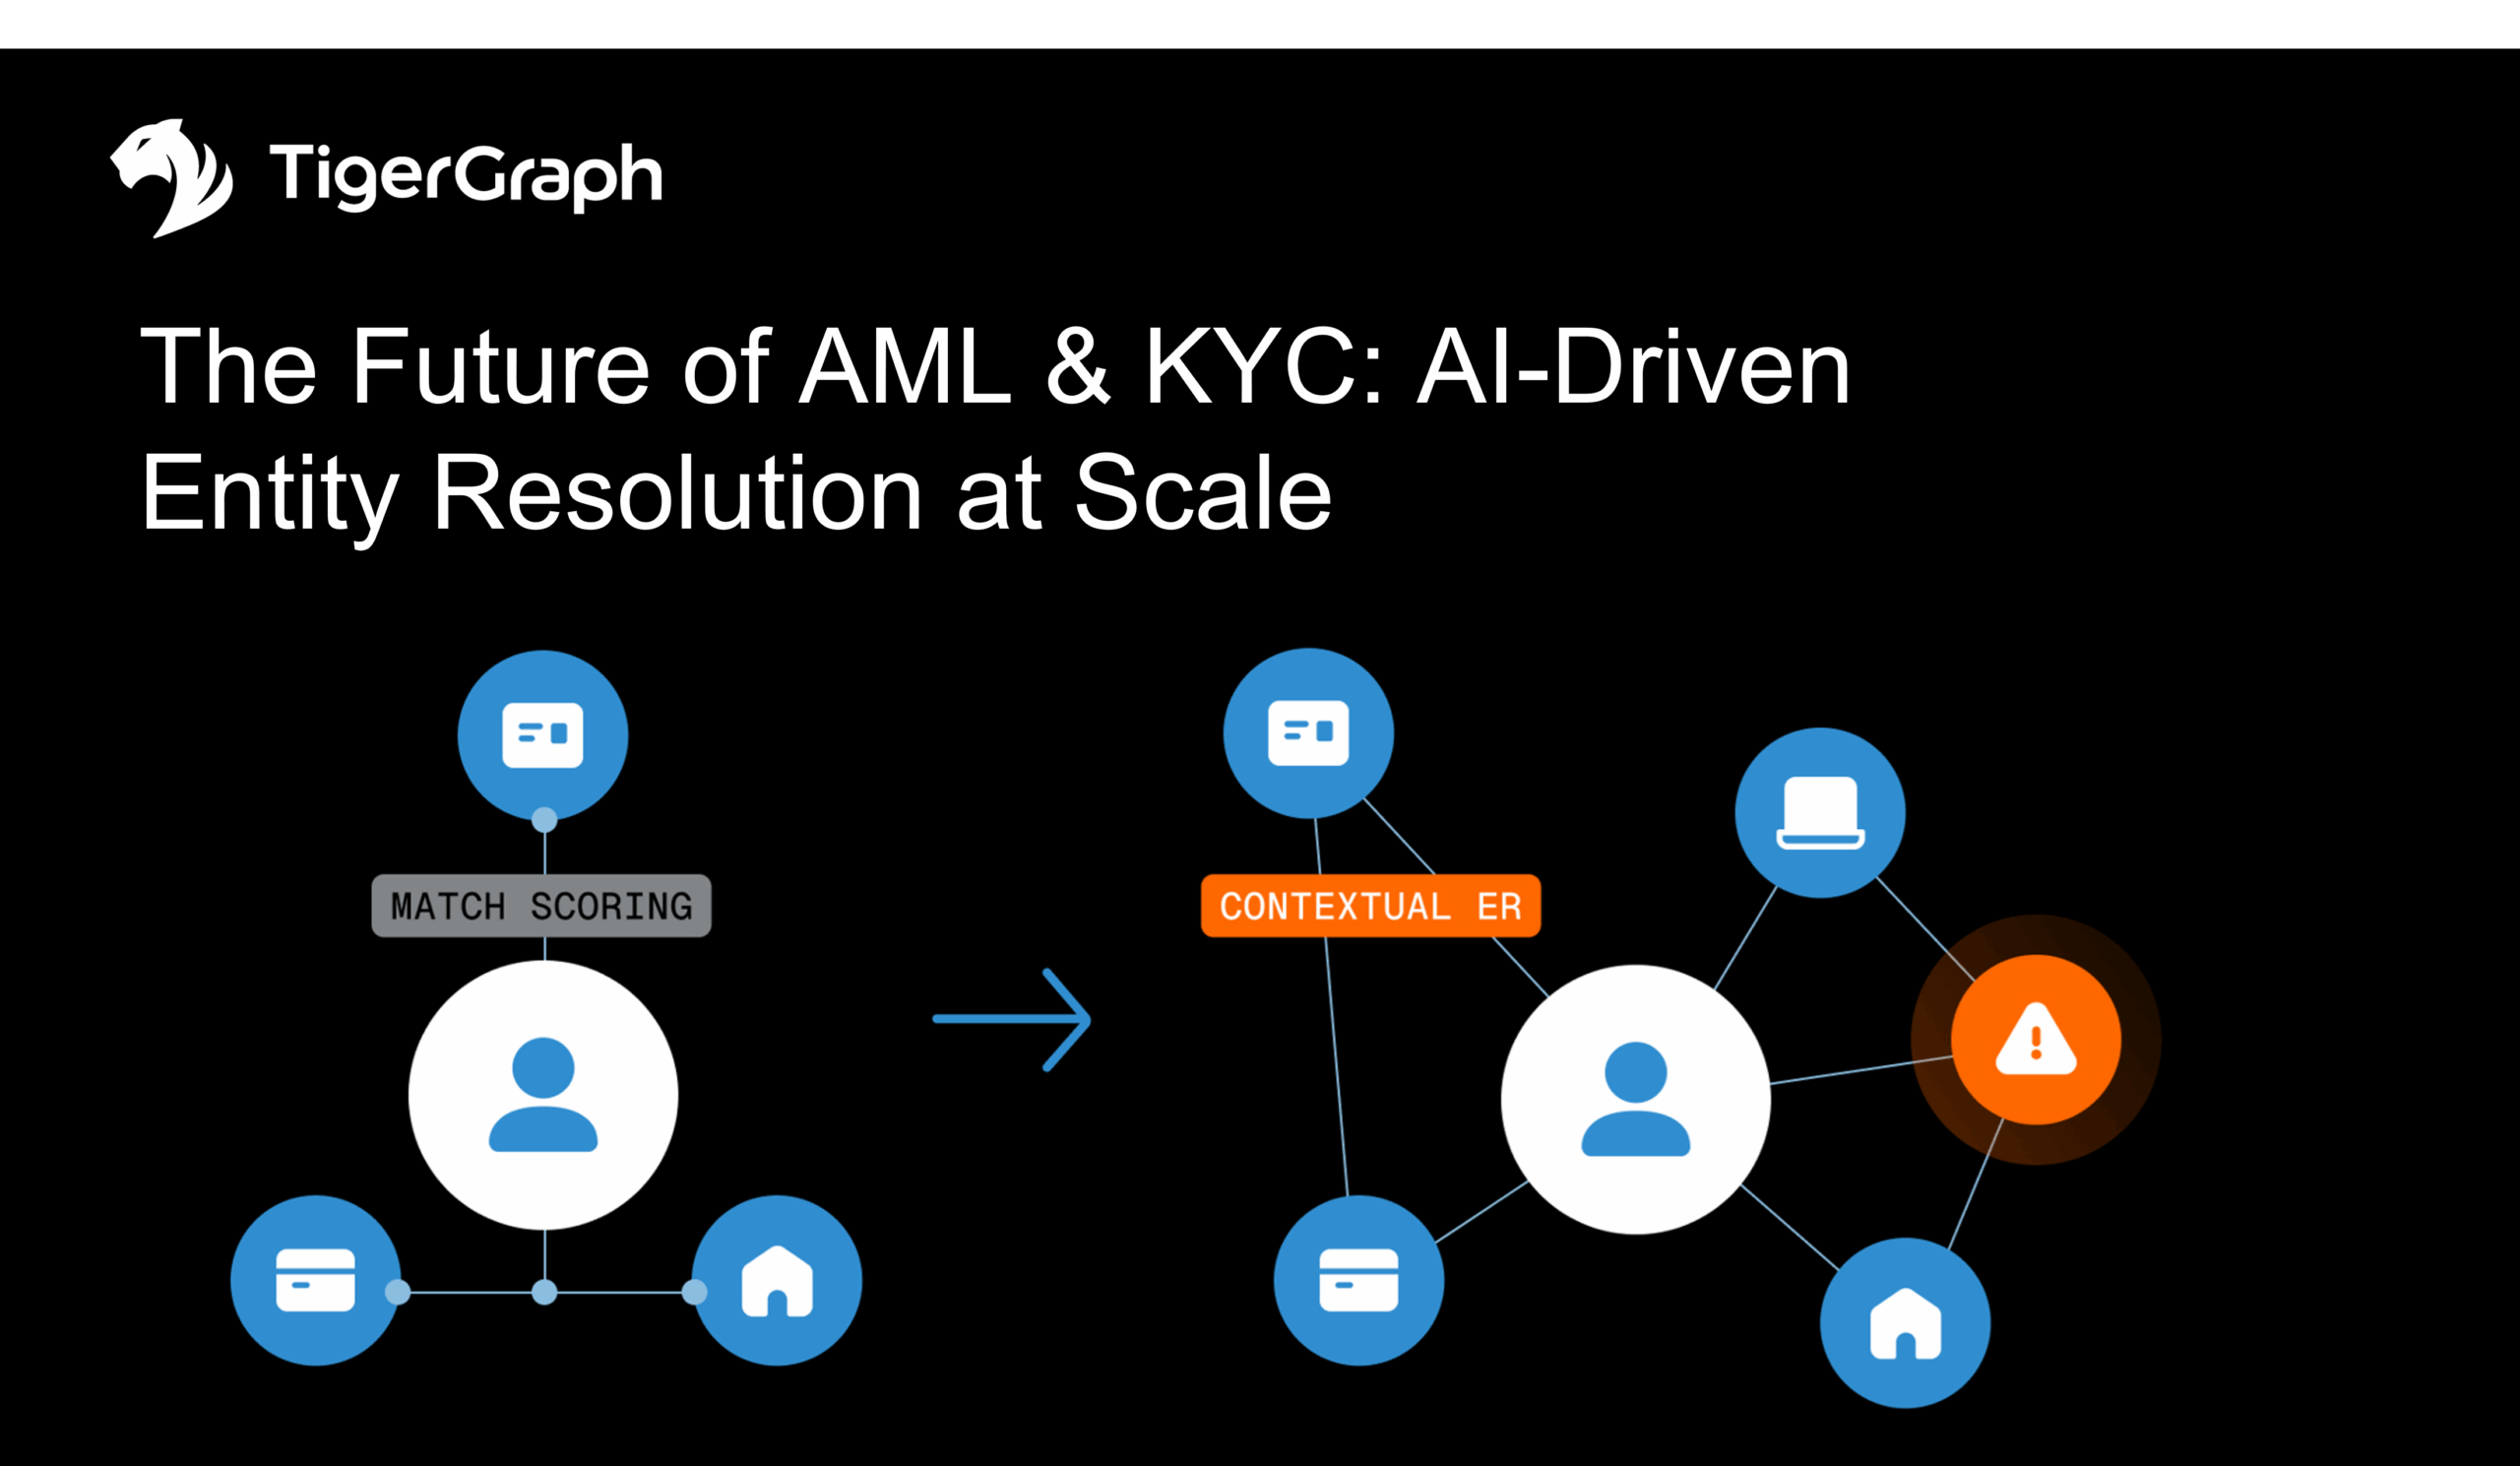
A presentation slide from TigerGraph titled The Future of AML & KYC: AI-Driven Entity Resolution at Scale features visuals comparing match scoring and AI-Driven Entity Resolution for AML KYC, with connected user and device icons.
The Future of AML & KYC: AI-Driven Entity Resolution at Scale
Discover
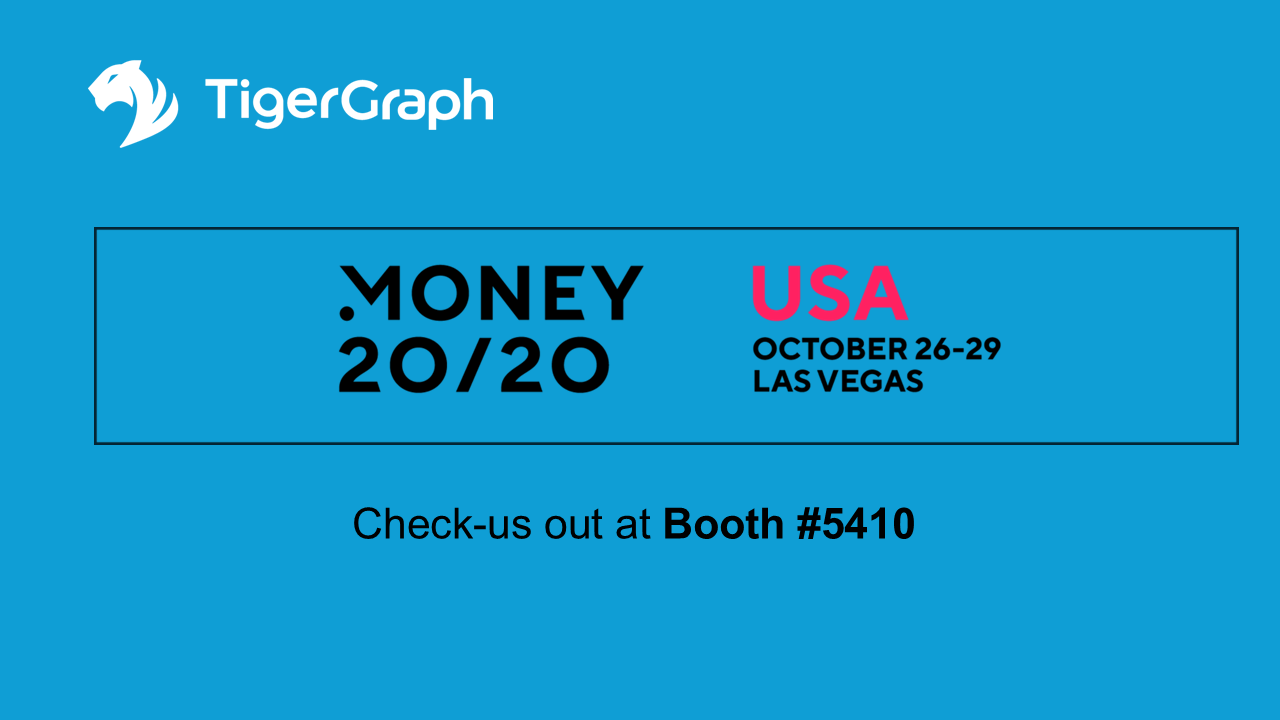
Blue promotional image with TigerGraph logo, announcing Money 20/20 USA event in Las Vegas, October 26-29. Text invites viewers to check them out at Booth #5410.
Money 20/20
Discover
AI-powered graph intelligence for fraud defense
The New Era of Fraud Defense: Real-Time Detection with AI-Powered Graph Intelligence
Discover
A black background with orange and white dots connected by lines. Text reads: Turning Data into Intelligence: How Knowledge Graphs Power Modern Banking and Customer 360. TigerGraph logo in the top left corner.
Turning Data into Intelligence: How Knowledge Graphs Power Modern Banking and Customer 360
Discover
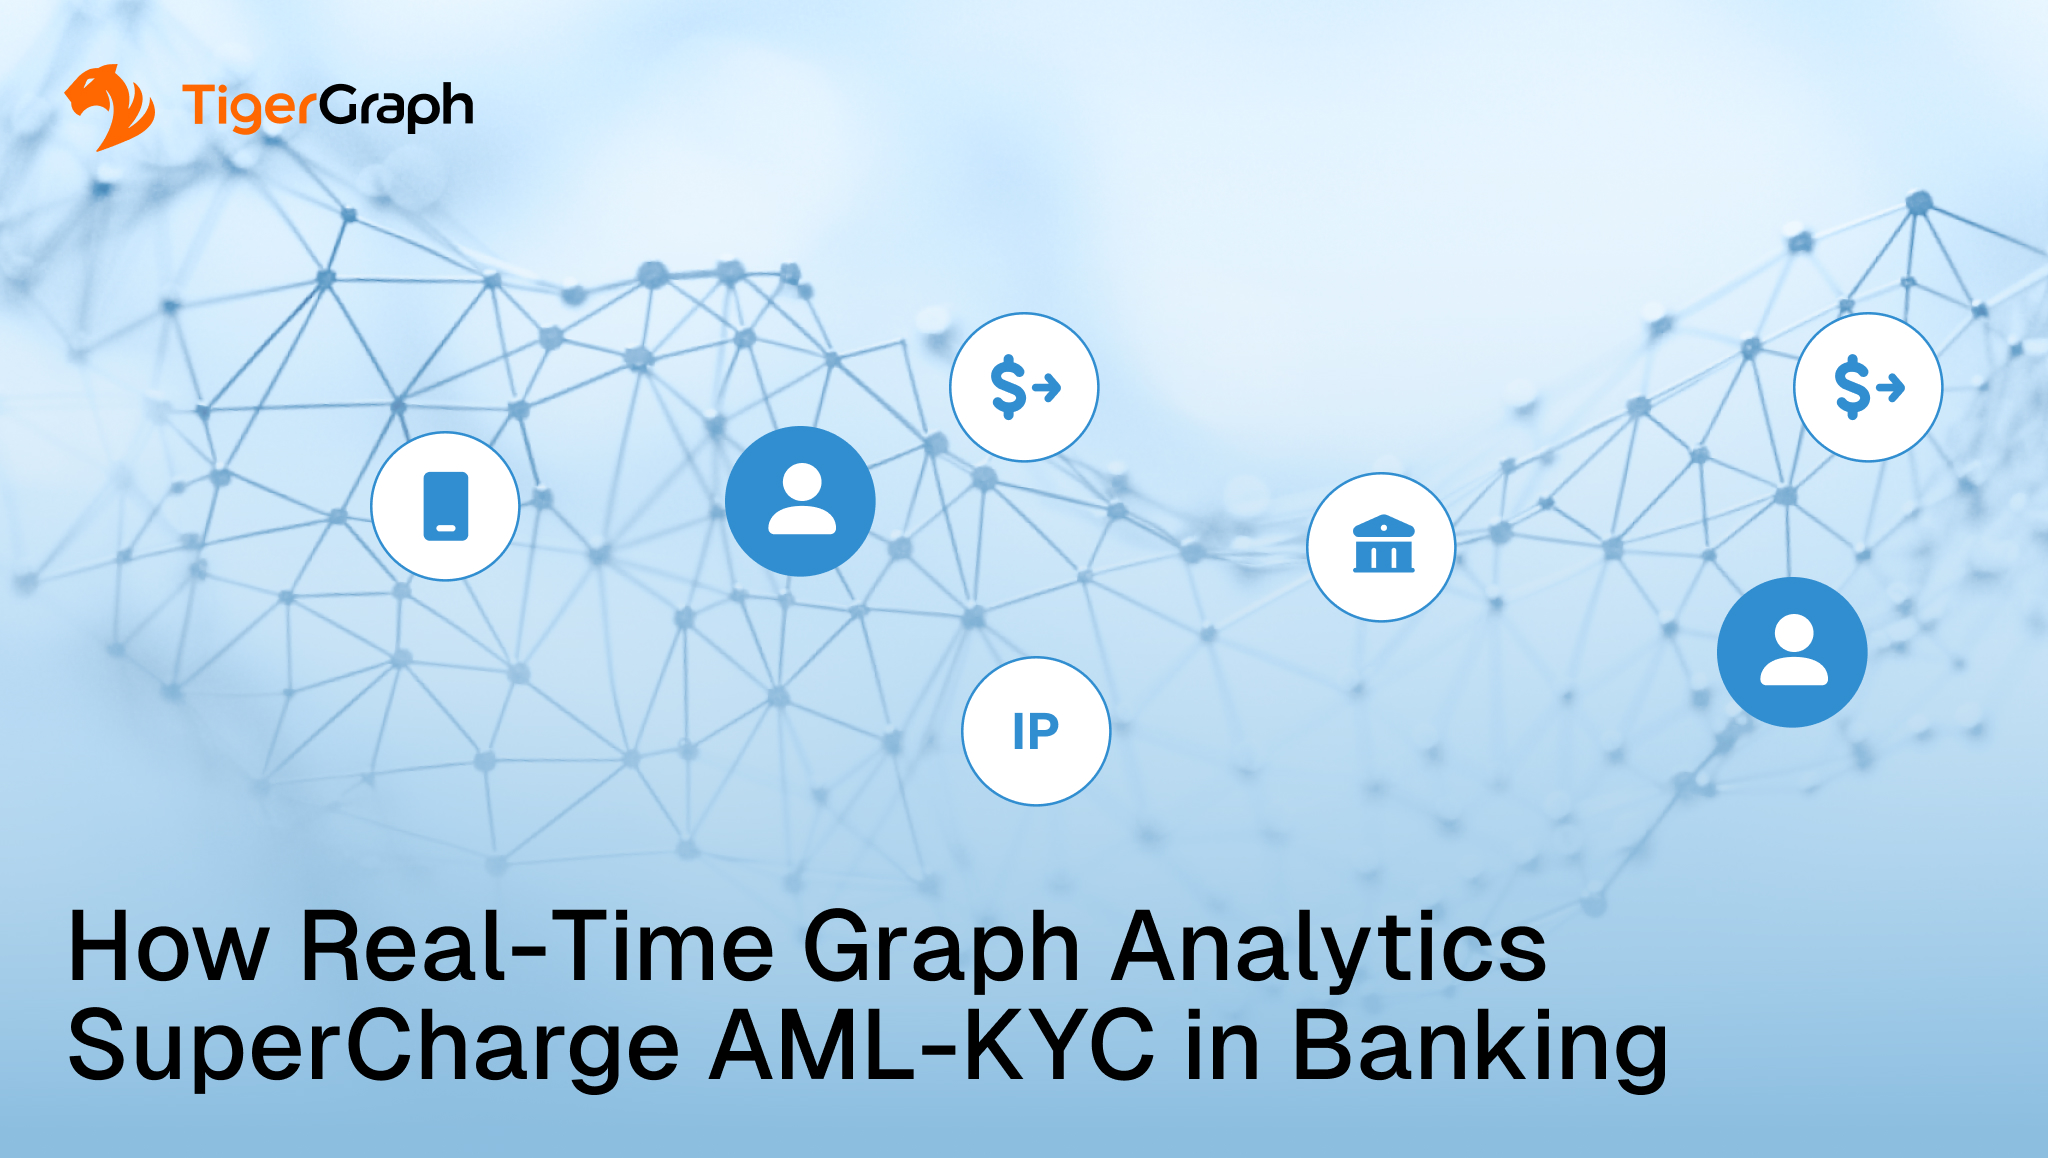
A network graphic with icons for user, dollar sign, bank, and IP address linked together, featuring the TigerGraph logo and the headline: How real-time graph analytics supercharge AML KYC efforts in banking.
How Real-Time Graph Analytics Supercharge AML/KYC in Banking
Discover
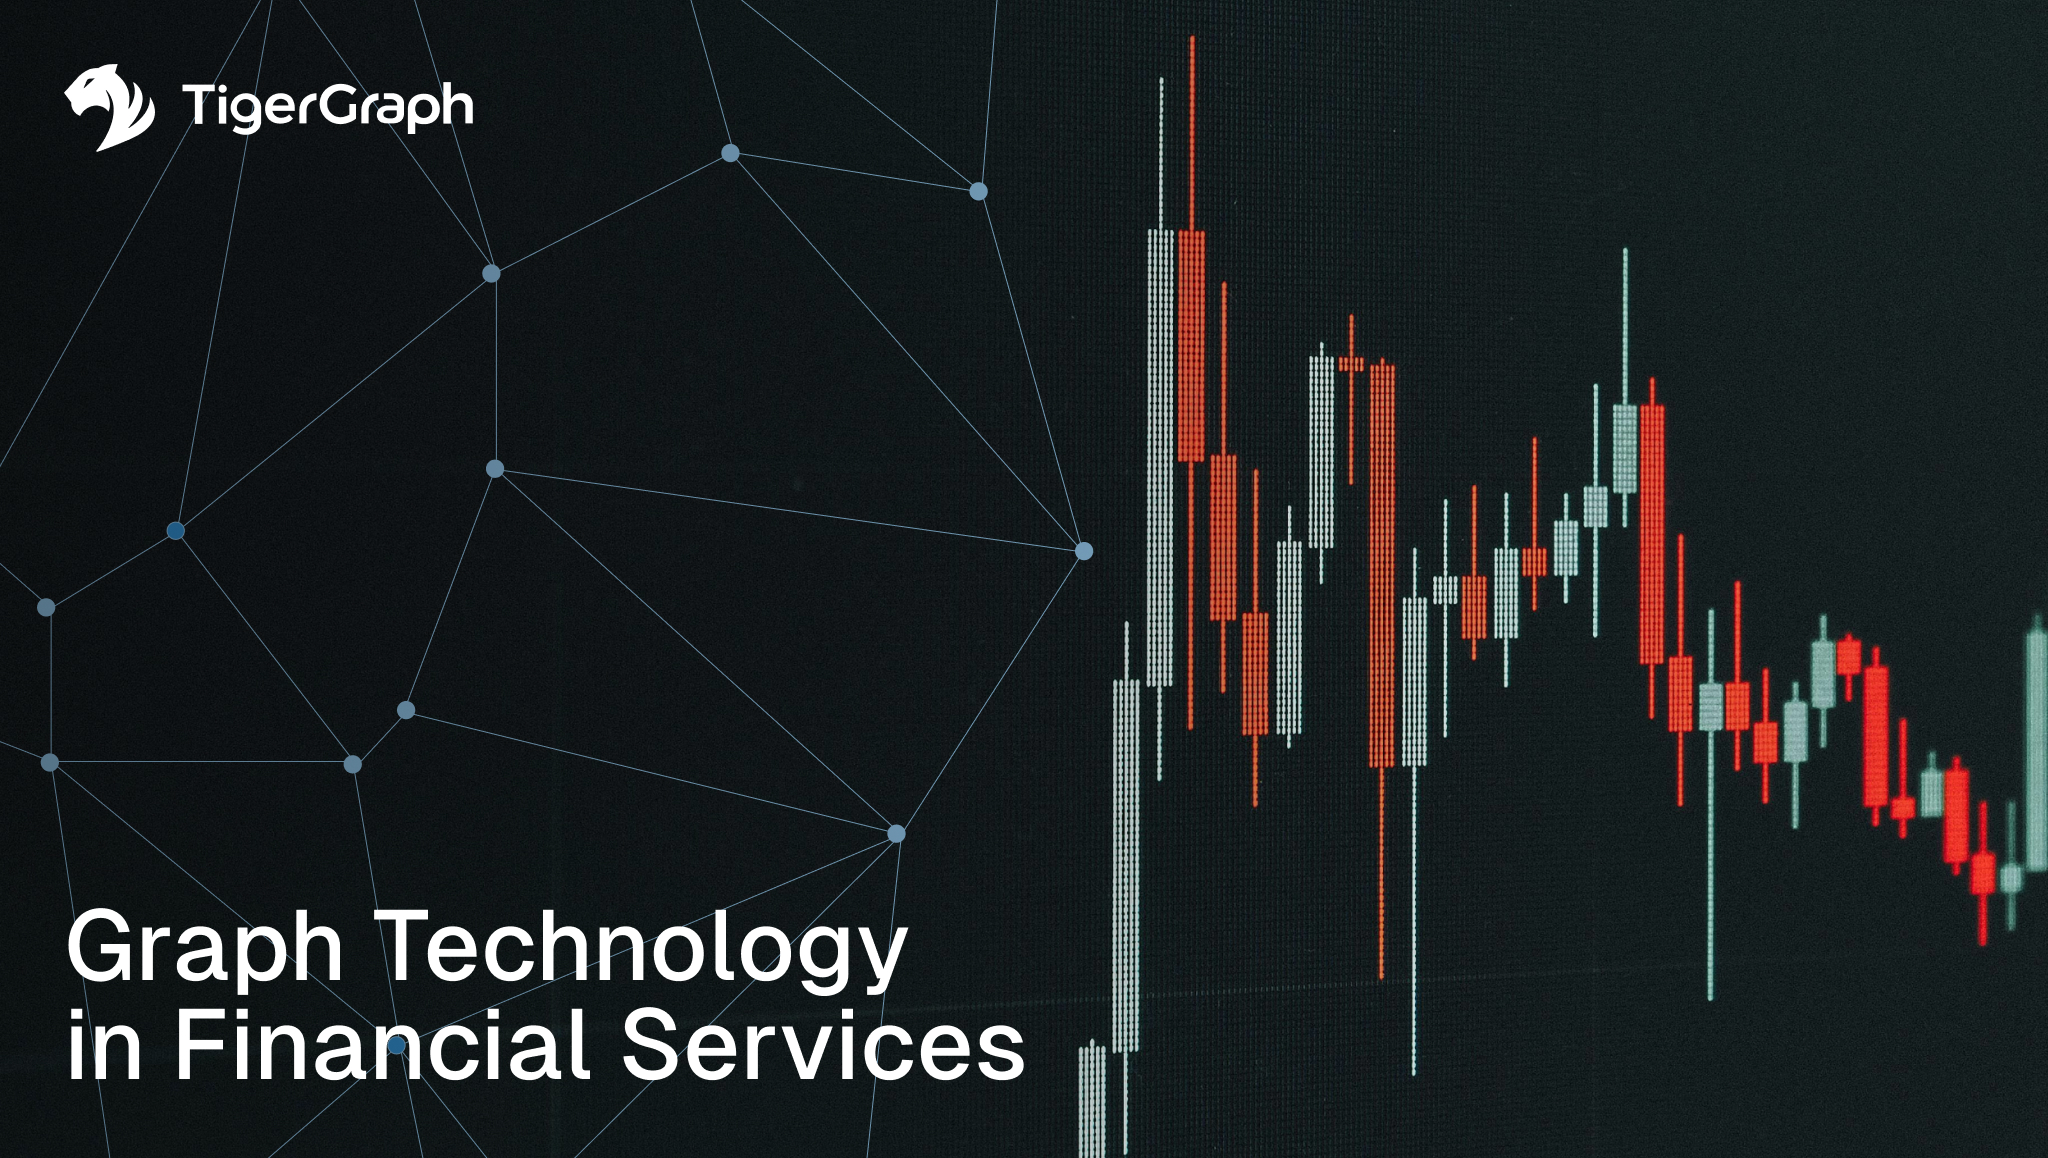
A candlestick stock chart appears alongside connected nodes on a dark background, illustrating the power of graph technology in financial services. The text reads Graph Technology in Financial Services with the TigerGraph logo in the top left corner.
Graph Technology in Financial Services
Discover
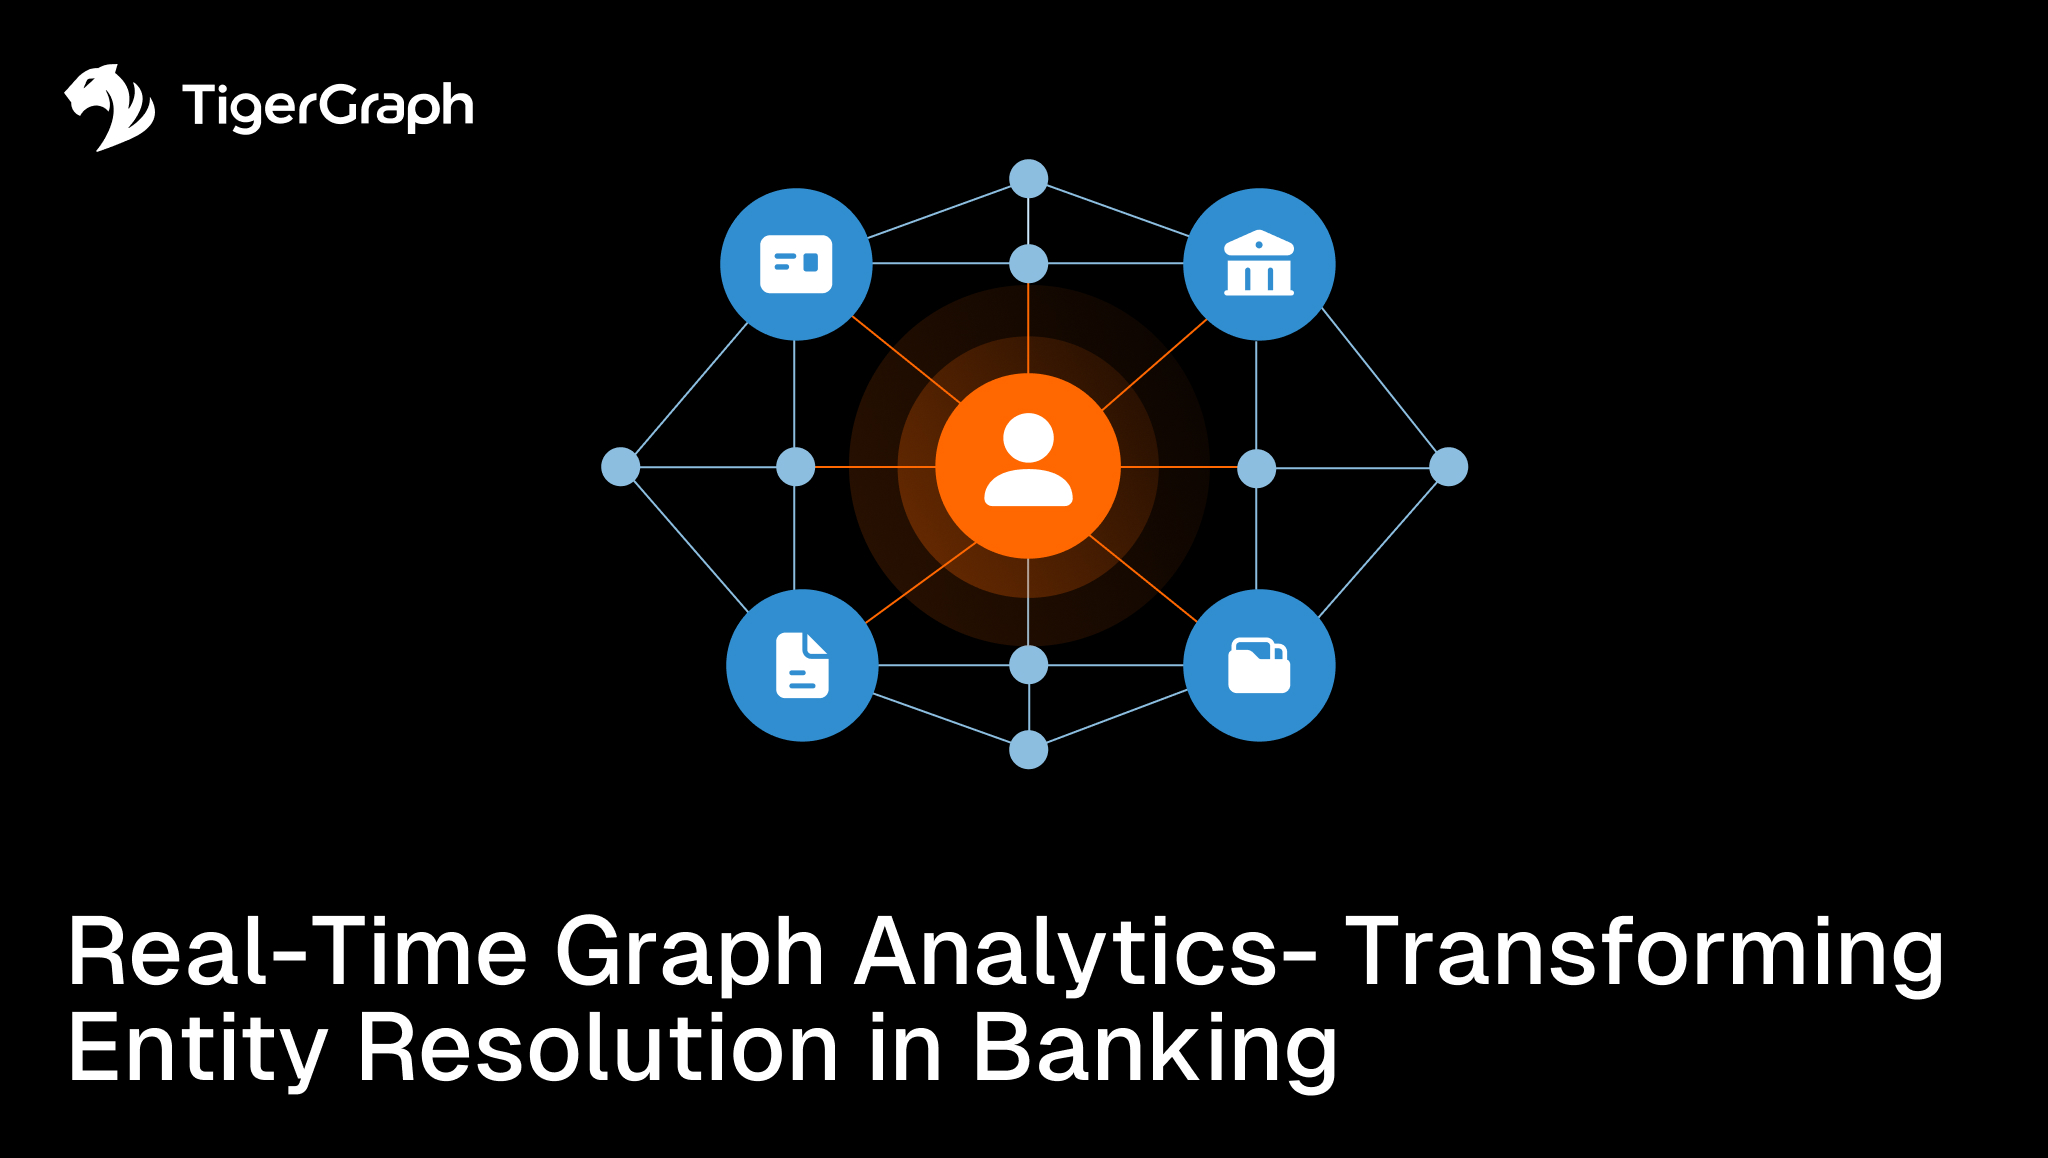
A central user icon connects by lines to banking and document icons, illustrating real-time graph analytics for entity resolution. TigerGraph logo and text read: Real-Time Graph Analytics - Transforming Entity Resolution in Banking.
Real-time Graph Analytics: Transforming Entity Resolution in Banking
Discover
TigerGraph logo, a web of connected nodes with icons for security, money, and fraud, alongside the text: Real-Time Graph Analytics Fraud Detection - Transforming Banking.
Real-Time Graph Analytics: Transforming Fraud Detection in Banking
Discover
TigerGraph logo in the top left. Text reads: Know Every Customer Resolve Every Identity The Graph-Powered Future of Entity Resolution, with some words in orange and others in white on a black background.
Know Every Customer. Resolve Every Identity. The Graph-Powered Future of Entity Resolution
Discover
A hand points to a colorful digital graph with interconnected dots and lines. Overlaid text reads, Fraud Detection at Scale: Why Enterprises Need a Powerful Graph Database.
Fraud Detection at Scale – Why Enterprises Need a Powerful Graph Database
Discover
Panelists for Data Strategy & Leadership track, with photos and titles: Michael Baker (NielsenIQ), Ivana Donevska (BMO), Deepak Konale (Former Northern Trust), Suma Nair (JPMorganChase), and moderator Rajev Shrivastava (TigerGraph).
CDO Mgz Chicago Leadership Summit
Discover
A network diagram with interconnected icons representing people, a credit card, devices, and risks, illustrating hidden fraud networks. Text: Stopping Financial Crime in Real Time: How Graph Analytics Unmasks Hidden Fraud Networks. TigerGraph logo.
Stopping Financial Crime in Real Time: How Graph Analytics Unmasks Hidden Fraud Networks
Discover
An orange slide with the TigerGraph logo and text: “Connecting the Dots: Leveraging Graph Databases for Advanced Entity Resolution and Identity Management,” next to a network graphic of connected dots and lines.
Connecting the Dots: Leveraging Graph Databases for Advanced Entity Resolution and Identity Management
Discover
A soft gradient background transitioning from pale blue at the bottom to white at the top. The image is abstract and conveys a serene and calm atmosphere.
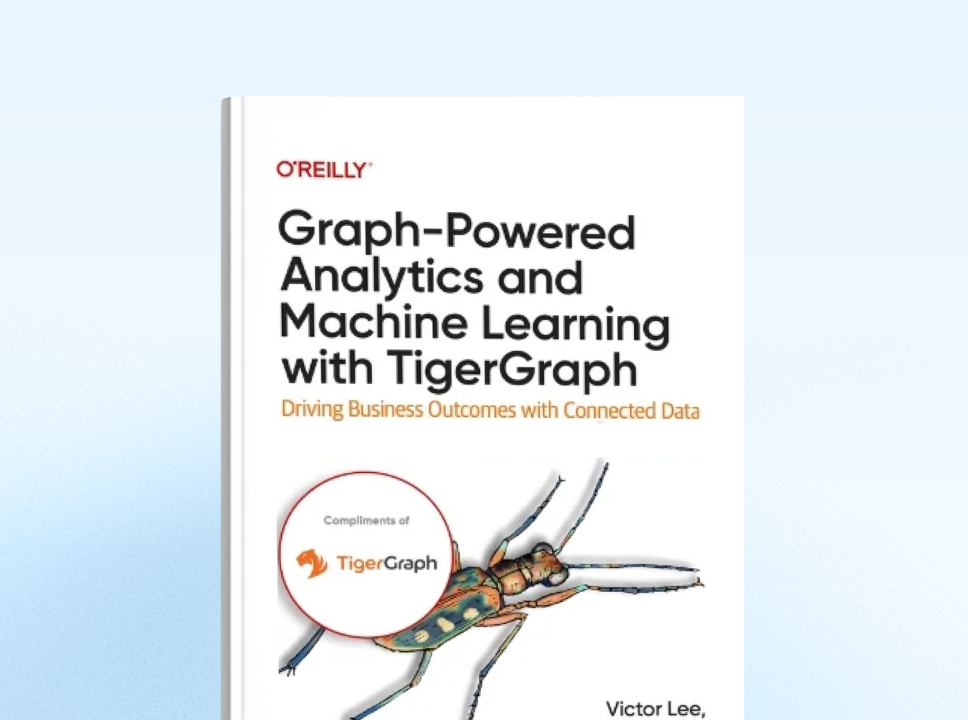
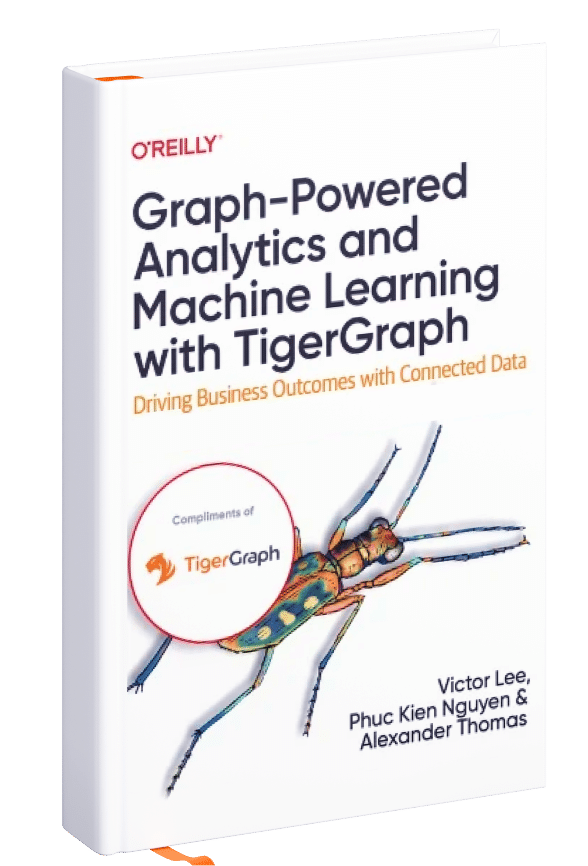
Cover of a book titled Graph-Powered Analytics and Machine Learning with TigerGraph by Victor Lee, Phuc Kien Nguyen, and Alexander Thomas. The cover features an illustrated insect and an OReilly logo.

Graph-Powered Analytics And Machine Learning with TigerGraph

A practical guide that shows data scientists, data engineers, architects, and business analysts how to get started with a graph database using TigerGraph, one of the leading graph database models available.

Cover of a book titled Graph-Powered Analytics and Machine Learning with TigerGraph by Victor Lee, Phuc Kien Nguyen, and Alexander Thomas. The cover features an illustrated insect and an OReilly logo.
Download O’Reilly Book
Smiling person with shoulder-length dark hair and glasses, wearing an orange shirt, inside an orange circle frame with a light gray background.
TigerGraph logo

Ready to Harness the Power of Connected Data?

Start your journey with TigerGraph today!

Request a Demo
Show More
A man with glasses and curly hair is looking thoughtfully to the side. He is wearing a plaid shirt and stands against a plain light gray wall with soft shadows.

Ready to Harness the Power of Connected Data?

Start your journey with TigerGraph today!