How to Supercharge Fraud Detection with Graph Models
Fraud is a network problem. It rarely appears as one obviously suspicious transaction. More often, it unfolds over time as a sequence of actions across multiple accounts, devices, and payment instruments.
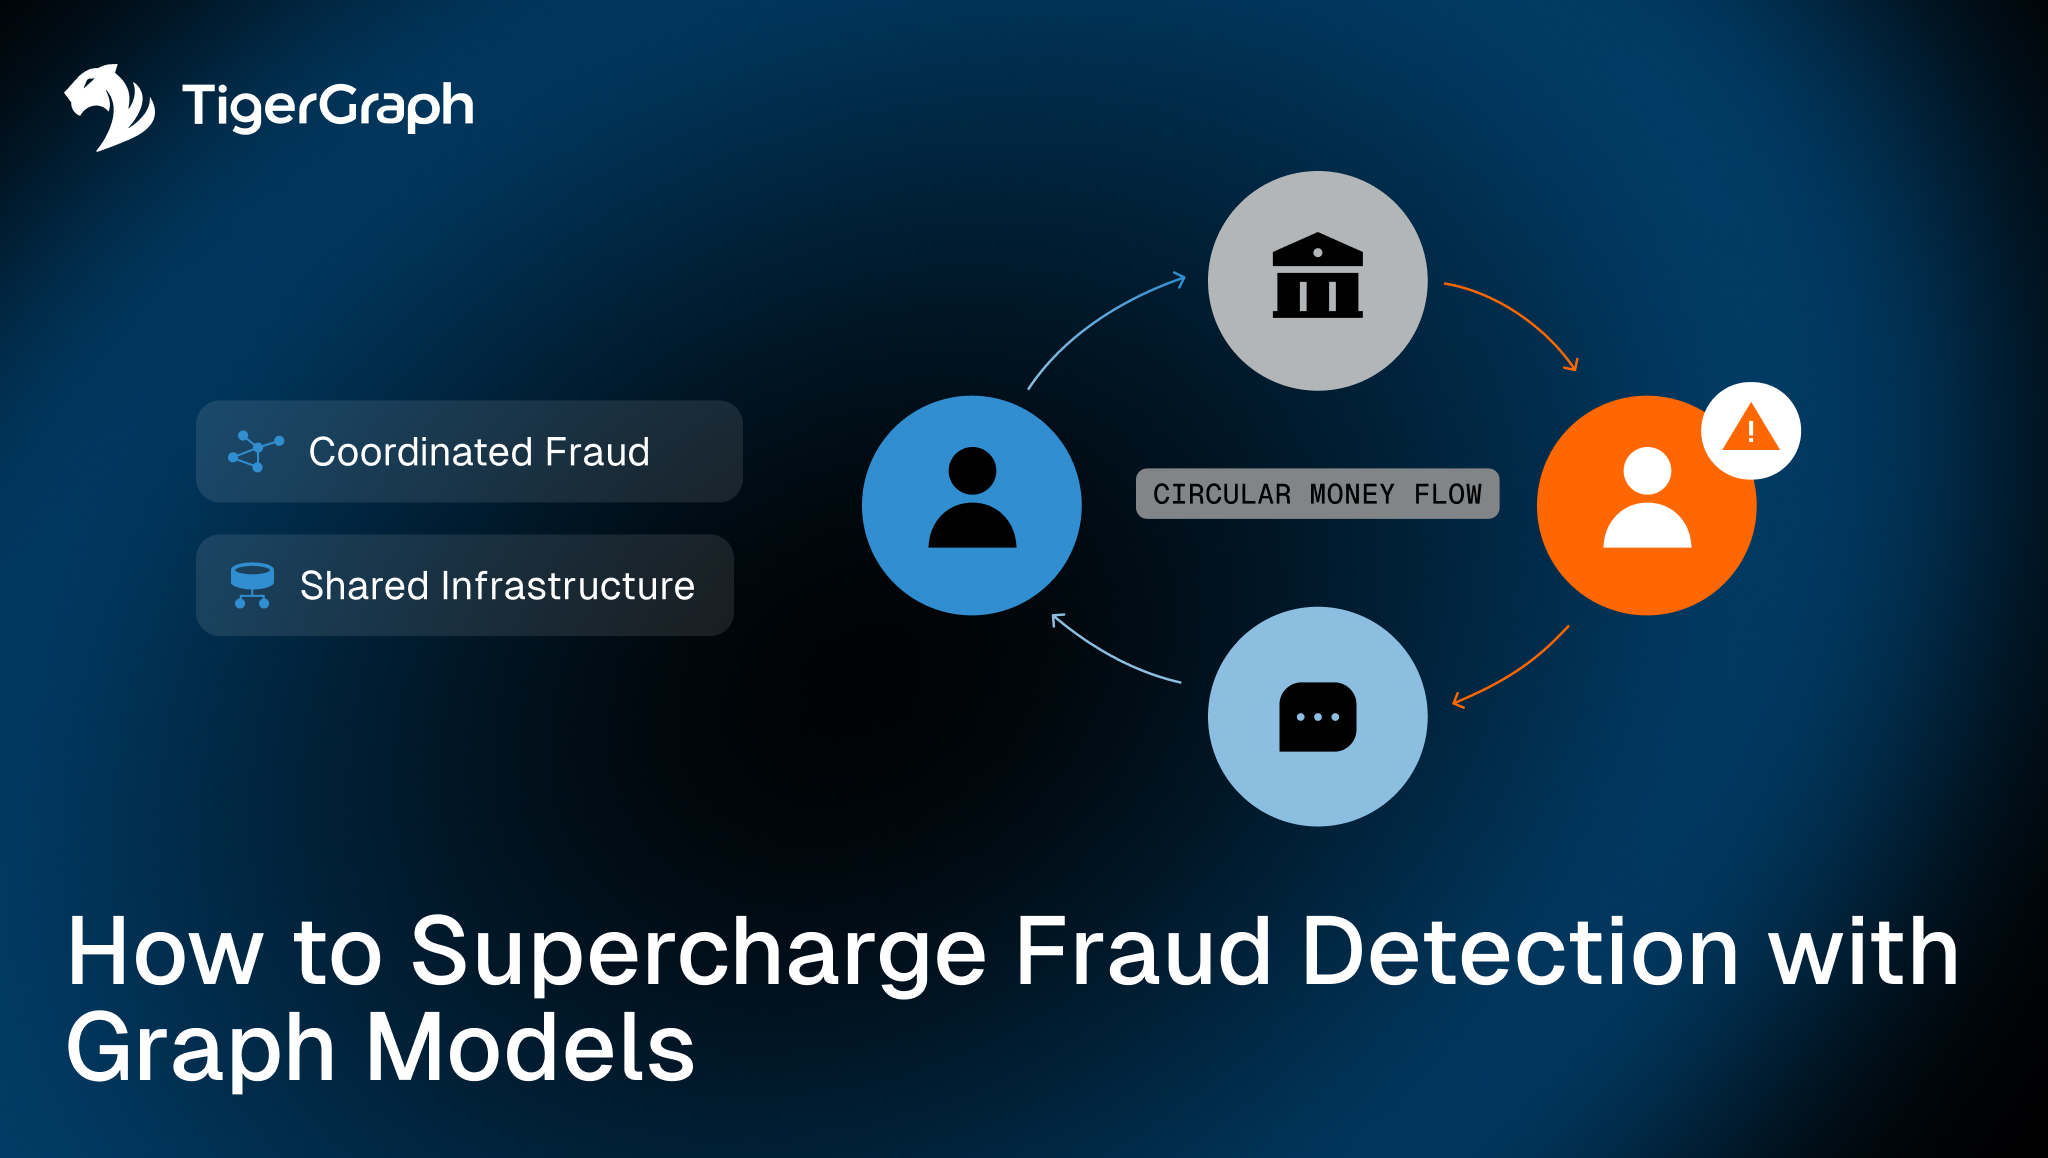
Funds move in loops, within accounts that share infrastructure. Money is layered through intermediaries and the overall activity is fragmented to avoid triggering simple rules. The challenge is not identifying a single outlier. It is recognizing a coordinated pattern embedded inside legitimate activity.
That is a structural problem. And structure is what graph models are designed to capture.
Key Takeaways
- Fraud is typically a coordinated pattern across accounts, devices, and transactions, not a single anomalous event.
- Traditional transaction monitoring struggles to detect multi-step, multi-entity schemes.
- Graph models expose circular flows, mule networks, shared infrastructure, and layered transfers.
- Graph feature engineering enriches machine learning models with structural signals.
- Graph neural networks incorporate neighborhood structure directly into prediction.
- Structural detection reduces blind spots that rule-based or row-based systems miss.
Fraud is a Pattern, Not a Row
Financial institutions typically monitor fraud in two major areas: identity verification and transaction activity.
Transaction monitoring systems flag unusual payments, changes in velocity, or threshold breaches. Analysts then begin with a suspicious entity and expand outward to review related activity.
In a traditional tabular database, data is stored in separate tables. Customer information lives in one table. Transactions live in another. Device data may live somewhere else. To analyze how those entities relate, the system must perform a “join.” A join is the operation that links rows from different tables based on a shared field, such as a customer ID or device token.
That works for simple relationships.
But as investigations deepen, each additional connection requires another join. If an analyst wants to move from a customer to their device, then from that device to other customers, and then to those customers’ transactions, each step adds more joins. Queries grow longer, harder to maintain, and more computationally expensive.
Fraudsters exploit that friction.
They distribute transactions across multiple users. They reuse devices across accounts. They route funds through intermediaries and recycle money back to the origin. The deeper the pattern, the more complex the query needed to uncover it.
In a relational database, these behaviors appear as separate rows scattered across multiple tables.
But in a graph model, they appear as connected structures that can be followed step by step, or “traversed.”
Modeling Financial Crime as a Network
When transactions are modeled as a graph, entities such as users, transactions, devices, and payment instruments become nodes. Their interactions become relationships.
Instead of asking, “Is this transaction unusual?” we can ask:
- Is this user part of a circular flow of funds?
- Are multiple accounts operating from the same device?
- Is money returning to its origin within a short time window?
- Do several accounts share infrastructure previously linked to chargebacks?
Consider a circular money flow where a user sends funds to another account and that account forwards the funds onward. After several steps, the money returns to the original sender. The amounts are similar and the timing is tight.
In a dashboard, this appears as several ordinary transfers. In a graph, it appears as a loop. That difference matters.
Graph “traversal” allows investigators to follow multi-step paths across accounts and time, reconstructing the sequence of activity exactly as it occurred. Fraud becomes a network investigation rather than a transaction review.
Moving Beyond Fraud System Rules
Many fraud systems begin with rules.
- If a transaction exceeds a certain amount, flag it.
- If too many payments occur in a short window, trigger an alert.
- If an account interacts with a known high-risk entity, escalate it.
Rules work well for patterns we already understand. But fraud tactics evolve. Once criminals learn the thresholds, they adjust their behavior to avoid triggering them.
Machine learning adds adaptability and helps spot behaviors that traditional rules miss. Instead of relying only on fixed thresholds, models learn from historical fraud cases. They detect combinations of signals that humans may not have explicitly defined. A transaction might look ordinary on its own, but unusual when evaluated alongside dozens of other attributes.
Graph strengthens this approach in two important ways.
1. It generates structural features. These are signals derived from how an account behaves within a network, not just what it does individually. For example, how many other accounts connect to it? How close is it to previously identified fraud? Does it sit at the center of a dense cluster?
2. Graph allows models to incorporate relational structure directly. Rather than treating each account as an isolated record, the model can learn from its neighborhood and connections.
This combination moves fraud detection beyond static rules toward adaptive, structure-aware detection.
Graph Feature Engineering
One of the most practical advantages of graph modeling is the ability to create better inputs for machine learning. Instead of feeding a model only raw transaction details, such as amount, time, and location, graph modeling allows us to generate features based on how an account behaves within the network.
For example, we can calculate:
- How many other accounts connect to this one
- How many transactions flow in and out
- Whether funds move repeatedly through the same group of accounts
- How close this account is to previously confirmed fraud cases
- Whether the account sits at the center of a dense cluster
These are not attributes stored in a single transaction record. They describe position and behavior within the broader system.
That added context changes how a model evaluates risk. Instead of judging an account only by what it did, the model can evaluate where it sits and how it interacts with others. That often leads to stronger signals and fewer blind spots.
Feature engineering strengthens traditional models, and graph neural networks go a step further.
Graph Neural Networks
Traditional models treat each account as an independent data point. They look at rows of attributes and try to classify them. Graph neural networks treat each account as part of a neighborhood.
If a cluster of connected accounts exhibits suspicious behavior, that pattern influences predictions for nearby accounts. The model learns not only from individual attributes, but from how behavior spreads across connections.
In coordinated fraud scenarios, this matters. Fraud typically propagates through shared devices, mule accounts, intermediaries and recycled funds. Models that incorporate neighborhood structure are better positioned to detect those coordinated patterns.
The underlying logic is simple:
- Fraud spreads through connections.
- Models that understand connections detect it more effectively.
Graph strengthens fraud detection in three clear and practical ways.
1. It Exposes Coordinated Patterns
Graph models allow investigators to follow connections step by step. Instead of seeing separate transactions, they see the full flow of activity.
- Circular money movement.
- Clusters of mule accounts.
- Multiple users operating from the same infrastructure.
These coordinated patterns are difficult to uncover when transactions are treated as independent rows. Graph makes them visible because it models how entities are connected.
2. It Adds Network Context to Machine Learning
Machine learning models are only as strong as the signals they receive. Graph modeling generates additional signals based on how an account behaves within the network. For example:
- How many other accounts connect to it
- Whether it sits at the center of a dense cluster
- How close it is to previously confirmed fraud
These signals describe position and influence, not just transaction details. When added to traditional models, they provide context that simple attributes cannot capture.
The model no longer evaluates activity in isolation. It evaluates behavior within a connected system.
3. It Allows Models to Learn from Relationships
Graph neural networks go a step further by incorporating connections directly into prediction.
Instead of analyzing each account independently, the model learns from neighborhoods. If a group of connected accounts shows suspicious behavior, that structural signal influences predictions across the cluster.
This is especially powerful in coordinated fraud scenarios, where the risk is not confined to one account but spreads across many. Fraudsters operate in networks, so effective detection systems must do the same.
Contact TigerGraph
If your organization is working to detect coordinated fraud, reduce false positives, or strengthen transaction monitoring with structural insight, graph analytics provides the foundation.
Contact TigerGraph to explore how connected data modeling and graph-enhanced machine learning can strengthen your fraud detection strategy.
Frequently Asked Questions
1. Why is Fraud Detection More Effective When Modeled as a Network Instead of Individual Transactions?
Fraud detection is more effective as a network because coordinated schemes span multiple accounts, devices, and transactions, which cannot be fully detected when analyzed in isolation.
2. How do Graph Models Uncover Hidden Fraud Patterns That Traditional Systems Miss?
Graph models uncover hidden patterns by connecting entities and revealing multi-step relationships such as circular flows, shared infrastructure, and coordinated activity.
3. What Makes Multi-Step Fraud Schemes Difficult to Detect With Traditional Databases?
Multi-step schemes are difficult to detect because they require complex joins across multiple tables, making it hard to trace connections and reconstruct full activity patterns.
4. How does Network Context Improve Fraud Detection Accuracy and Reduce False Positives?
Network context improves accuracy by evaluating how entities interact within a system, helping distinguish legitimate activity from coordinated fraud patterns.
5. What Types of Fraud Signals Become Visible When Relationships are Modeled Explicitly?
When relationships are modeled, signals such as circular money flows, shared devices, mule networks, and clustered behavior become visible and measurable.