
Summary
- Traditional supply chain analytics operate in silos and model only direct (Tier-1) supplier relationships, leaving organizations blind to disruptions at Tier-2, Tier-3, and beyond until the impact has already reached production.
- Graph databases model suppliers, facilities, shipments, logistics providers, and products as an explicit connected network, enabling organizations to trace how a disruption at any node propagates across the entire supply chain in real time.
- Four graph analytics patterns address the core supply chain risk scenarios: Tier-N impact analysis, shared dependency detection, alternative route identification, and predictive risk scoring from graph-derived ML features.
- TigerGraph’s supply chain analytics solution combines deep multi-tier link queries, real-time event impact notifications, ML feature generation for supplier risk scoring, and agentic AI that proposes and explains mitigation strategies before disruptions cascade.
Supply chains rarely fail all at once. Every major disruption begins as a small signal somewhere in a complex, multi-tier network: a supplier showing signs of financial distress, congestion at a major port, a transportation delay, or a sudden drop in manufacturing capacity.
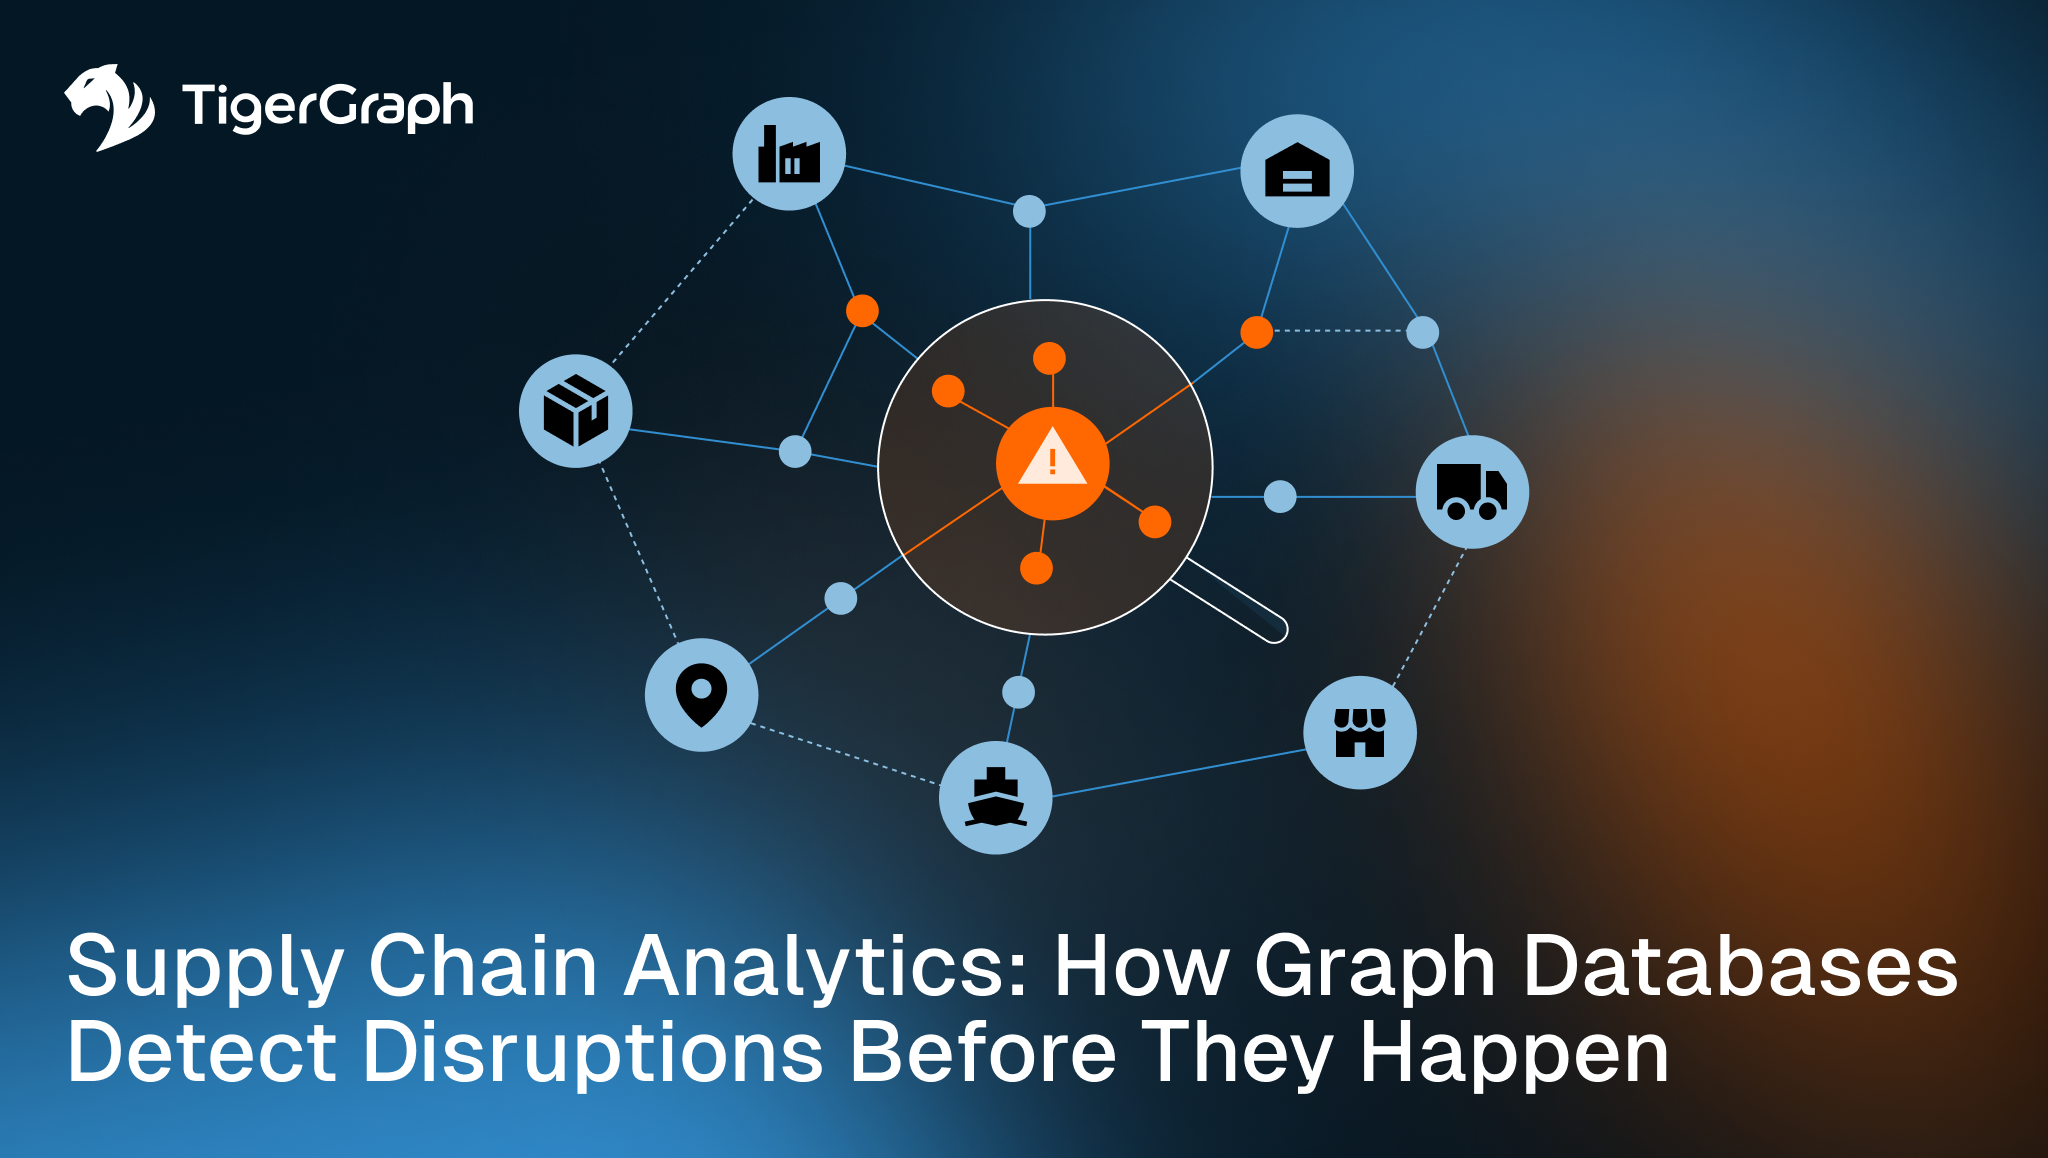
The problem is structural. Traditional supply chain analytics report on direct relationships, so organizations can answer “Who are my direct suppliers?” but not “Which products, facilities, and customers will be affected if a Tier-3 supplier fails?” Graph databases answer that second question by modeling the entire supplier network as connected data and tracing dependencies in real time before disruptions reach critical operations.
You’ll learn:
- Why supply chain disruptions are fundamentally a graph problem that relational databases cannot solve
- How four graph analytics patterns (Tier-N impact analysis, shared dependency detection, alternative route identification, and predictive risk scoring) transform disruption response
- How TigerGraph’s agentic supply chain AI reasons over connected network data to propose and explain mitigation strategies
- What Jaguar Land Rover and other enterprise customers have achieved with graph-powered supply chain intelligence
Why Supply Chains Are a Graph Problem
Modern supply chains are not linear workflows. They are complex networks of interconnected suppliers, manufacturers, logistics providers, ports, warehouses, distribution centers, and customers.
Every organization depends on hundreds or thousands of relationships that span multiple tiers, creating dependencies that cannot be accurately represented in rows and columns alone. This makes many of the most important supply chain analytics problems fundamentally graph problems rather than purely relational or tabular ones.
A disruption at a Tier-4 supplier, for example, can propagate through Tier-3 and Tier-2 suppliers before ultimately affecting Tier-1 production within days, depending on inventory buffers, lead times, and transportation routes. Although these dependencies exist in operational systems, they are often spread across ERP, procurement, logistics, and inventory applications that operate in isolation, making the full network invisible to any single reporting tool.
What Supply Chain Analytics Looks Like Without a Graph
Most enterprises manage procurement, logistics, inventory, and risk in separate silos, with multi-tier supplier relationships mapped manually in spreadsheets and updated quarterly if at all. The result is a system that only reacts: teams learn about a shortage when a Tier-1 supplier calls to report it.
Visibility is also capped at two tiers. Tier-3 and beyond are invisible, so a question like “If this carrier loses port capacity at Rotterdam, which product lines are at risk and by how much?” has no answer. Risk assessments are point-in-time snapshots, not live signals.
Traditional vs. Graph-Powered Supply Chain Analytics
The table below summarizes where each approach delivers and where it breaks down. The difference is not simply speed or scale; it is the ability to reason across connected dependencies rather than isolated operational records.
| Traditional Analytics | Graph-Powered Analytics | |
| Supplier visibility depth | Tier-1 only | Full multi-tier (Tier-1 through Tier-N) |
| Query type | Direct relationships, pre-joined reports | Real-time multi-step dependency analysis |
| Disruption detection | Reactive: after Tier-1 reports a shortage | Proactive: traces impact as an event enters any network node |
| Data freshness | Periodic batch snapshots | Live queries against connected operational data |
| Explainability | Reports what happened | Traces which entities, relationships, and events drove the outcome |
| AI/ML readiness | Aggregated features from flat data | Graph-derived features: network centrality, shared dependency count, disruption proximity |
The core gap is visibility depth. Traditional tools answer questions about the suppliers you can already see. Graph databases answer questions about the suppliers that can already see you coming.
Four Graph Analytics Patterns for Supply Chain Risk
The following patterns show how a connected supply chain database moves teams from point-in-time reporting to live network intelligence.
Tier-N Impact Analysis
When a disruption event is detected (a supplier bankruptcy, a port closure, a carrier capacity drop), the graph runs a query that traces the event’s impact through N levels of the supply network to identify all affected products, facilities, and delivery timelines.
Unlike a spreadsheet lookup, the query automatically follows relationship paths across the entire network. The output is a ranked list of affected product lines and estimated exposure, delivered within seconds of the triggering event. This enables operations teams to prioritize response before the disruption reaches their production floor.
Shared Dependency Detection
Graph supply chain analytics identifies where multiple critical products share a common supplier, carrier, or port: single points of failure that may not be visible when each product’s supply chain is managed separately.
Graph queries surface all nodes that appear in the supply paths of multiple high-priority products, then flag concentration risks: “seven of our top-ten products depend on the same regional carrier.” This allows procurement teams to address structural risks before any disruption occurs.
Alternative Route Identification
When a primary supply route is disrupted, a query against the graph shows alternative supplier-carrier paths and scores them by available capacity, lead time, cost, and reliability history. This is possible because the graph already contains all known suppliers, carriers, and routes as connected data, so alternative paths are queryable immediately.
No manual research or RFQ delay is required. Graph-based systems surface ranked alternatives in the same interface where the disruption was detected. With TigerGraph, these queries run against live network data, not a stale snapshot, allowing teams to act on current findings rather than react after the incident is already filed.
Predictive Risk Signals
TigerGraph enables connected supply chain AI by generating ML features from graph structure to score supplier risk before a disruption event occurs.
This capability produces predictive analytics that reflect the richness of the graph structure, including supplier network centrality, relationship age, shared dependency count, and historical disruption proximity.
External signals (supplier financial data, news feeds, weather, geopolitical risk scores) can also be layered onto graph nodes to enrich predictions. Combined, these inputs produce a supplier risk score that flags emerging risk weeks before a disruption becomes visible to traditional monitoring.
Agentic Supply Chain Operations
Supply chain operations agents continuously monitor the supply network for early signals of disruption. They not only alert operators to emerging risks but also propose mitigation strategies based on the relationships and dependencies within the supply chain.
TigerGraph’s connected supply chain AI reasons across enterprise data in real time. The graph provides the operational context that grounds every recommendation, making agent decisions transparent and auditable. Rather than relying on black-box reasoning, analysts can trace the exact entities, relationships, and events that led to a recommendation.
For example, analysts can report to compliance and auditing: “This mitigation was proposed because Tier-3 supplier X showed financial stress, which affects four product lines with a combined revenue exposure and is connected to two manufacturing facilities through shared components.” This level of explainability builds trust in AI-assisted decision-making while accelerating incident response.
TigerGraph for Supply Chain Analytics
Beyond the four core patterns, TigerGraph adds two further capabilities:
- ML feature generation: graph-derived features (network centrality, shared dependency count, disruption proximity) power predictive supplier risk scoring for agentic AI workflows.
- TigerGraph Savanna: cloud-native deployment with independently scalable storage and compute for enterprise supply chain analytics at scale.
Jaguar Land Rover is among TigerGraph’s enterprise customers. Using TigerGraph, the company reduced supply chain analysis time from three weeks to 45 minutes, a result made possible by building a supply chain disruption detection graph and deploying agentic GraphRAG-based AI. Full details are available on the Jaguar Land Rover customer page.
Build a More Resilient Supply Chain with Connected Intelligence
Supply chain disruptions are inevitable, but operational surprise is not. The organizations that see disruptions earliest, across every tier of the supplier network and before they reach production, absorb significantly lower impact and recover faster. Graph databases provide the connected data infrastructure that makes multi-tier visibility and proactive disruption analysis possible.
Explore TigerGraph’s full supply chain analytics capabilities.
Ready to build a more resilient supply chain? Start with TigerGraph’s free tier or request a demo.
FAQs
What is supply chain analytics and why does it matter?
Supply chain analytics is the use of data and analytical tools to monitor, evaluate, and improve supply chain performance and risk. It matters because modern supply chains span dozens of supplier tiers, logistics providers, and distribution networks, and a disruption at any point can cascade into production delays, inventory shortages, and missed customer commitments. The organizations that detect disruptions earliest, before they reach Tier-1 production, sustain the lowest operational impact and recovery costs.
Why can’t relational databases handle multi-tier supply chain risk analysis?
Relational databases store supply chain data in separate tables for procurement, inventory, logistics, and risk, then join those tables at query time. That structure works for direct (Tier-1) relationships, but answering a question like “Which product lines are exposed if this Tier-4 component supplier fails?” requires joining across multiple tables for every tier in sequence. At enterprise scale and query complexity, those joins become too slow to support real-time operational decisions, and they cannot represent the full dependency chain as a connected structure.
How does a graph database detect supply chain disruptions before they reach production?
A graph database stores the entire supply network (suppliers at every tier, carriers, ports, facilities, products, contracts, and routes) as a connected structure. When a disruption event is detected at any node, a single query traces the impact forward through all connected relationships: which downstream suppliers, facilities, product lines, and customer commitments are affected, and in what order. This query runs against live operational data in seconds, giving supply chain teams time to act before the disruption reaches their production floor.
Does TigerGraph support predictive supplier risk scoring?
Yes. TigerGraph generates ML features directly from the graph structure, including supplier network centrality, shared dependency count, relationship age, and historical disruption proximity. These features can be combined with external signals (supplier financial data, news feeds, weather events, geopolitical risk scores) to score supplier risk continuously and flag emerging vulnerabilities weeks before they become visible through traditional monitoring. TigerGraph Solution Kits for supply chain management provide preconfigured starting points for this capability.