
Summary
- Traditional supply chain risk tools score individual suppliers but cannot model how risk concentrates and spreads across a connected network of suppliers, carriers, facilities, materials, products, and customers.
- Connected risk describes exposure created by indirect dependencies across the supply chain. It only becomes visible when those relationships are analyzed together, and it is responsible for many high-impact supply chain failures.
- Graph technology changes the unit of analysis from the individual supplier record to the full supply network, enabling real-time risk propagation, concentration detection, and alternative path scoring across every tier.
- Graph-derived ML features (supplier network position, substitutability, dependency concentration, and historical propagation patterns) give predictive models the connected context that transaction-level ERP data cannot provide.
- TigerGraph’s supply chain capabilities support five core capabilities of graph-based risk management: multi-tier modeling, real-time impact analysis, concentration detection, alternative path scoring, and agentic risk workflows with traceable decision paths.
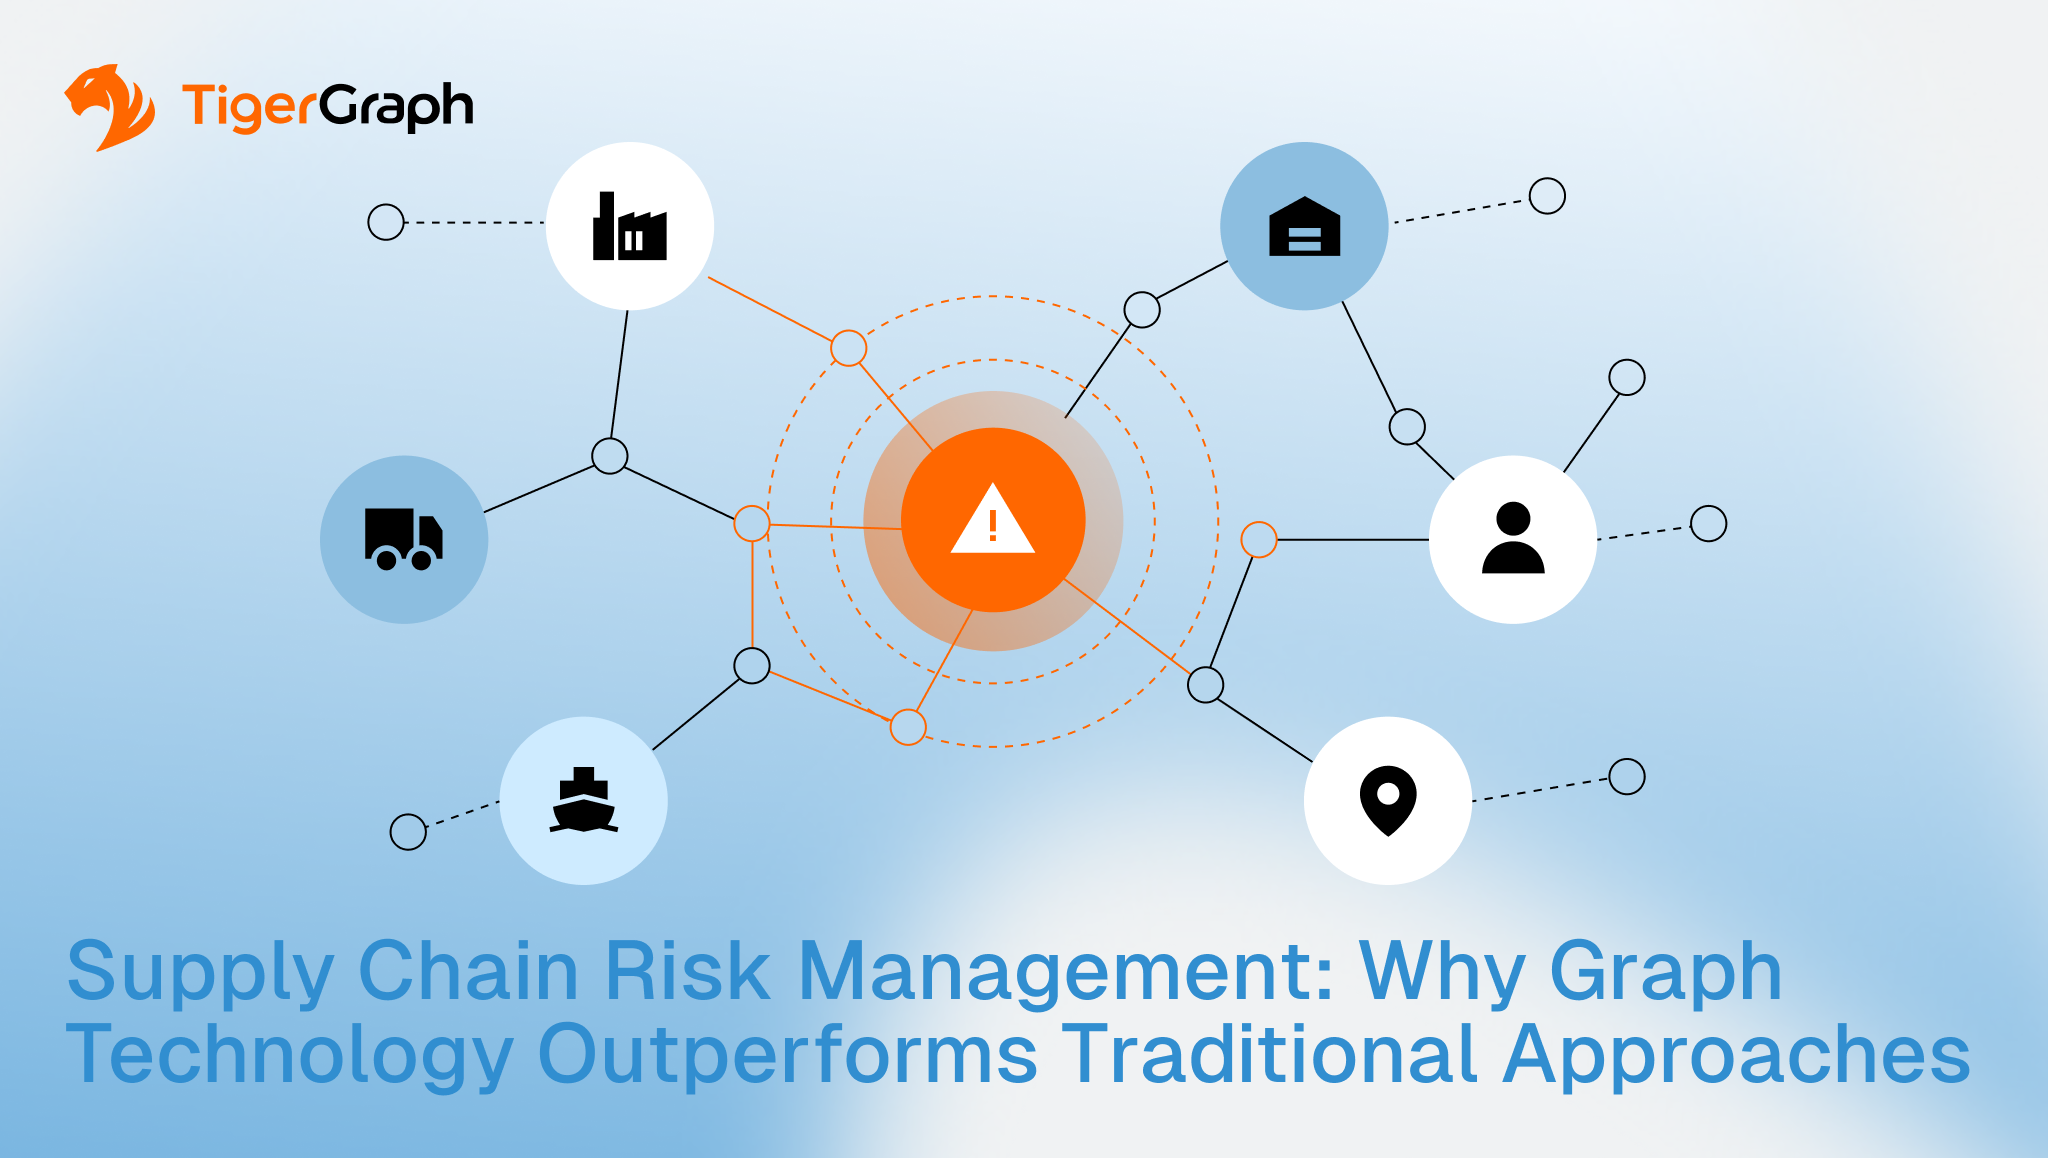
Most supply chain risk tools score risk. Few can map it. That limitation has become increasingly significant in a post-pandemic operating environment shaped by tariff changes, geopolitical pressure, supplier instability, logistics constraints, and regulatory shifts. A risk signal rarely remains confined to one supplier record. It spreads through shared materials, contract manufacturers, carriers, ports, production sites, products, orders, and customers.
The common thread in many supply chain failures is not that the risk was invisible. A supplier’s financial distress may have appeared in a credit report. A tariff change may have been public. A port constraint may have been reported. What remained invisible was the full set of dependencies connecting that event to the business.
Effective supply chain risk management therefore requires more than scoring individual vendors. It requires a connected view of how risk can enter, concentrate, and propagate across the supply network. Graph technology provides that infrastructure by making relationships directly queryable, so risk teams can identify exposure, assess impact, and evaluate mitigation options across the full network.
You’ll learn:
- Why traditional risk tools share a common structural failure: they score risk as an attribute of individual records, not as a property of an interconnected system
- What connected risk is and how indirect dependencies create hidden supply chain exposure
- How graph technology addresses five risk management capabilities that traditional tools cannot deliver
- How graph-derived features strengthen predictive models and how agentic AI can automate risk workflows with traceable recommendations
How Traditional Supply Chain Risk Management Works: And Why It Falls Short
Traditional supply chain risk management programs usually combine several systems, each useful within a narrow scope:
- Supplier scorecards summarize financial health, quality, delivery, and compliance for direct (Tier-1) suppliers, refreshed monthly or quarterly. A strong score says nothing about the Tier-3 manufacturer that direct supplier depends on.
- ERP risk modules attach risk indicators to individual records (a single supplier, contract, or purchase order). The system can report a supplier is high risk without showing how that supplier connects to products, plants, and downstream commitments across multiple levels.
- Spreadsheet risk registers offer flexibility but rely on manual updates and local knowledge. Each row evaluates a vendor in isolation, and separate teams often maintain inconsistent versions.
- Procurement intelligence tools add external signals (credit ratings, sanctions data, news, geopolitical alerts), but do not automatically model how an affected organization participates in the buyer’s wider supply network.
The shared failure mode is structural: all four approaches score risk as an attribute of an individual supplier. They do not treat risk as a property of an interconnected system. As a result, they may identify a warning without revealing the concentration, indirect exposure, or alternative supply routes that determine the warning’s business impact.
The missing capability is connected risk.
What Connected Risk Means in Practice
Connected risk describes exposure created by dependencies across suppliers, materials, logistics providers, facilities, products, geographies, and customers. It becomes visible only when those relationships are analyzed together as a connected system rather than as independent supplier records. A single supplier failure, tariff change, or regulatory update can affect an entire product portfolio through indirect dependencies that never appear in a Tier-1 risk register.
Consider three representative scenarios.
A Tier-3 semiconductor supplier approaches bankruptcy. The company is not listed in the manufacturer’s risk register because procurement contracts only with Tier-1 suppliers. Yet the Tier-3 company supplies a specialized component used by several Tier-2 manufacturers, all of which rely on the same logistics carrier. The risk reaches production weeks later, but the dependency existed all along.
A tariff changes for one raw material. That material appears in components produced by three upstream suppliers and ultimately affects 47 finished goods. Traditional tools require analysts to reconcile bills of materials, supplier files, sourcing systems, and product records. The tariff is visible; the portfolio-wide exposure is not.
A regulatory rule changes in one country. One local supplier supports components used by 12 product lines across several facilities. Analysts can find the supplier, but identifying every affected contract, product, production plan, and customer commitment may require days of manual cross-referencing.
These are network risk events. The severity of each event depends not only on the supplier or country involved, but on how deeply that entity is embedded in the supply chain. Graph analytics makes those dependencies queryable in real time, turning disconnected warnings into an explainable map of business exposure.
How Graph Technology Improves Supply Chain Risk Management
Graph technology changes the basic unit of analysis. Instead of keeping suppliers, carriers, ports, facilities, materials, products, orders, and risk signals in separate tables or applications, a graph risk model represents them as one connected supply network.
That model supports four critical capabilities.
1. Multi-Tier Network Modeling
A connected model can represent direct suppliers as well as Tier-2, Tier-3, and deeper dependencies, together with the carriers, ports, facilities, parts, and products that link them. Risk teams can examine the full chain behind a critical product rather than relying on a direct supplier list.
2. Real-Time Risk Propagation
When a new signal arrives (financial distress, a geopolitical event, a logistics anomaly, or a compliance change), the organization can immediately calculate which products, facilities, orders, and customers depend on the affected part of the network.
TigerGraph’s Supply Chain Analysis solution supports real-time analysis across multi-level value chains and event-impact notifications that reveal updated downstream consequences.
3. Concentration Risk Detection
A supplier can appear healthy and still represent systemic risk if it is present in a large share of critical supply routes. Deep multi-level link analytics can identify shared dependencies and single points of failure, including suppliers, carriers, ports, facilities, and materials that support an outsized share of the product portfolio.
4. Alternative Path Scoring
Once a risk is identified, the same connected model can locate alternative suppliers, transport routes, facilities, or material sources. Each option can be evaluated against lead time, capacity, cost, geography, compliance, and exposure to other known risks. This moves mitigation from a manual search to a repeatable analytical process.
Jaguar Land Rover reduced supply chain analysis time from three weeks to 45 minutes by building a connected supply network on TigerGraph.
Graph vs. Traditional Supply Chain Risk Management
The difference between traditional and graph-based risk management is not simply a better dashboard. It is a different way of calculating exposure. The distinction is not simply between better reporting and better visualization. It is between analyzing isolated supplier records and analyzing the supply network as a connected system.
| Risk management dimension | Traditional approach | Graph approach |
| Supplier risk scoring | Static score based on past performance, capacity, and other individual metrics; updated monthly or quarterly | Network-aware score incorporating supplier position, systemic importance, and upstream dependencies; updates continuously |
| Concentration risk detection | Manual mapping by analysts using spreadsheets and institutional knowledge; slow and incomplete | Automated identification of shared dependencies across suppliers, carriers, ports, and materials |
| Disruption impact assessment | Post-event cross-referencing across procurement, logistics, and production systems; may take days | Real-time propagation analysis as soon as a signal is received; reveals affected products, facilities, and customers immediately |
| Regulatory and tariff change analysis | Manual search across contracts, BOM records, and country-of-origin databases; may take a week or more | Single query connects affected materials and suppliers to products, revenue, commitments, and alternative sources |
| Risk monitoring cadence | Periodic review cycles (monthly or quarterly); events between cycles may not receive full assessment | Continuous signal monitoring with immediate impact analysis ranked by product criticality |
Supplier Risk Scoring
A supplier’s score reflects its position in the network, not just its own attributes. A financially stable supplier may receive a higher systemic-risk score if it is the only source for a critical component, supports many product lines, or depends on a fragile upstream partner. Scores update as relationships and risk signals change.
Risk Concentration Detection
The system continuously identifies shared dependencies. A risk analyst can ask which suppliers, carriers, ports, or materials appear in more than a defined percentage of supply routes for critical products and receive an immediate, explainable result, without manual spreadsheet mapping.
Disruption Impact Assessment
The connected network reveals affected products, facilities, orders, and customers as soon as a signal is received. Event-driven analysis can recalculate exposure whenever supplier status, inventory, capacity, or logistics conditions change, rather than waiting for the next analyst review.
Regulatory and Tariff Change Analysis
A single query identifies every supply route that includes materials or suppliers from the affected jurisdiction, then connects those routes to products, revenue, customer commitments, and alternative sources. The result supports both compliance review and commercial prioritization simultaneously.
Risk Monitoring Cadence
Continuous monitoring connects new signals to the current supply network. Alerts trigger immediate analysis, rank affected products by criticality, and route cases to the correct procurement, operations, compliance, or executive team, between review cycles rather than after them.
Across all five capabilities, graph supply chain risk management replaces periodic, record-based assessment with continuous relationship intelligence.
ML-Enhanced Risk Intelligence
ML models are only as useful as the features they receive. ERP data describes a supplier as an individual record: defect rate, delivery delay, credit score. Graph-generated features describe the supplier’s role in the network.
Examples include:
- Supplier relationship patterns: How deeply embedded is the supplier across products, facilities, and other suppliers?
- Dependency concentration: What share of critical product supply routes relies on this supplier, carrier, port, facility, or material?
- Substitutability: How many qualified alternatives exist, and what additional risks do those alternatives introduce?
- Historical propagation patterns: Which combinations of dependencies have previously turned a local issue into a broader operational impact?
- Exposure proximity: How directly does a new geopolitical, regulatory, or logistics signal connect to high-value products and customer commitments?
These features not only enable ML models to identify risk points and predict consequences of supply shocks; they also show whether the problem is a weak supplier or a weak network design.
Agentic Supply Chain Risk Management
Graph analytics also provides a foundation for autonomous risk workflows. Instead of waiting for an analyst to open a dashboard and initiate each query, an AI agent can monitor signals, reason across dependencies, evaluate scenarios, and prepare a recommended response.
A supply chain risk agent could:
- Monitor financial, logistics, geopolitical, regulatory, and supplier-performance signals
- Connect each signal to the relevant suppliers, materials, facilities, products, orders, and customers
- Estimate the scale and urgency of exposure
- Identify alternative suppliers or logistics routes and score the trade-offs
- Generate a risk report with the relationships and evidence supporting each recommendation
- Escalate high-impact cases to the appropriate human decision-maker
Traceability is essential. A risk manager should be able to see why an agent classified an event as critical, which dependencies shaped the assessment, what alternatives were considered, and what evidence supported the final recommendation. The graph provides that decision context and can retain relevant history as adaptive agentic memory.
Agentic systems do not remove human accountability. They reduce the manual work required to connect signals, assess exposure, and prepare options, allowing risk teams to focus on decisions that require judgment, negotiation, and business trade-offs.
Make Connected Risk a Core Supply Chain Capability
Traditional supply chain risk management tools were built for a simpler operating model: scoring individual suppliers, organizing contracts, surfacing external warnings. They are often poorly suited to continuously analyzing how risk concentrates and propagates across deep, multi-tier supply networks. As a result, a Tier-3 supplier failure, tariff change, or logistics constraint can affect an entire product portfolio long before the full business exposure becomes visible.
Graph technology transforms those relationships into an operational model that organizations can query, analyze, and act on continuously. It enables organizations to identify indirect exposure, calculate downstream impact, detect single points of failure, evaluate alternatives, enrich predictive models, and support traceable AI-assisted decisions from one connected risk foundation.
Explore the TigerGraph Supply Chain Analysis solution to see how real-time relationship intelligence supports multi-tier risk management, or evaluate TigerGraph Savanna for a fully managed cloud deployment with prebuilt supply chain solution kits.
Ready to build a connected risk foundation? Start with TigerGraph’s free tier or request a demo.
FAQs
What is connected risk in supply chain management?
Connected risk is the exposure created by indirect dependencies across a supply network. A Tier-3 supplier failure, a tariff change, or a regulatory update rarely affects only the organization directly involved. It propagates through the shared materials, carriers, facilities, and product lines that depend on that supplier or region. Traditional risk tools assess individual suppliers and cannot model this propagation. Connected risk only becomes visible when the full network of dependencies is represented as queryable, connected data.
Why do traditional supply chain risk tools fail to detect indirect exposure?
Traditional tools store risk as an attribute attached to a single supplier record. They can report that a Tier-1 supplier is high risk, but they cannot show how that supplier’s upstream dependencies, shared logistics providers, or component relationships affect the wider product portfolio. This is a structural limitation, not a data gap. No amount of additional supplier data resolves it because the underlying model does not represent relationships between suppliers, materials, facilities, and customers as connected structure.
How does a graph database improve supply chain risk scoring?
A graph-based risk model scores suppliers based on their position in the supply network, not only their individual attributes. A financially stable supplier can receive a high systemic-risk score if it is the sole source for a critical component, appears in supply routes for many product lines, or depends on a fragile upstream partner. These network-derived scores can be updated continuously as relationships and risk signals change, giving risk teams a more accurate and current picture of actual exposure than periodic scorecard refreshes can provide.
Can graph technology help with regulatory and tariff change analysis?
Yes. When a tariff or regulatory rule changes, a graph query can identify every supply route that includes materials, components, or suppliers from the affected country or category, then connect those routes to products, revenue figures, customer commitments, and available alternatives in a single query. The same analysis that might take a week of manual cross-referencing across contracts, bills of materials, and sourcing systems can be completed in real time against a connected supply network model.
How does TigerGraph support agentic supply chain risk management?
TigerGraph’s Agentic AI platform enables risk agents to continuously monitor financial, logistics, geopolitical, and supplier-performance signals and connect each signal to the relevant parts of the supply network automatically. Because every recommendation is grounded in explicit graph relationships, risk officers can trace why an agent flagged an event as critical, which dependencies shaped the assessment, what alternatives were considered, and what evidence supported the recommendation. TigerGraph Solution Kits for supply chain management provide preconfigured starting points for both graph-native risk modeling and agentic workflow deployment.