
Summary
- Supply chain resilience depends on the ability to trace disruption impact across interconnected suppliers, logistics routes, components, and orders in real time, not just within tier-one relationships.
- Traditional ERP and analytics systems evaluate supply chain data in silos; graph databases model the entire supply network as connected data that can be queried instantly when disruption occurs.
- Graph analytics enables organizations to trace the full downstream impact of a disruption, evaluate alternative suppliers and routes simultaneously, and prioritize recovery actions before the intervention window closes.
- Key supply chain resilience capabilities that graph enables include multi-tier supplier visibility, alternative route modeling, real-time order tracking, and ML-based disruption prediction.
- TigerGraph can trace supply chain consequences 10 or more levels deep in real time, powering faster disruption response at enterprise scale.
Supply chain resilience has become one of the defining operational challenges for global enterprises. Disruptions such as port closures, supplier failures, logistics bottlenecks, and unexpected demand spikes are no longer exceptional. They are a recurring feature of global supply chains, and the question is no longer whether disruption will occur, but how quickly an organization can anticipate, respond, and recover. The organizations that recover fastest and anticipate best are rarely those with the most data. They are the ones who understand the connected impact of disruption first.
While most organizations understand their direct suppliers and logistics partners reasonably well, disruptions expose a different challenge: understanding which orders are affected, which production lines will stall, which customers will miss delivery commitments, and how recovery actions should be prioritized to minimize overall business impact.
These disruptions demonstrate that resilience in supply chain is fundamentally a connected-data problem. The speed of recovery depends on how quickly organizations can trace the ripple effects of disruption across interconnected suppliers, logistics routes, components, inventory, and customer orders. This type of multi-tier impact analysis is precisely what graph databases are designed to support. The challenge is not detecting the disruption itself. It is understanding everything the disruption affects.
Organizations that can respond quickly to disruptions consistently outperform slower competitors on revenue continuity and customer retention. The cost of slow disruption response, including expediting fees, lost sales, and customer attrition, makes supply chain resilience not just an operational goal but a financial one.
In this article, you’ll learn:
- What supply chain resilience is and why agility matters as much as redundancy
- Why traditional analytics architectures struggle to respond to multi-tier disruptions
- How graph maps disruption impact across the full supply network in real time
- How TigerGraph supports supply chain resilience at enterprise scale
What Is Supply Chain Resilience?
Supply chain resilience is the ability to anticipate disruptions, absorb their immediate impact, and recover normal operations (or adapt to a new operational state) as quickly as possible.
A resilient supply chain does not eliminate disruptions; it reduces the time and cost to recovery by combining redundancy with agility. Redundancy is created by having alternative suppliers, routes, or inventory buffers that can be activated when a primary option fails. Agility is achieved by identifying where a disruption hits, modeling its full downstream impact, and then executing a recovery plan fast enough to matter.
In practice, many organizations invest more heavily in redundancy than in agility, even though agility is often the harder capability to build. Knowing that you have an alternative supplier does not help if you cannot quickly determine which orders are affected by a disruption, which components are at risk, and whether re-routing through the alternative supplier will actually close the gap or create new bottlenecks downstream. This requires real-time analysis of a fully connected, multi-tier network.
Why Traditional Analytics Fall Short When Disruption Hits
Most organizations have invested substantially in ERP systems, supply chain management platforms, and reporting tools. These systems are good at tracking transactions and generating performance reports under normal operating conditions, but fall behind in disruptive scenarios that require in-depth analysis.
Supply chain data lives across multiple systems, including procurement, inventory management, logistics, demand planning, and supplier portals. These systems often operate as independent silos, meaning that when a disruption occurs, understanding the full impact requires correlating data across all of them simultaneously. While this can be done with relational architectures, it requires expensive multi-table joins that are too slow for real-time disruption response. The limitation is not the amount of operational data available. It is the inability to connect that data fast enough to support real-time decisions.
Global supply chains involve dozens, sometimes hundreds, of suppliers across multiple tiers. Modeling how a disruption at a tier-three component supplier propagates through tier-two assemblers and tier-one manufacturers, and ultimately to finished-good availability, requires tracing relationships many levels deep. Each additional tier multiplies the join complexity in a relational model, making deep impact analysis increasingly impractical in real time.
When a disruption hits, supply chain teams spend hours or days manually pulling data from multiple systems and building spreadsheet models to estimate impact. By the time the analysis is ready, the window for proactive re-routing or prioritization has often already closed. Alternatively, decisions are made using incomplete information, extending recovery times and increasing operational risk.
What supply chain teams need is not more data: it is the ability to query how that data connects across the full supply network in real time, and this is a graph problem. Supply chain disruption is fundamentally a relationship problem rather than a reporting problem.
How Graph Maps Disruption Impact Across the Supply Network
A graph database represents a supply chain as a connected network: suppliers, manufacturers, logistics partners, distribution centers, inventory locations, products, components, and orders are modeled as interconnected entities. The relationships between them (sourcing contracts, component dependencies, logistics routes, order-to-inventory linkages) are first-class data that can be queried directly without joins.
When a disruption occurs at any node in the network, for example, a supplier goes offline, a port closes, or a logistics provider loses capacity, a graph query can instantly identify every order, component, route, and downstream production line connected to that node, at any depth. This is the kind of connected impact map that enables fast recovery.
For example, if a single-source component supplier announces a two-week shutdown, a graph query can immediately trace every product that uses that component, every open order for those products, every customer affected by those orders, and every available alternative sourcing relationship for that component in seconds. Supply chain managers get an actionable impact report and a ranked list of alternative routing options before the first manual spreadsheet is opened.
TigerGraph’s deep link analytics can trace supply and demand changes across 10 or more levels of the supply chain simultaneously, propagating the impact of a disruption from a raw-material supplier through sub-assemblers, manufacturers, and distribution to customer delivery commitments. A shallow analysis that covers only tier-one relationships often misses the cascading effects that cause the most costly surprises.
TigerGraph can notify relevant teams as soon as a triggering event occurs, immediately surfacing updated downstream consequences, including production delays, inventory shortages, pricing impacts, and missed customer commitments. Teams can therefore respond using current operational data rather than waiting for batch reports.
Supply Chain Resilience Strategies That Graph Enables
These are supply chain resilience examples using graph as part of your organization’s strategy:
- Multi-tier supplier visibility: having a graph model of the full supplier network, including tier-two and tier-three relationships that are often invisible to central procurement, means that your team can see the full downstream impact immediately when a disruption occurs at any tier. Your procurement team can identify which finished products are at risk from a tier-three disruption before it propagates to tier-one, rather than discovering the exposure after a production stoppage.
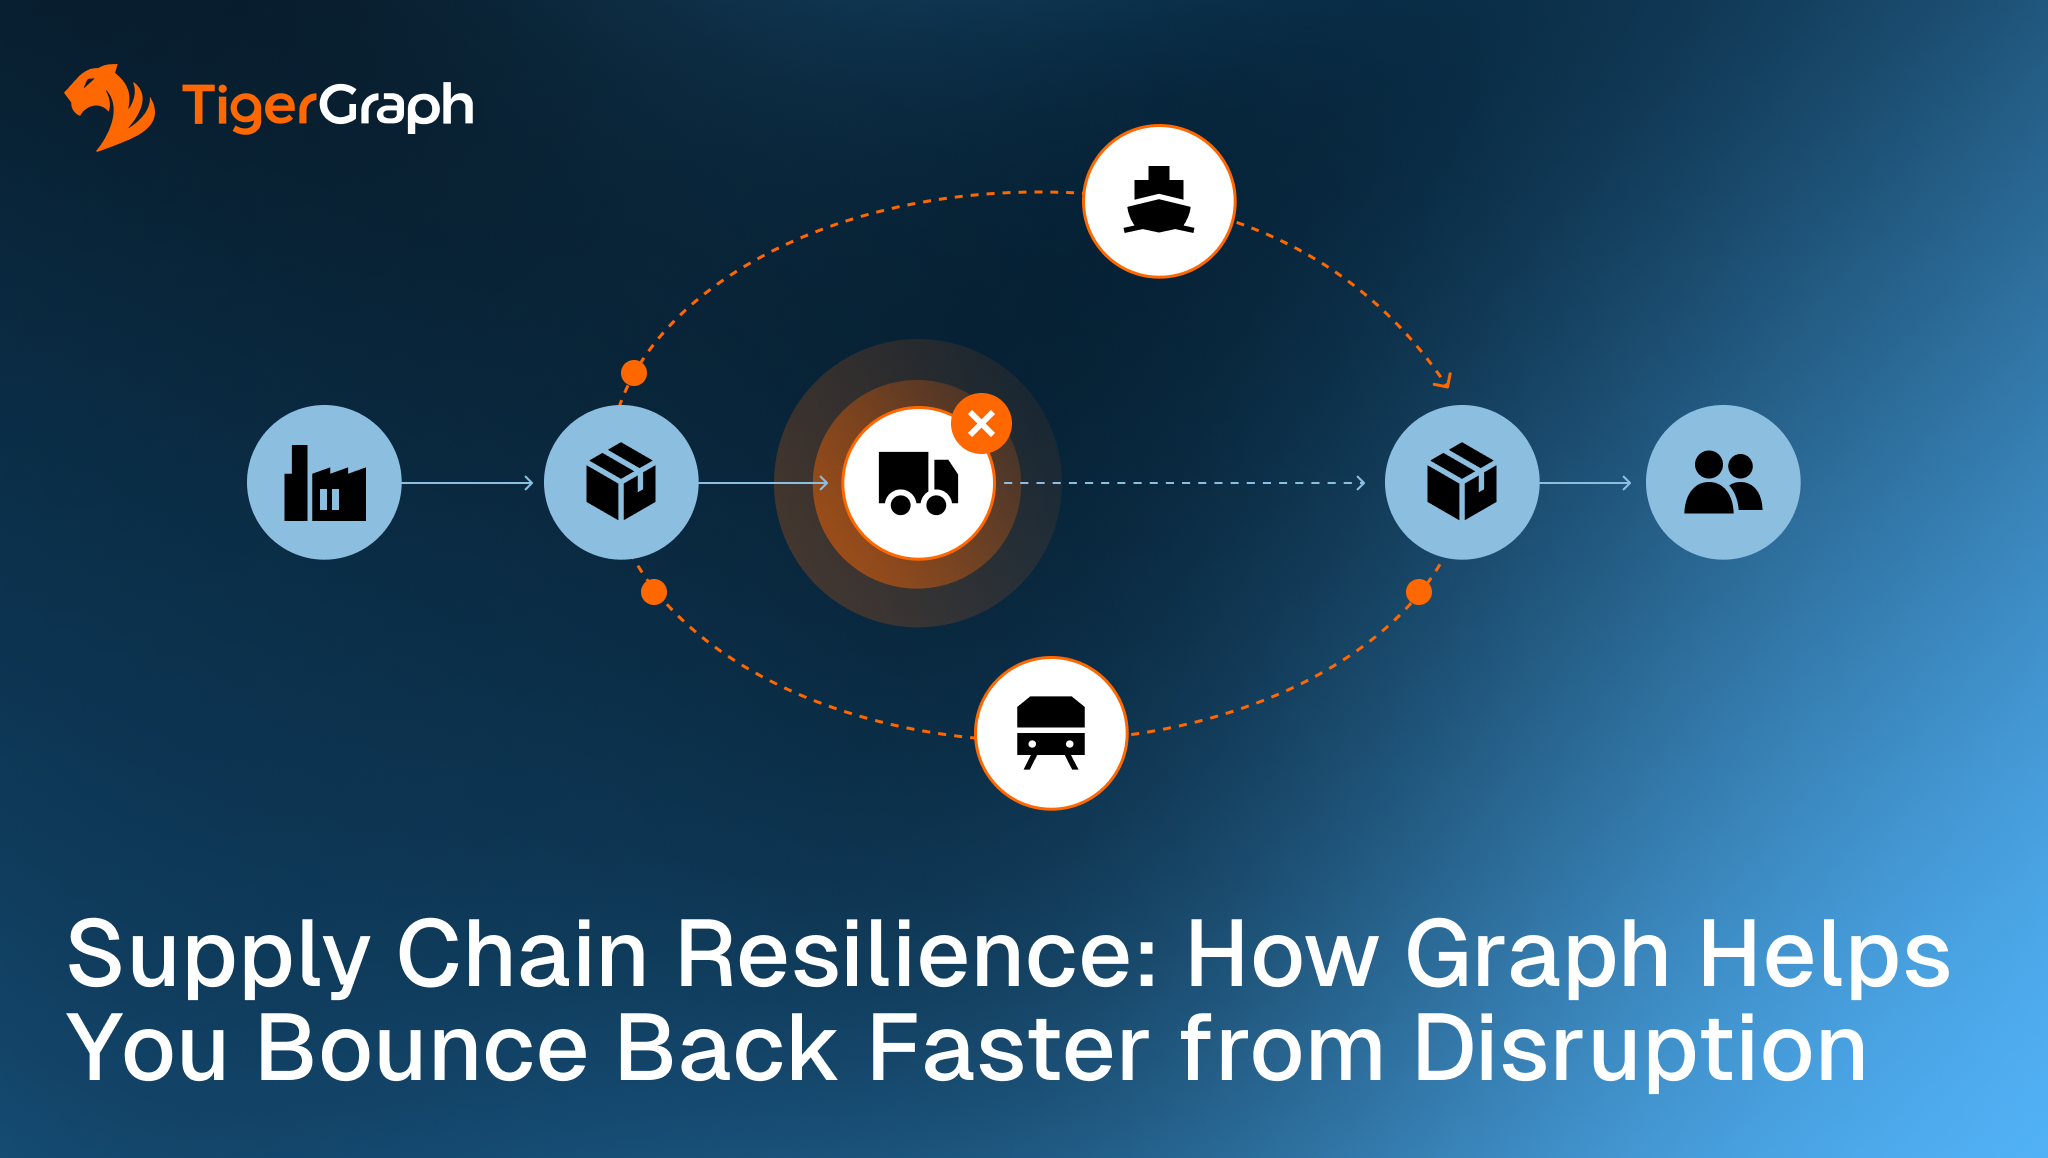
- Alternative route and supplier modeling: when a primary route or supplier becomes unavailable, graph can evaluate every alternative simultaneously by comparing lead times, capacity, cost, and downstream fit. It then identifies the substitution that minimizes total disruption while causing the fewest secondary effects, transforming a manual evaluation process into a real-time recommendation.
- Demand and supply propagation modeling: organizations can model how supply and demand changes move through the multi-tier value chain in real time, calculating potential supply outages and generating recommendations before they become shortfalls. This shifts the planning horizon from reactive to proactive.
- Supply chain-informed machine learning: TigerGraph generates graph-computed features from multi-level supply chain relationships, including connection depth, supplier dependency concentration, route redundancy, and historical disruption patterns. These features feed machine learning models for disruption prediction. The accuracy of ML-based supply chain forecasting improves substantially when the training data captures relationship context rather than just transactional history.
- Real-time order and logistics management: your team can track shipment status, order management, and logistics operations in real time with full relationship context, providing visibility into not only where a shipment is, but which customer orders it affects, what inventory positions it will update, and what downstream production commitments depend on its arrival.
How TigerGraph Powers Supply Chain Resilience at Enterprise Scale
TigerGraph’s graph database combines supplier data, logistics networks, inventory positions, production schedules, and demand forecasts into a single connected model that can be queried in real time across the full complexity of a global supply chain. A graph-based impact analysis that traces consequences 10 or more levels deep, from a raw-material disruption through to finished-good availability, can be executed in real time, making proactive disruption response operationally feasible rather than a batch exercise that completes after the intervention window has closed.
As events occur anywhere in the network, the connected model updates immediately and downstream consequences are recalculated in real time. TigerGraph integrates external partner data with internal operational systems, including procurement, production, inventory, and logistics, without requiring rigid upfront alignment, so disruption analysis can cross organizational boundaries as naturally as the supply chain itself.
TigerGraph’s graph data science library generates relationship-based features, including supplier dependency concentration, route redundancy scores, and component criticality rankings, that improve the accuracy of machine learning models trained to predict and respond to disruptions. The platform deploys on AWS, Azure, GCP, or on-premises and maintains sub-second query performance as supply chain data grows to billions of connected records. Jaguar Land Rover is among the enterprise manufacturers that have deployed TigerGraph for supply chain analysis.
Build Supply Chain Resilience with Graph
Supply chain resilience depends on the ability to see the full connected impact of a disruption across a multi-tier network in real time and act on that analysis fast enough to change the outcome. This requires a data architecture that treats supplier relationships, logistics routes, component dependencies, and order linkages as connected data rather than separate tables to be joined after the fact.
Your operational resilience depends on the ability to trace a disruption’s impact from a tier-three supplier all the way through to customer delivery commitments in seconds, to model alternative routes and substitutions simultaneously before committing to a recovery path, and to propagate supply and demand changes through the full value chain in real time rather than discovering cascading effects too late to address them.
TigerGraph provides the connected data infrastructure that makes these resilience strategies operationally executable, turning disruption visibility into faster recovery at enterprise scale. TigerGraph also combines real-time graph analytics, relationship-aware decision support, and enterprise-scale performance to help organizations recover from disruption faster and with greater confidence.
To see how TigerGraph supports supply chain resilience at enterprise scale, explore TigerGraph’s supply chain analysis solutions, start a free trial, or request a demo.
FAQs
What is supply chain resilience?
Supply chain resilience is the ability to anticipate disruptions, absorb their immediate impact, and recover normal operations as quickly as possible. A resilient supply chain combines redundancy (alternative suppliers, routes, and inventory buffers) with agility: the ability to quickly identify which orders are affected, model the full downstream impact, and execute a recovery plan before the intervention window closes.
How does graph analytics improve supply chain resilience?
Graph analytics models the supply network as a connected structure of suppliers, manufacturers, logistics routes, inventory positions, and customer orders. When a disruption occurs, a graph query can instantly trace every connected order, component, route, and production line at any depth. This replaces hours of manual analysis with real-time impact visibility, enabling faster and better-informed recovery decisions.
What is multi-tier supply chain visibility?
Multi-tier supply chain visibility means having a real-time view of supplier dependencies beyond your immediate tier-one partners, extending through tier-two and tier-three relationships and beyond. Most costly supply chain surprises originate at these deeper tiers. Graph databases enable multi-tier visibility by modeling the full supplier network as connected data that can be queried at any depth without performance degradation.
How does TigerGraph support supply chain disruption response?
TigerGraph enables real-time impact analysis across multi-tier supply networks by tracing disruption consequences 10 or more levels deep, from a raw-material supplier through to customer delivery commitments. It supports simultaneous alternative route and supplier evaluation, generates relationship-aware features for ML-based disruption prediction, and integrates procurement, inventory, logistics, and production data into a single queryable model. Jaguar Land Rover is among the enterprise manufacturers that have deployed TigerGraph for supply chain analysis.
What is the difference between supply chain redundancy and supply chain agility?
Redundancy means having backup options available: alternative suppliers, secondary logistics routes, or safety stock. Agility means being able to identify which backup to activate, how quickly to activate it, and what downstream effects the switch will create, fast enough to matter. Most organizations invest in redundancy but underinvest in agility. Graph analytics directly supports agility by enabling real-time impact analysis and alternative route modeling across the full supply network.