Contact Us
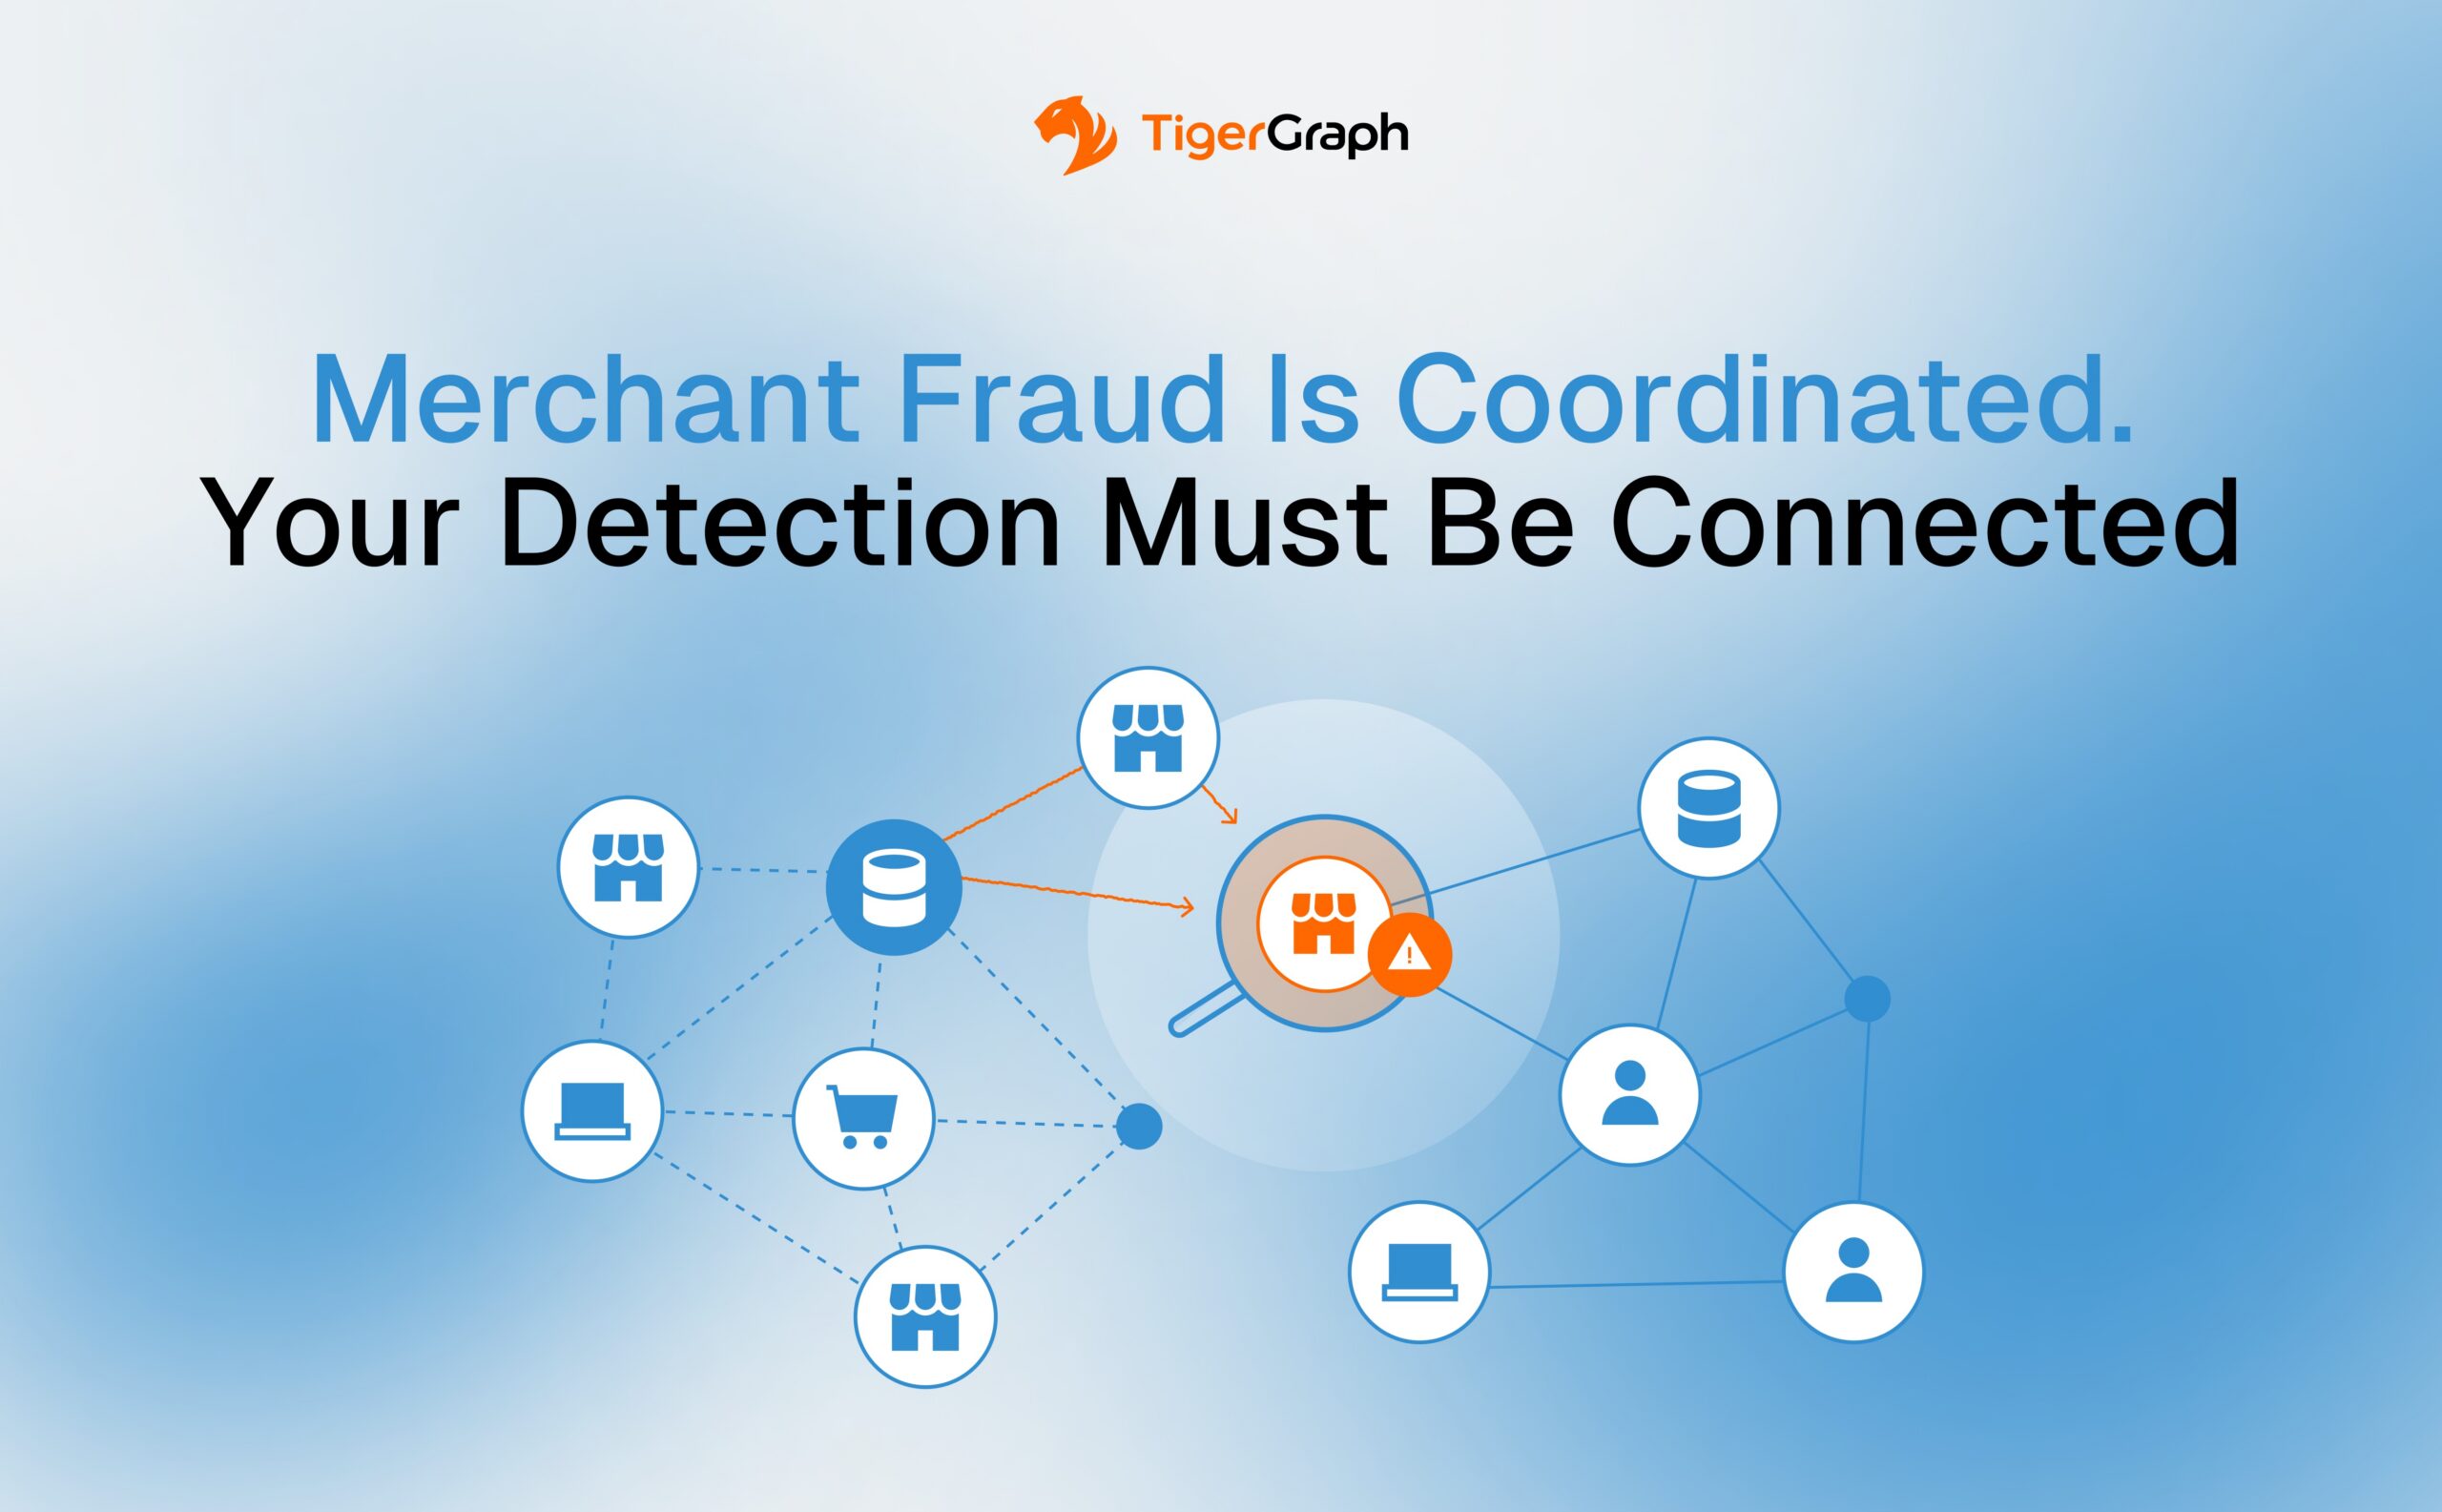
Graphic with network icons and the text: Merchant Fraud Is Coordinated. Your Detection Must Be Connected. TigerGraph logo appears at the top.
Merchant Fraud Is Coordinated. Your Detection Must Be Connected
Discover
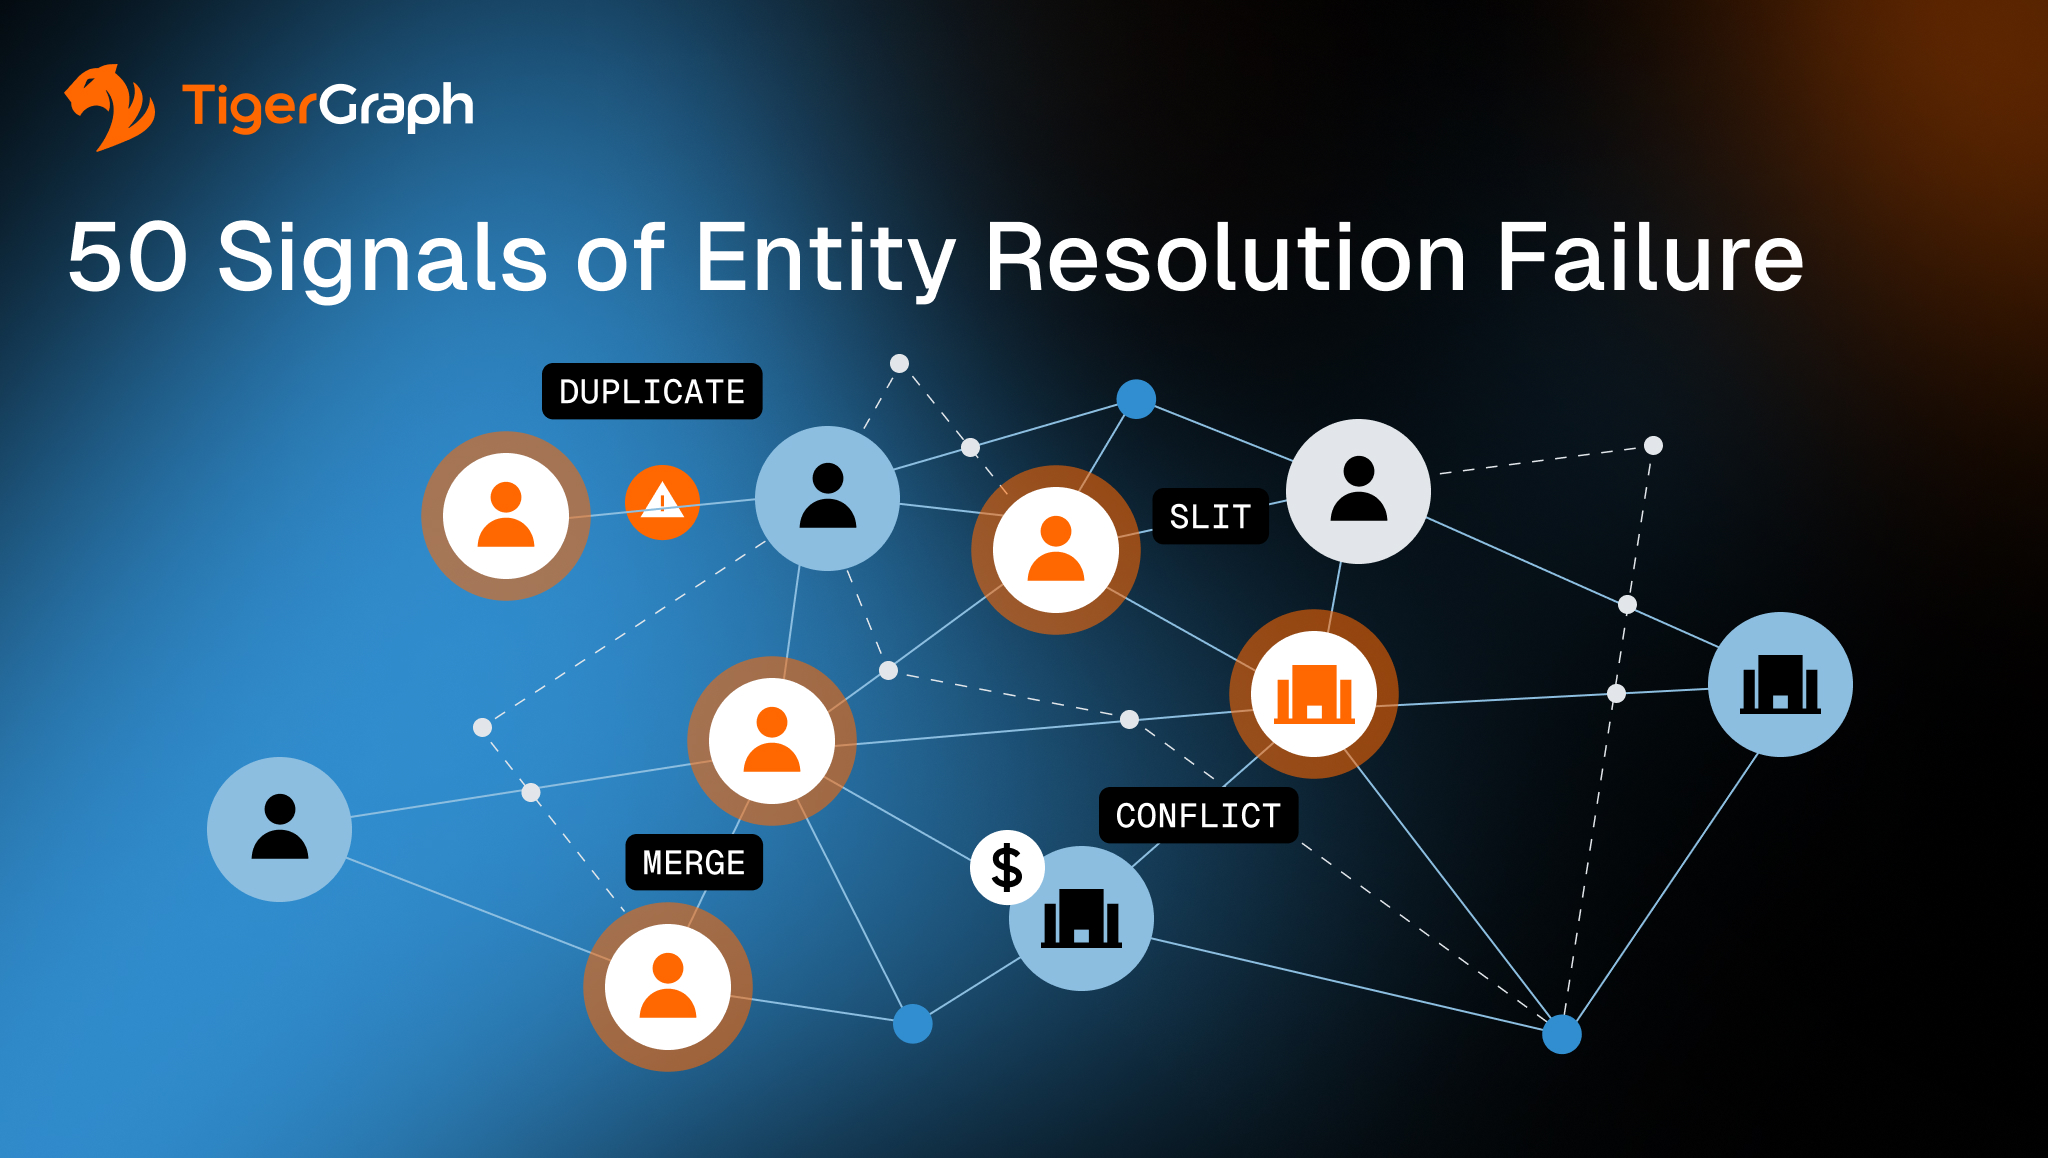
A digital graphic by TigerGraph titled 50 Signals of Entity Resolution Failure shows connected user icons with labels such as DUPLICATE, MERGE, SLIT, and CONFLICT, representing data issues in a network.
50 Signals of Entity Resolution Failure
Discover
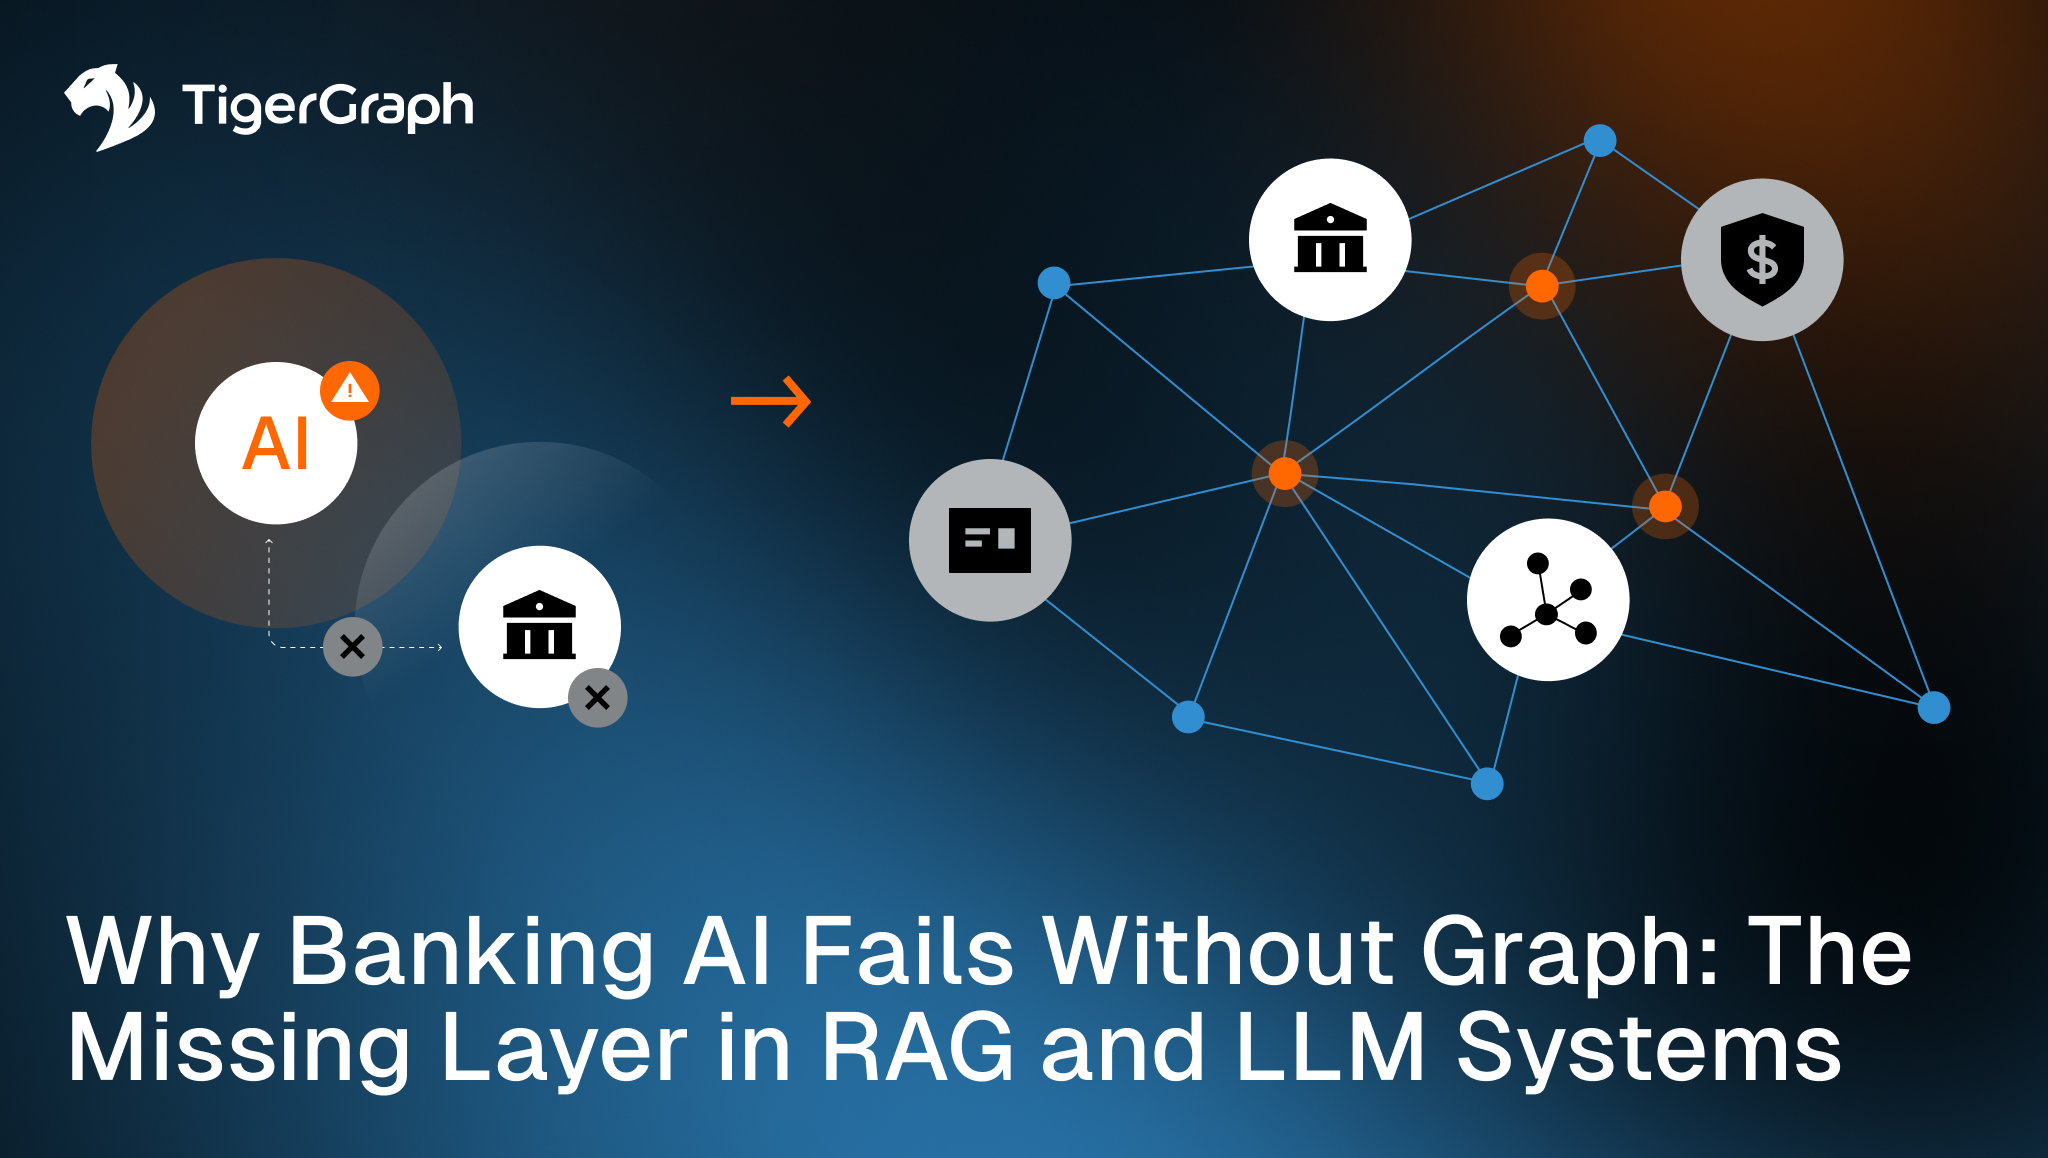
A graphic from TigerGraph showing AI icons with warning signs on the left and connected banking-related icons on the right, illustrating how Banking AI architecture with graph for RAG and LLM systems supports success. Text: Why Banking AI Fails Without Graph: The Missing Layer in RAG and LLM Systems.
Why Banking AI Fails Without Graph: The Missing Layer in RAG and LLM Systems
Discover
Event graphic with a purple and pink Clarion Events logo on the left and white text reading fraud leaders summit overlaying a faded image of the London Eye and city skyline in the background.
Feb 23-24th- Fraud Leaders Summit – London, UK
Discover
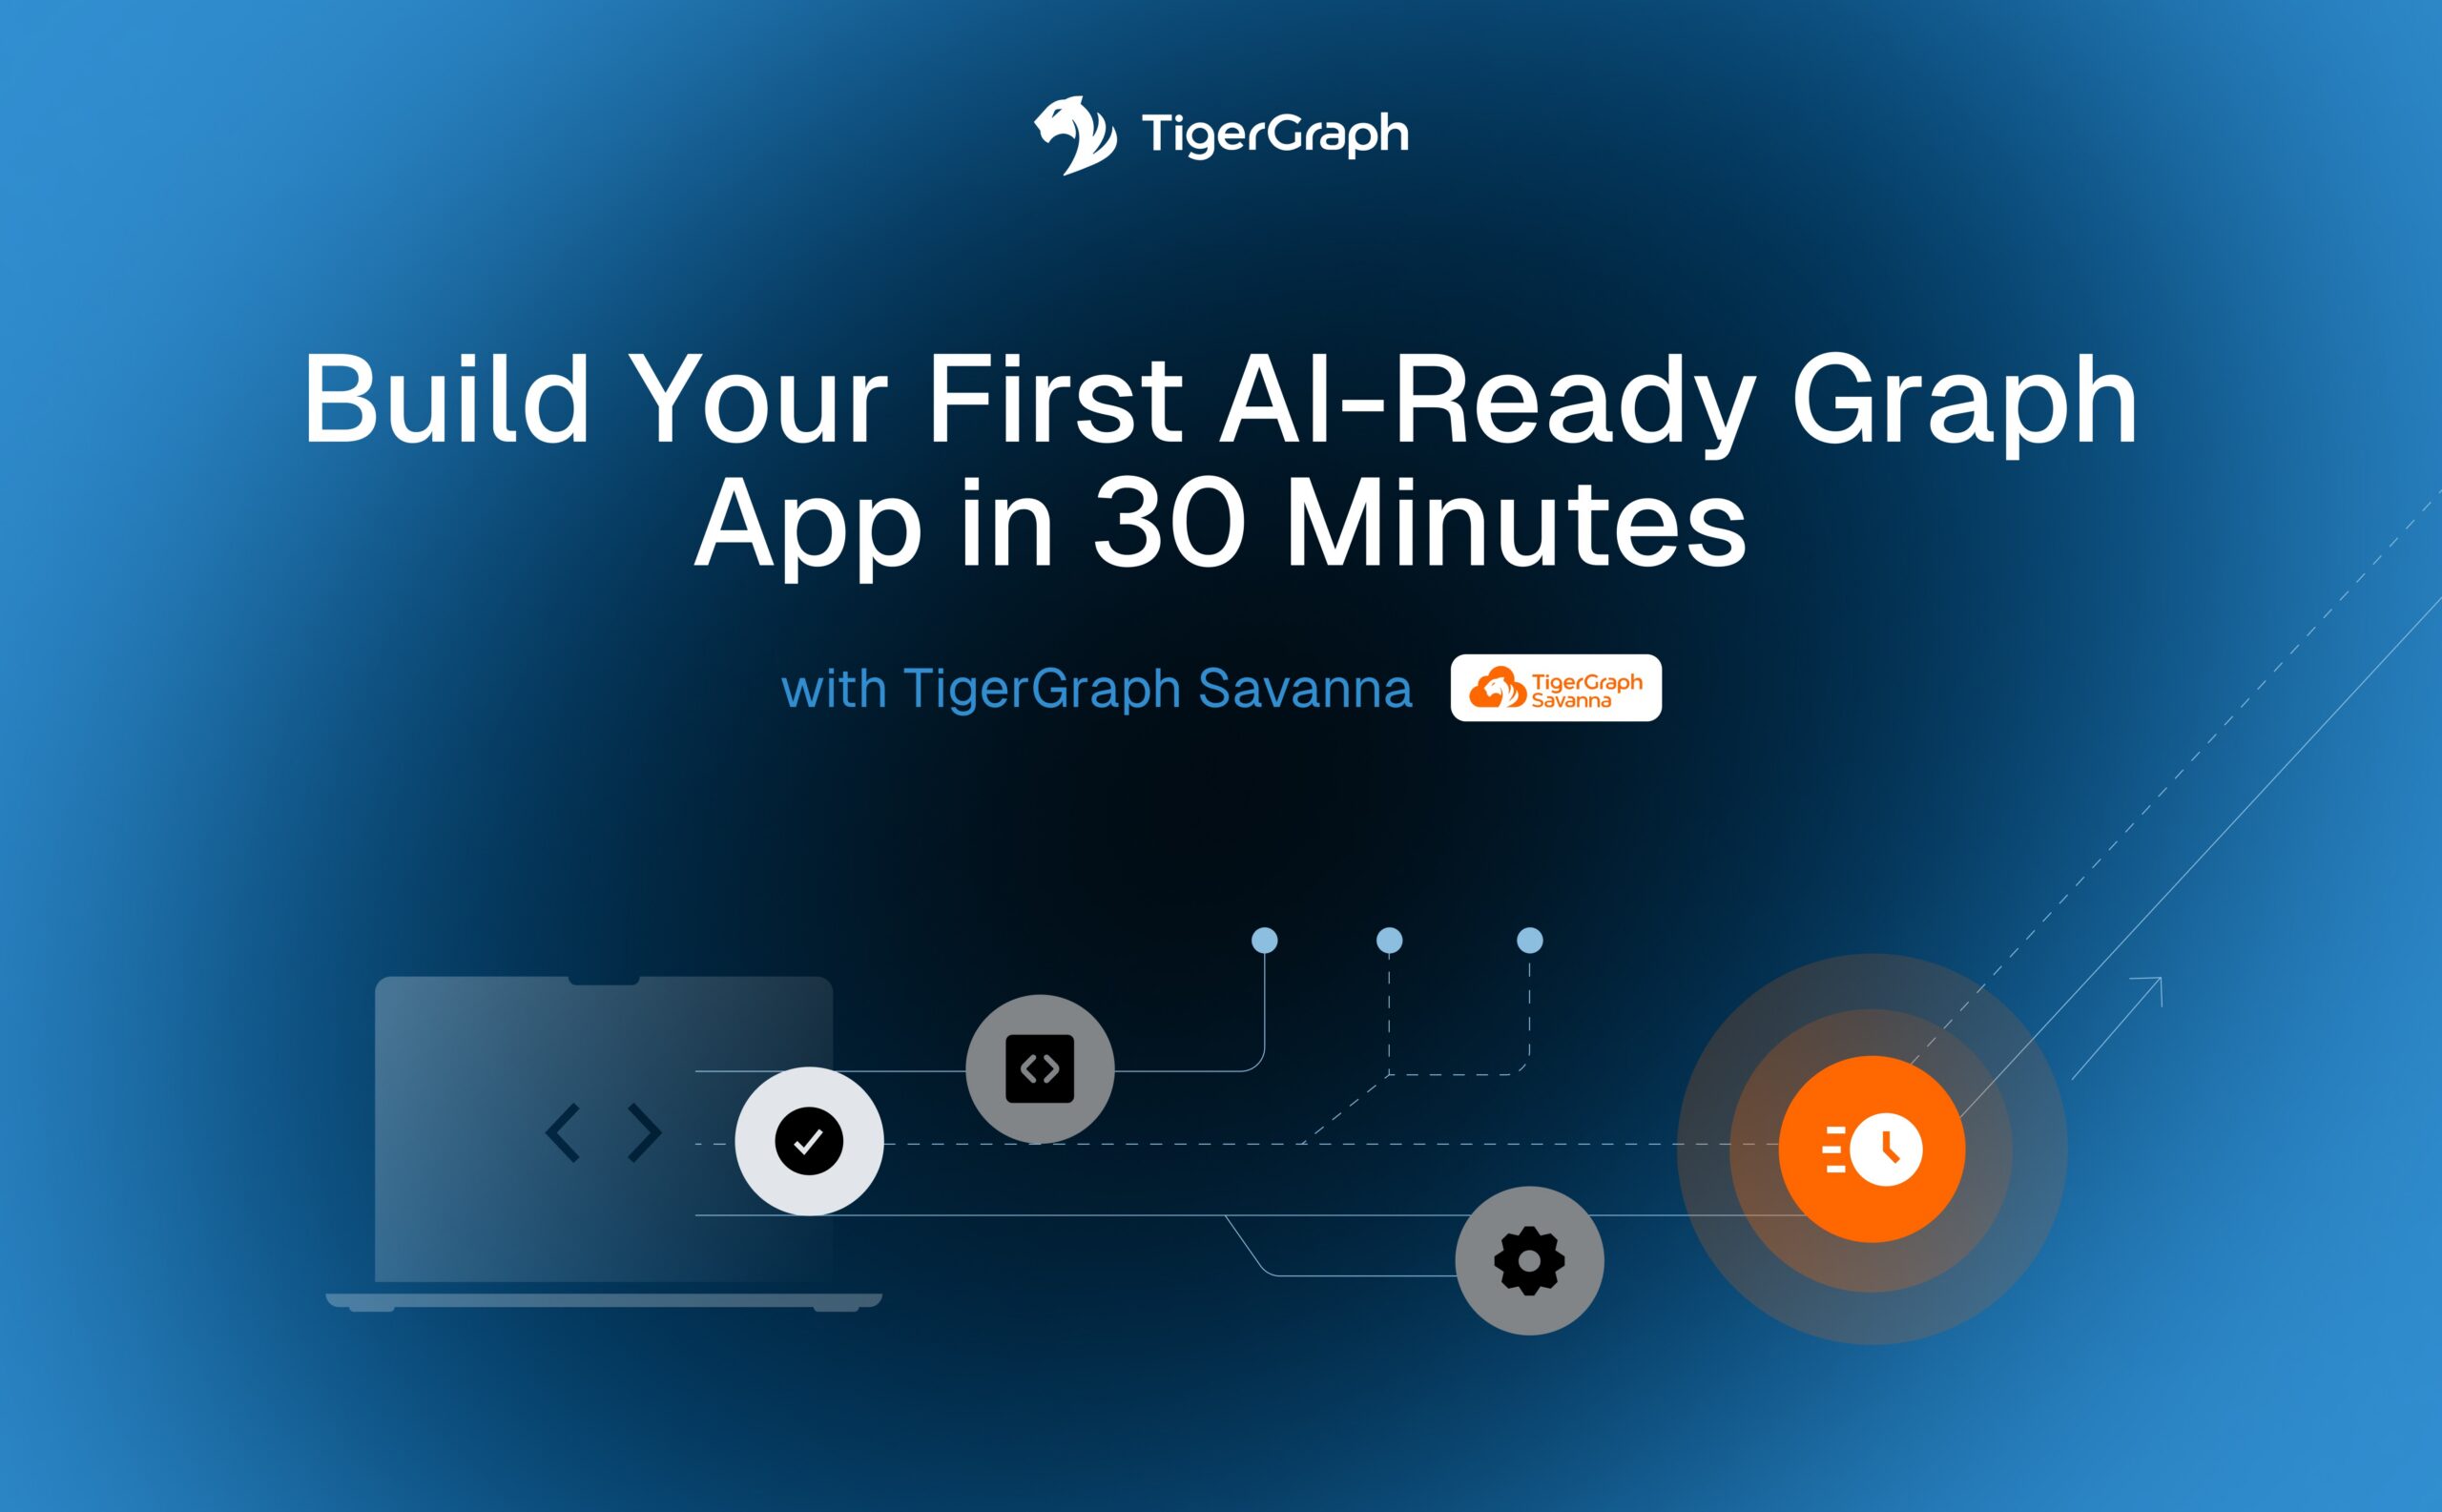
A digital graphic with the TigerGraph logo and text: Build Your First AI-Ready Graph App in 30 Minutes with TigerGraph Savanna. Stylized icons of a laptop, code, and gears are set against a blue background.
Build Your First AI-Ready Graph App in 30 minutes
Discover
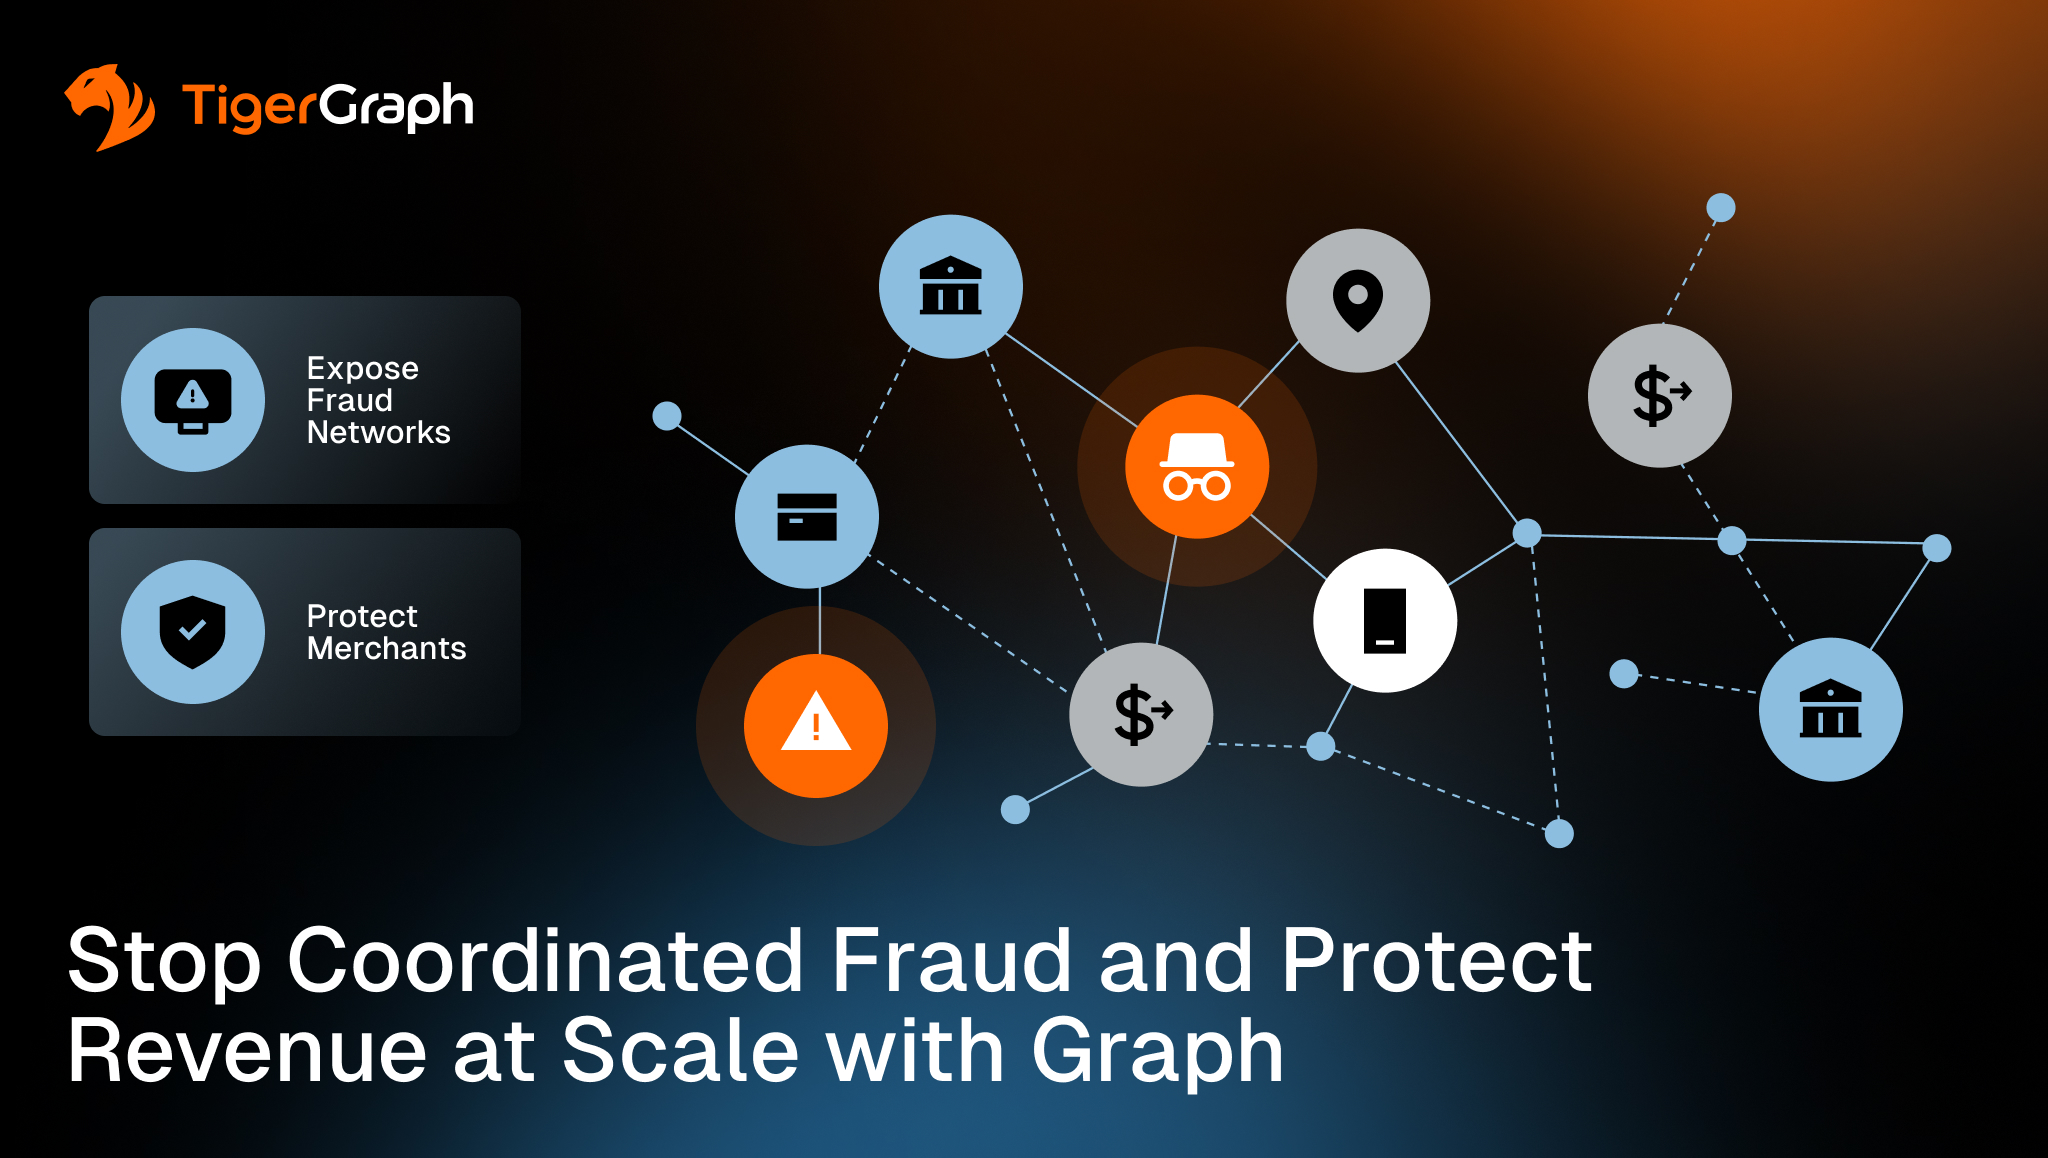
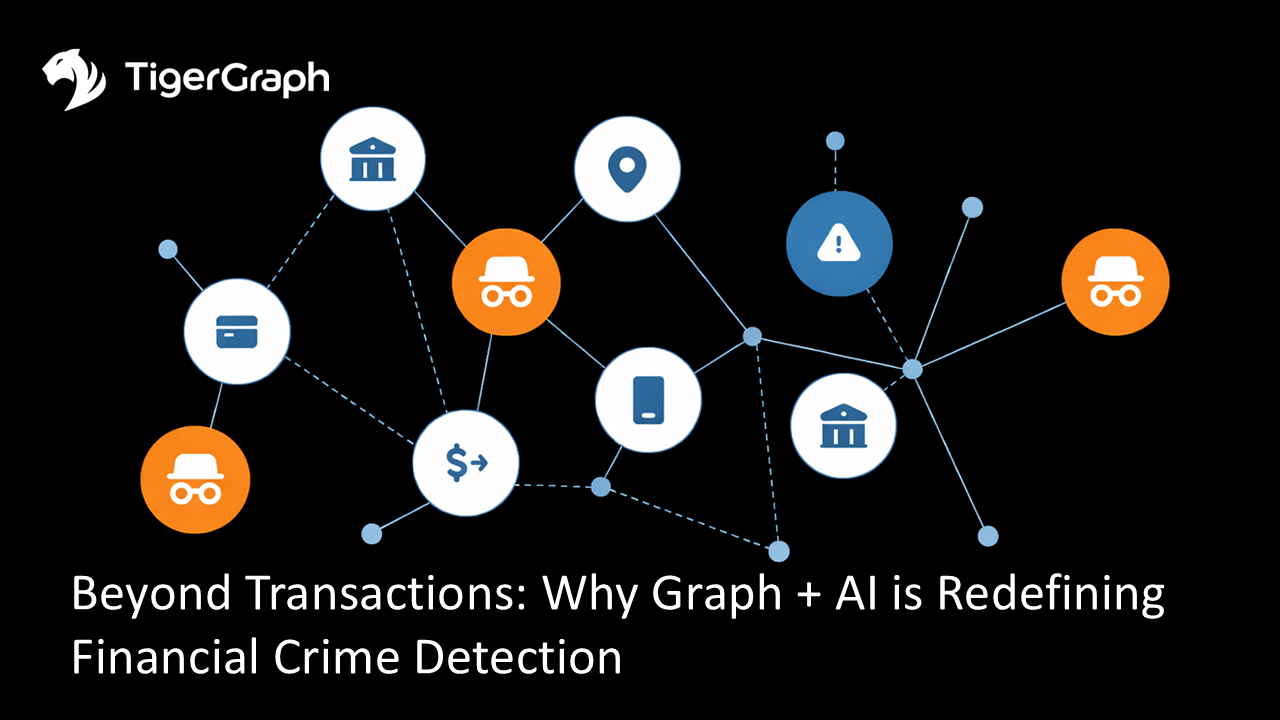
A network diagram shows connected icons representing banks, alerts, a phone, masked criminals, and money. The TigerGraph logo is at the top left. Text reads: Beyond Transactions: Why Graph + AI is Redefining Financial Crime Detection.
Beyond Transactions: Why Graph + AI is Redefining Financial Crime Detection
Discover
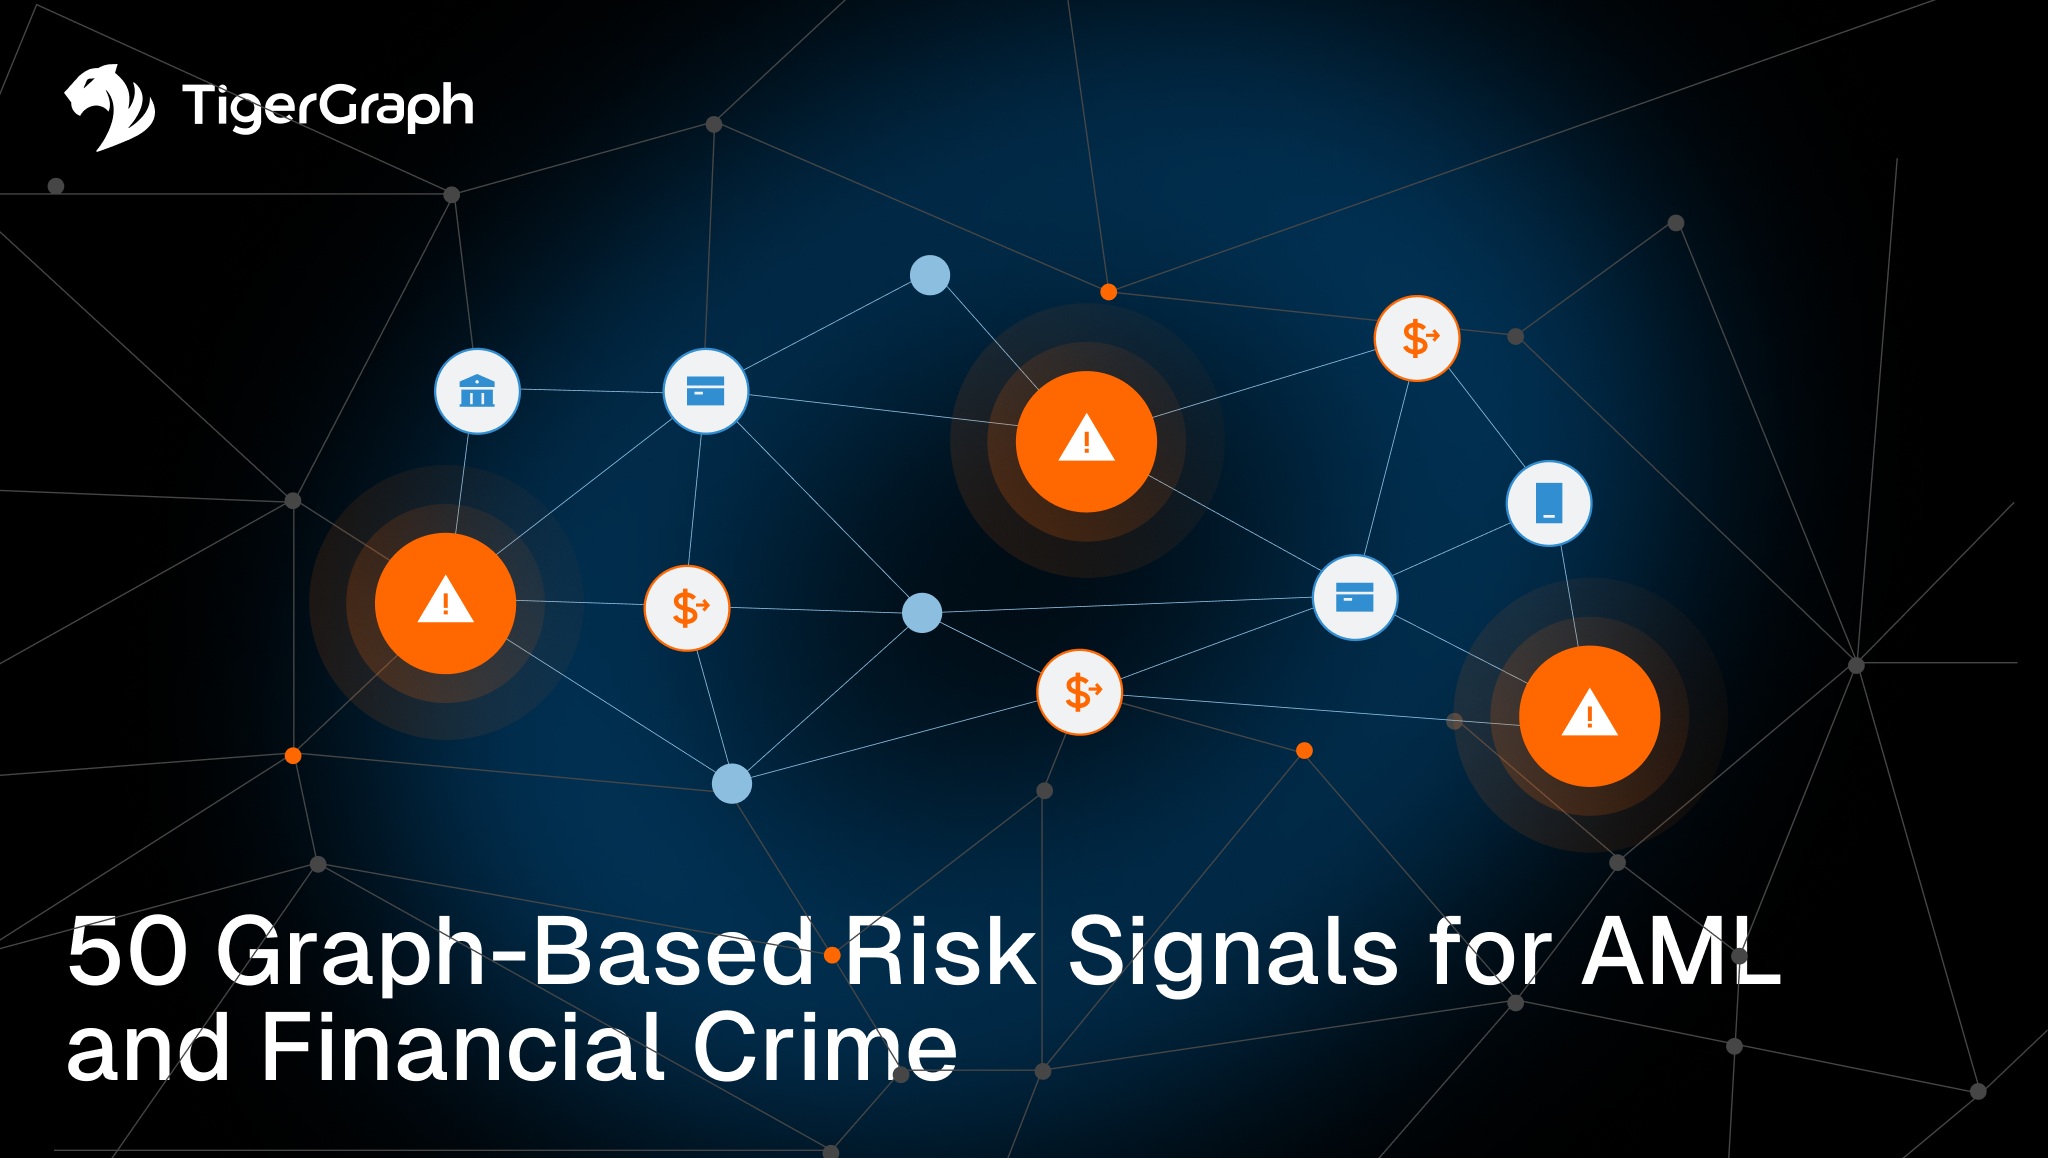
A dark blue network diagram with icons of banks, people, and dollar signs connected by lines, featuring warning triangles. Text reads: 50 Graph-Based Risk Signals for AML and Financial Crime. TigerGraph logo in the top left corner.
50 Graph-Based Risk Signals for AML and Financial Crime
Discover
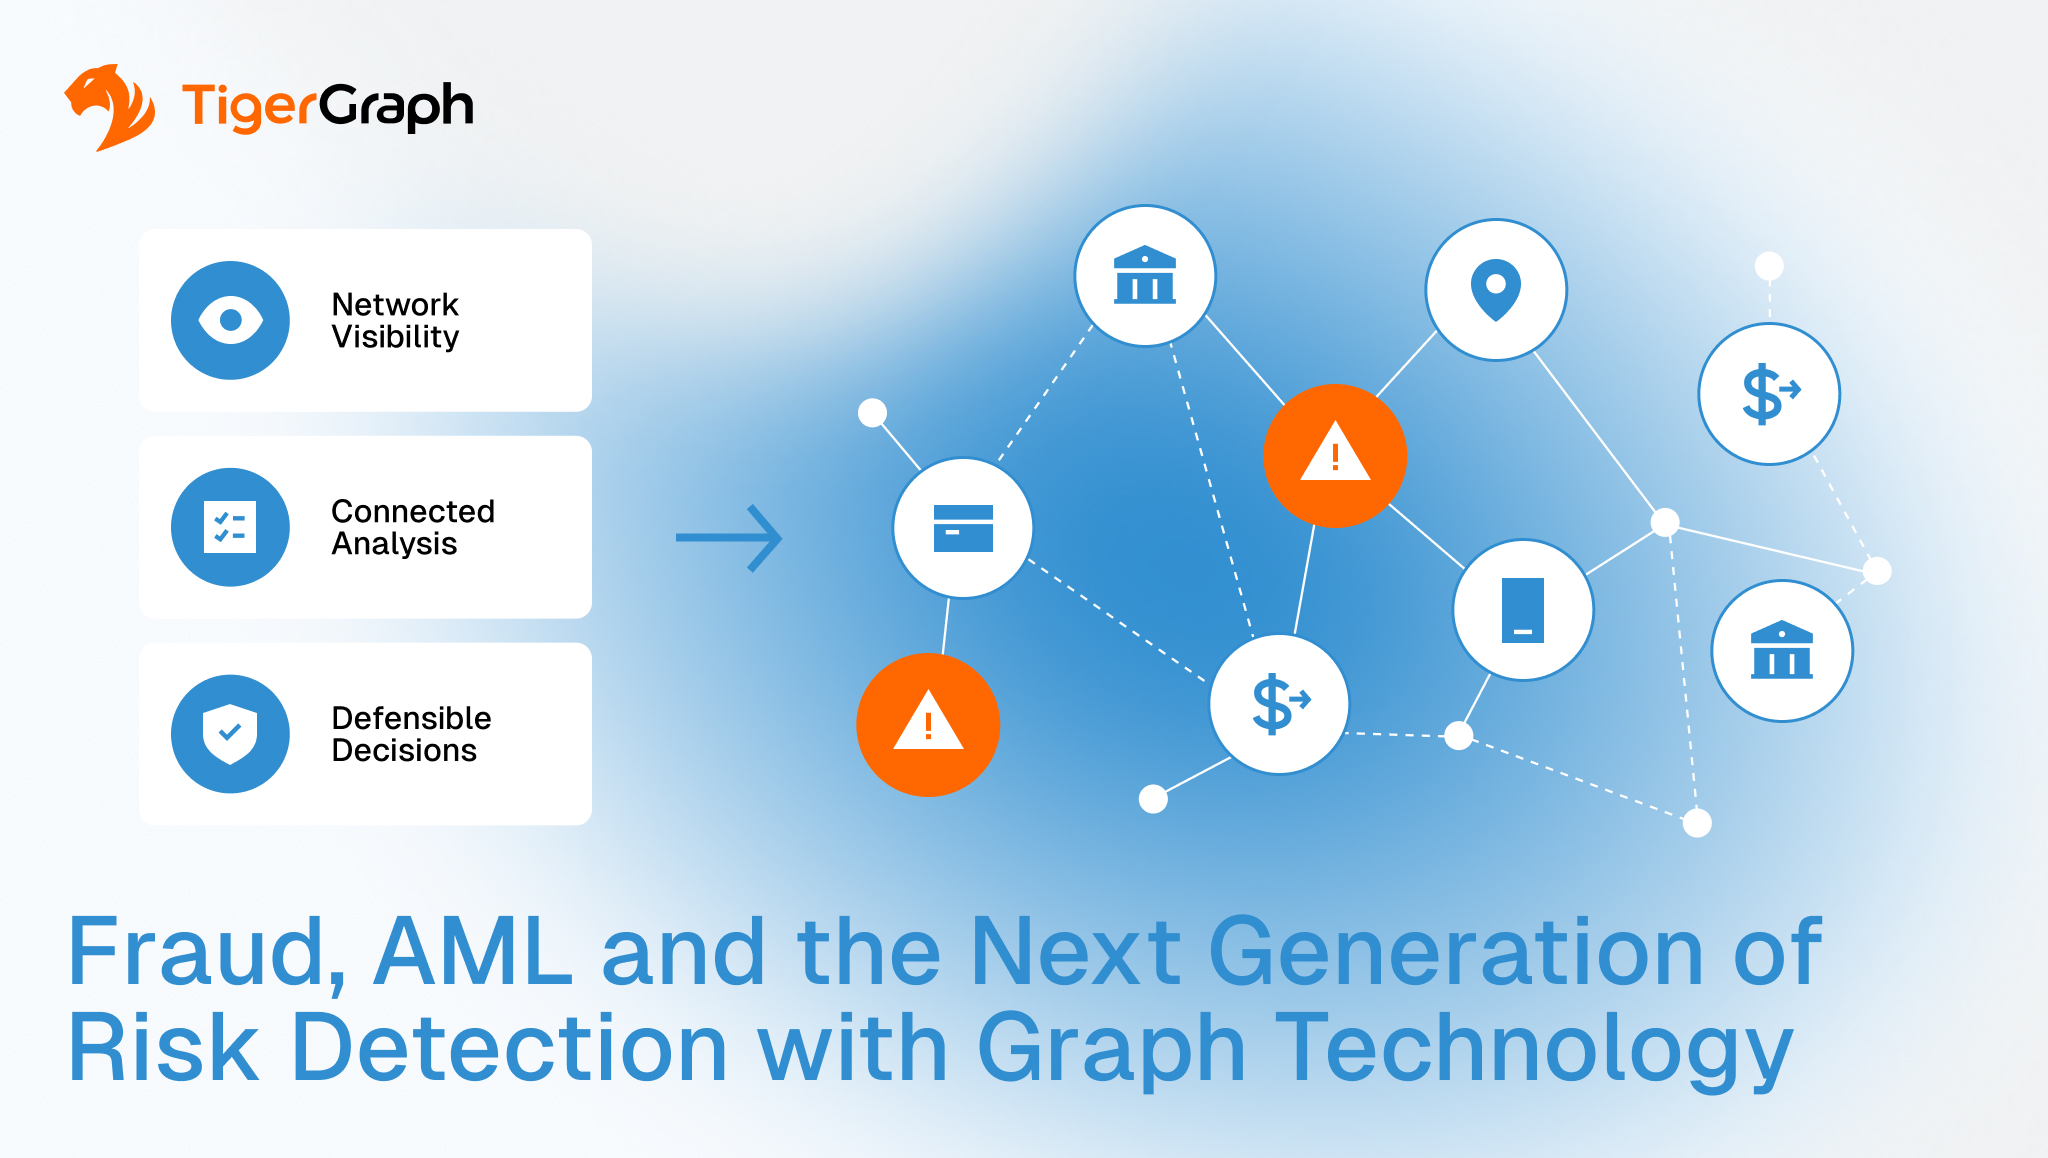
A digital infographic from TigerGraph shows networked icons for security, money, and users, highlighting benefits like network visibility, connected analysis, and defensible decisions in fraud and AML risk detection with graph technology.
Fraud, AML and the Next Generation of Risk Detection with Graph Technology
Discover
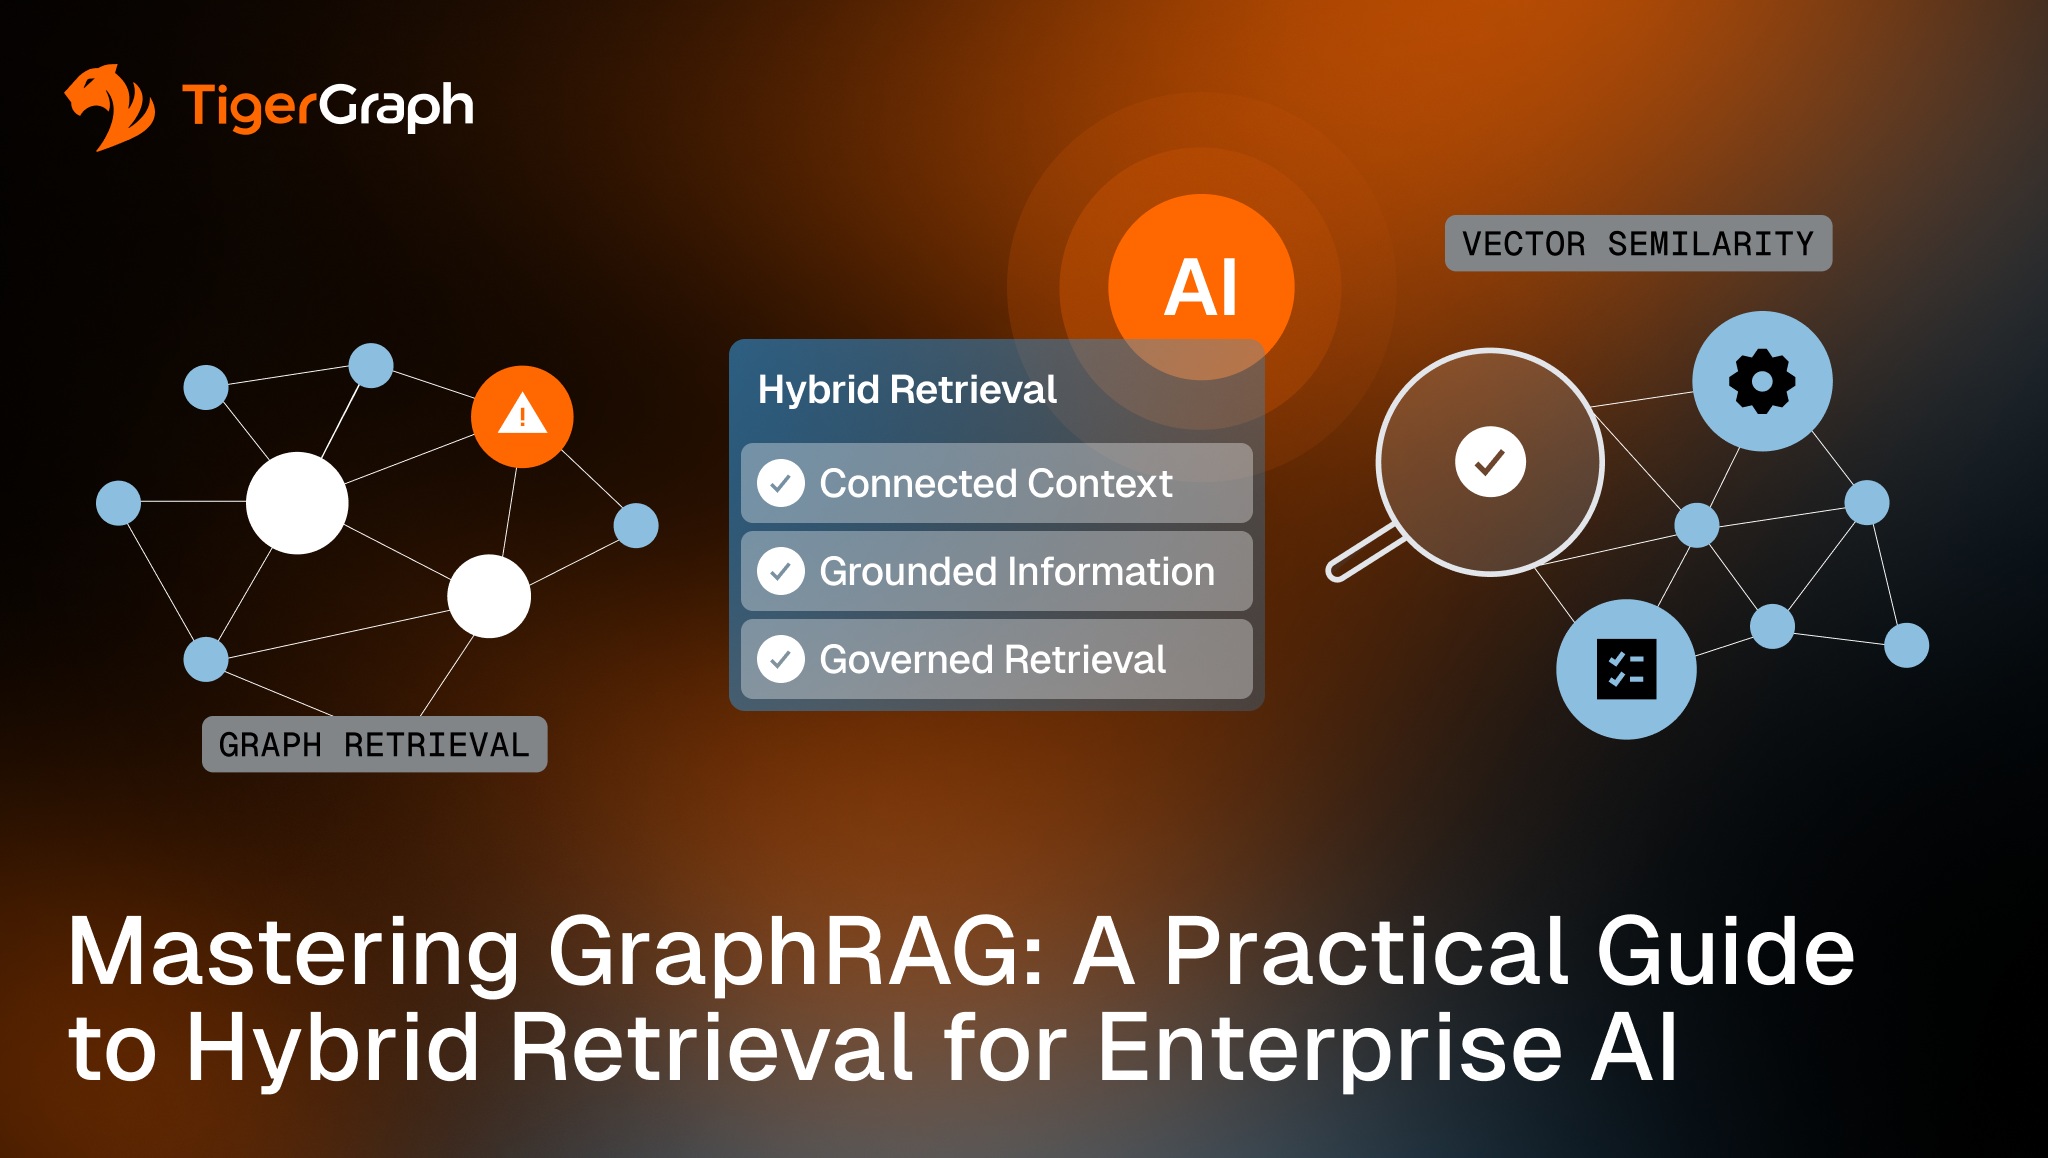
Infographic with TigerGraph logo, diagrams for graph retrieval and vector similarity, an orange AI circle, and a checklist for hybrid retrieval. Title reads: Mastering GraphRAG: A Practical Guide to Hybrid Retrieval for Enterprise AI.
Mastering GraphRAG: A Practical Guide to Hybrid Retrieval for Enterprise AI
Discover
A table showing identity risk signals with colored alerts, next to a network graphic with orange warning icons. Text: 50 Identity Risk Signals for KYC, KYB, and Due Diligence. TigerGraph logo is in the corner.
50 Identity Risk Signals for KYC, KYB, and Due Diligence
Discover
A digital graphic shows the TigerGraph logo, abstract blue nodes connected by lines, and orange dots over a dark background. The text reads: Hybrid AI Infrastructure: How Graphs and Vectors Power Next-Gen Enterprise Applications.
Hybrid AI Infrastructure- How Graphs and Vectors Power Next-Gen Enterprise Applications
Discover
A network diagram shows icons for banks, users, money, and security connected to a central alert symbol, representing real-time AI detection of financial crime. The TigerGraph logo is in the top left corner.
Financial Crime in the Age of AI: How Connected Intelligence Enables Real-Time Detection
Discover
Infographic titled From Data to Decisions: How Knowledge Graphs Transform Banking Intelligence in Real Time with icons representing people and devices connected by labeled arrows, illustrating data relationships. TigerGraph logo in top left.
From Data to Decisions: How Knowledge Graphs Transform Banking
Discover
Event panel image titled Crouching Data, Hidden Errors featuring portraits of five panelists with their names, titles, and companies, focusing on uncovering hidden data errors to improve fraud detection and decision-making.
CDO Mgz NYC Leadership Summit
Discover
TigerGraph visual showing connected data nodes and analytics icons representing how graph algorithms uncover hidden relationships, fraud patterns, and insights in banking.
Graph Algorithms in Action: Unlocking Hidden Insights in Banking
Discover
A soft gradient background transitioning from pale blue at the bottom to white at the top. The image is abstract and conveys a serene and calm atmosphere.
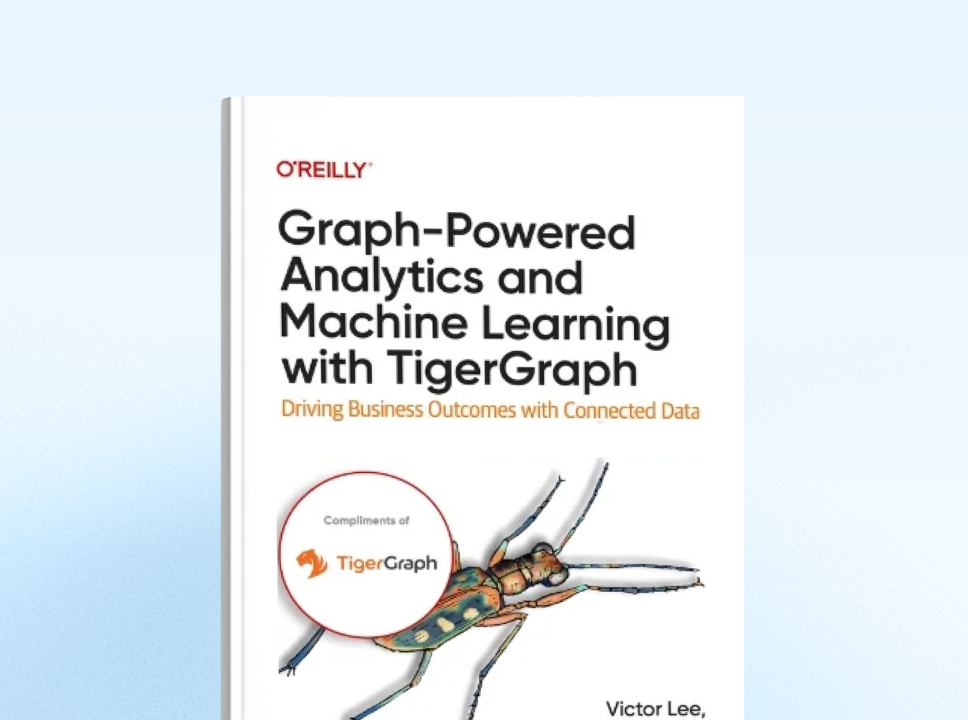
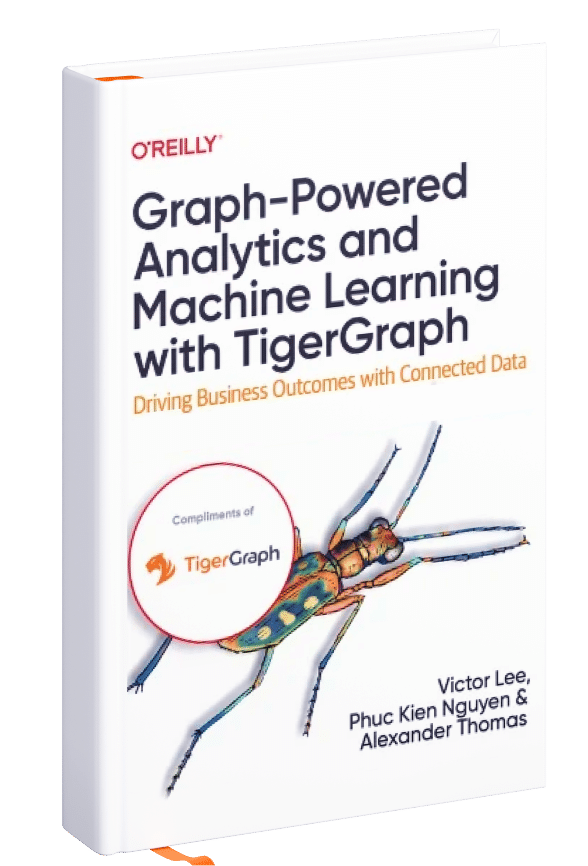
Cover of a book titled Graph-Powered Analytics and Machine Learning with TigerGraph by Victor Lee, Phuc Kien Nguyen, and Alexander Thomas. The cover features an illustrated insect and an OReilly logo.

Graph-Powered Analytics And Machine Learning with TigerGraph

A practical guide that shows data scientists, data engineers, architects, and business analysts how to get started with a graph database using TigerGraph, one of the leading graph database models available.

Cover of a book titled Graph-Powered Analytics and Machine Learning with TigerGraph by Victor Lee, Phuc Kien Nguyen, and Alexander Thomas. The cover features an illustrated insect and an OReilly logo.
Download O’Reilly Book
Smiling person with shoulder-length dark hair and glasses, wearing an orange shirt, inside an orange circle frame with a light gray background.
TigerGraph logo

Ready to Harness the Power of Connected Data?

Start your journey with TigerGraph today!

Request a Demo
Show More
A man with glasses and curly hair is looking thoughtfully to the side. He is wearing a plaid shirt and stands against a plain light gray wall with soft shadows.

Ready to Harness the Power of Connected Data?

Start your journey with TigerGraph today!