Contact Us
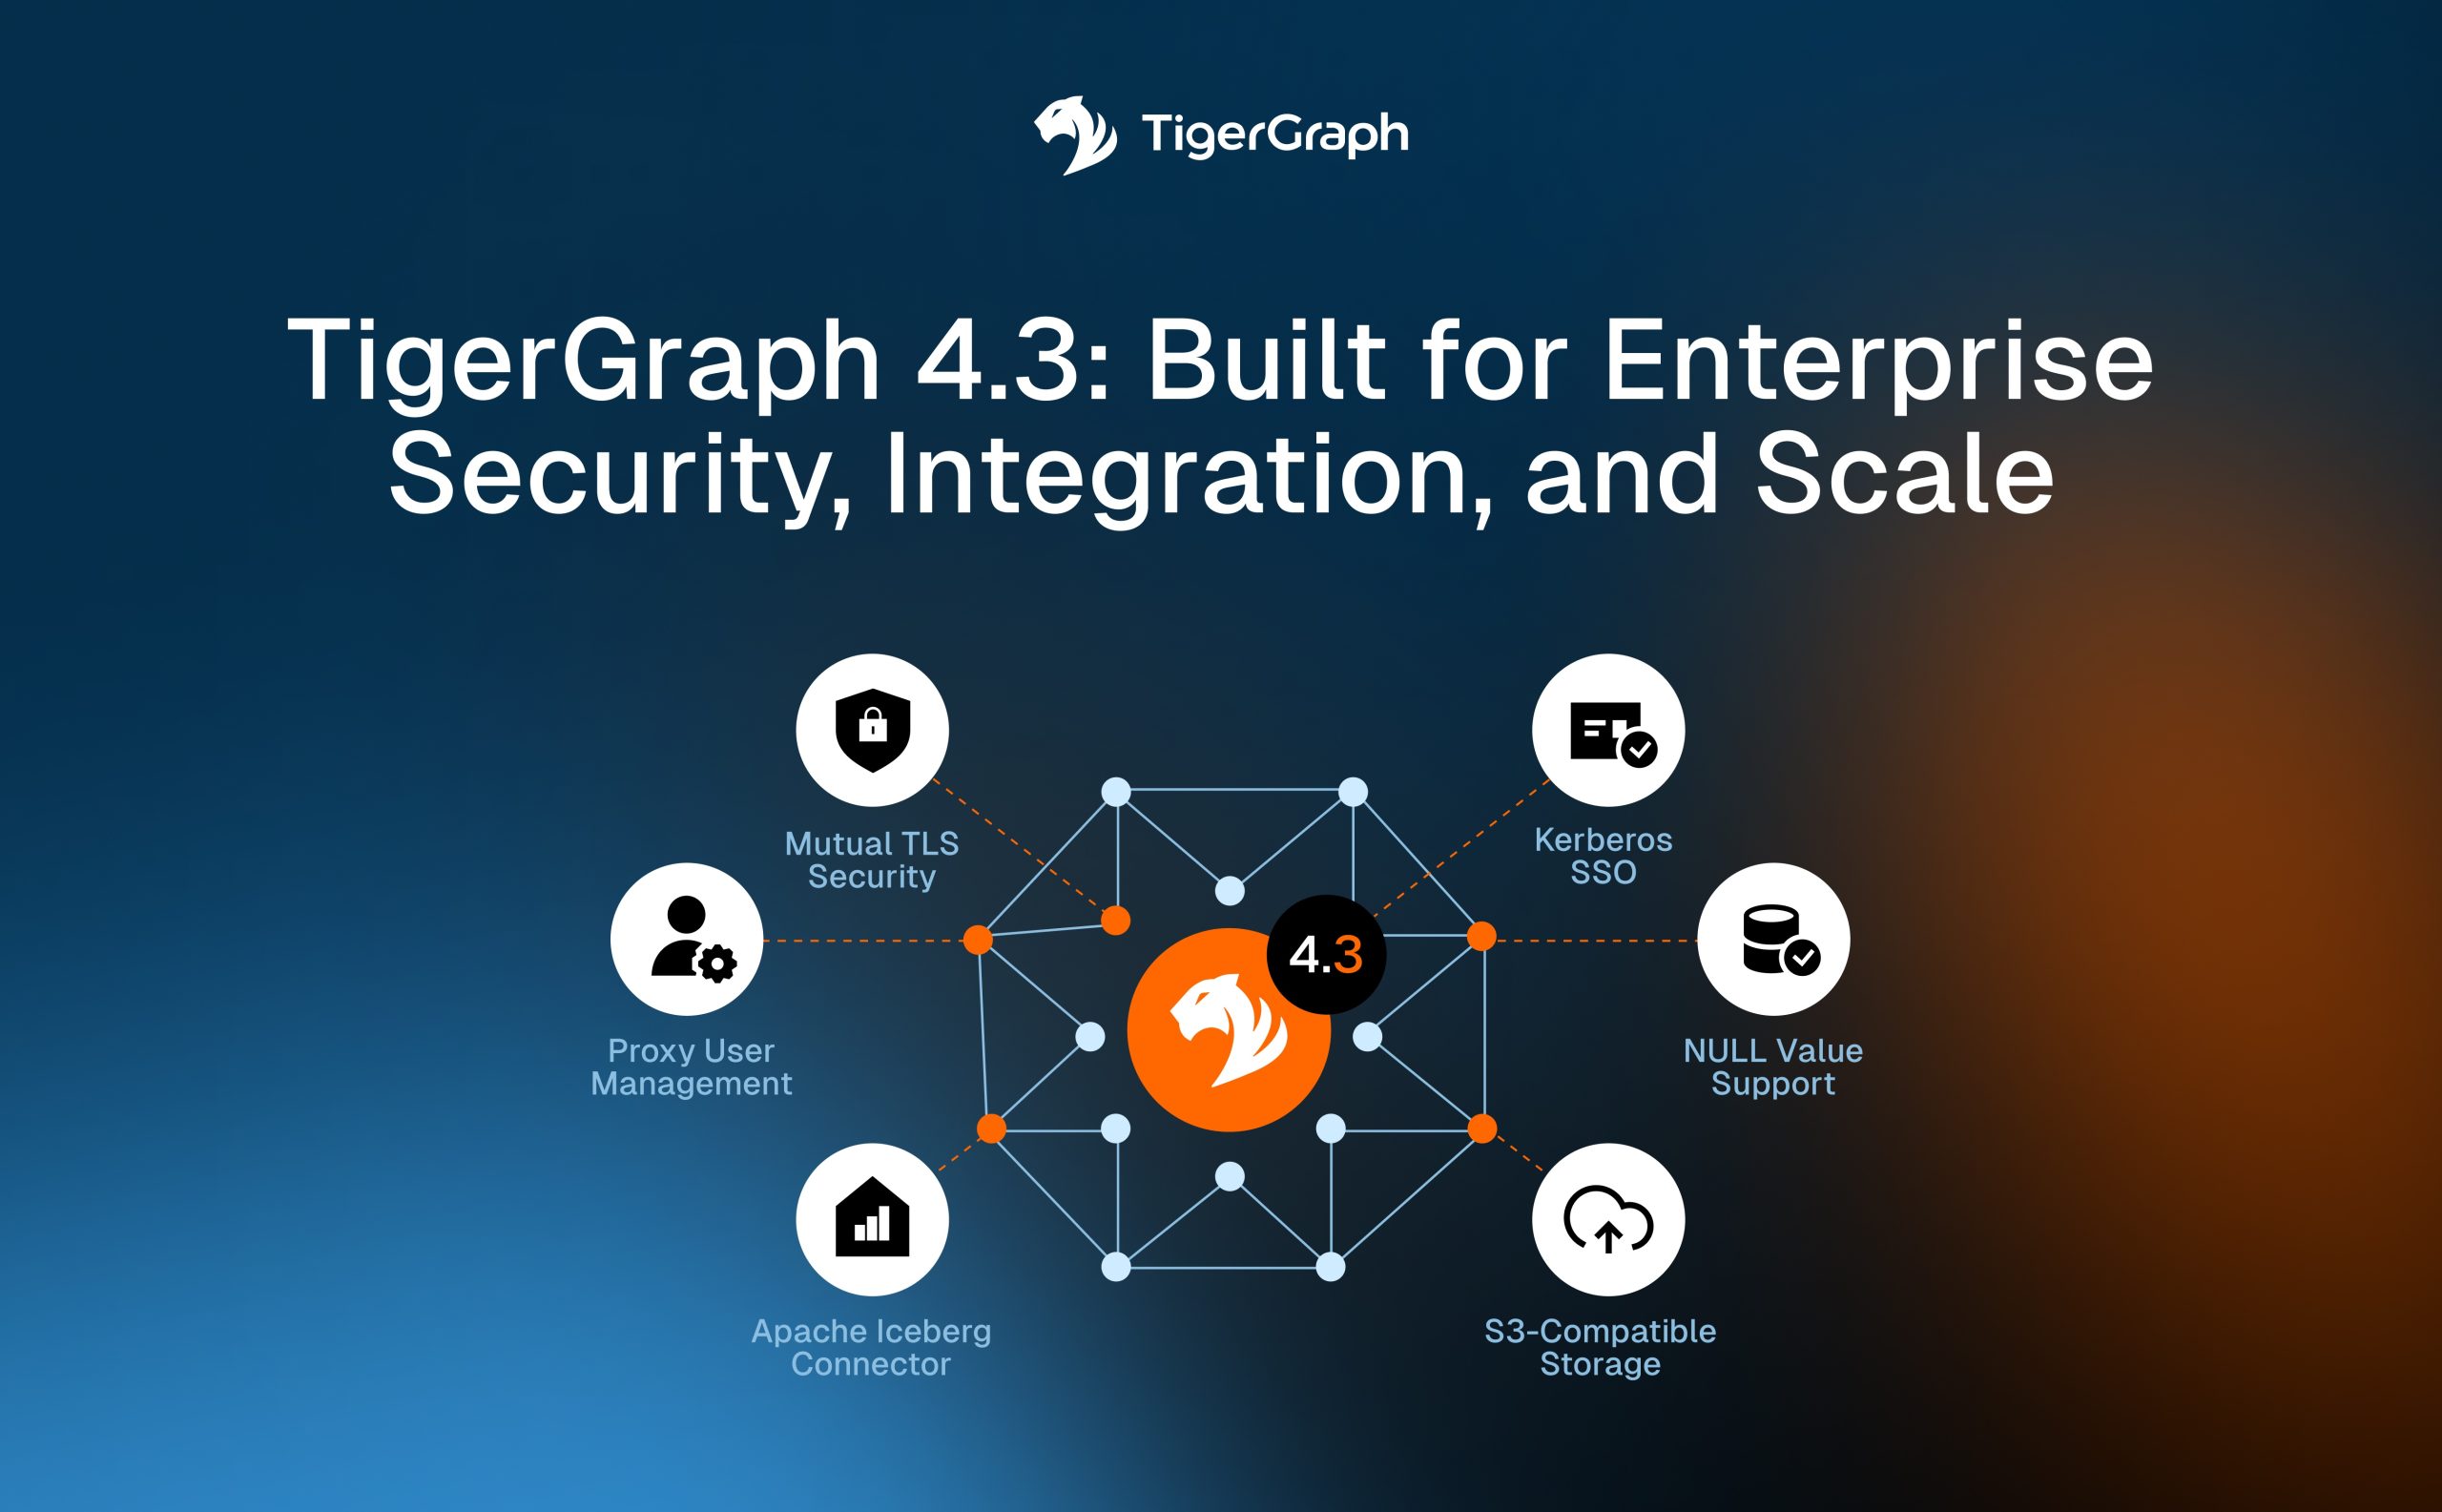
TigerGraph webinar title slide announcing "TigerGraph 4.3: Built for Enterprise Security, Integration, and Scale." A central TigerGraph 4.3 graphic is surrounded by six enterprise capabilities: Mutual TLS Security, Kerberos SSO, Proxy User Management, Apache Iceberg Connector, NULL Value Support, and S3-Compatible Storage, on a dark blue background with orange accents.
Aug 5th – TigerGraph 4.3 Built for Enterprise Security, Integration, and Scale
Discover
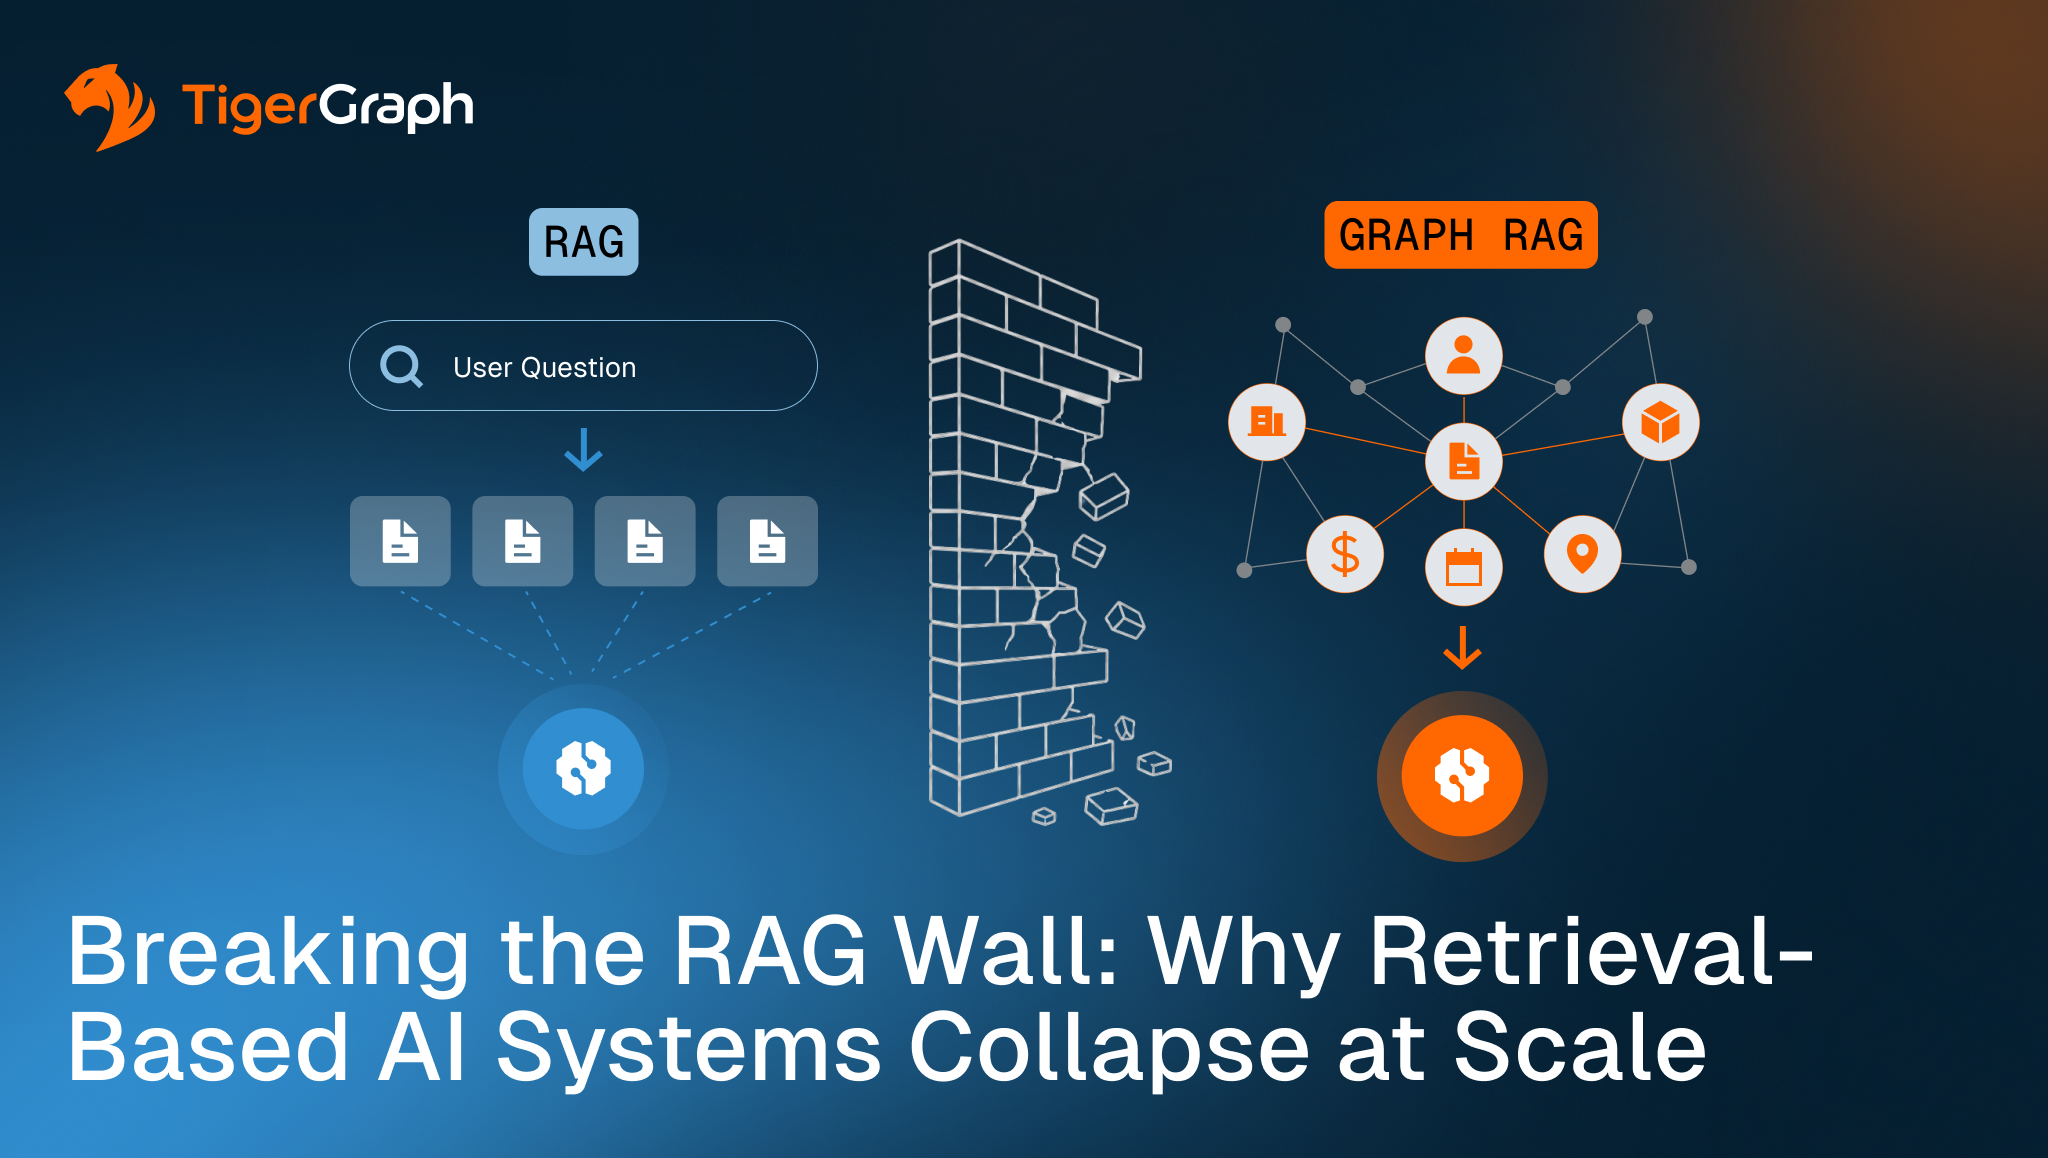
TigerGraph illustration comparing traditional RAG and GraphRAG. A brick wall separates document-based retrieval from a connected graph of entities and relationships, symbolizing how GraphRAG breaks the limitations of retrieval-only AI to deliver connected context and enterprise-scale reasoning.
Breaking the RAG Wall: Why Retrieval-Based AI Systems Collapse at Scale
Discover
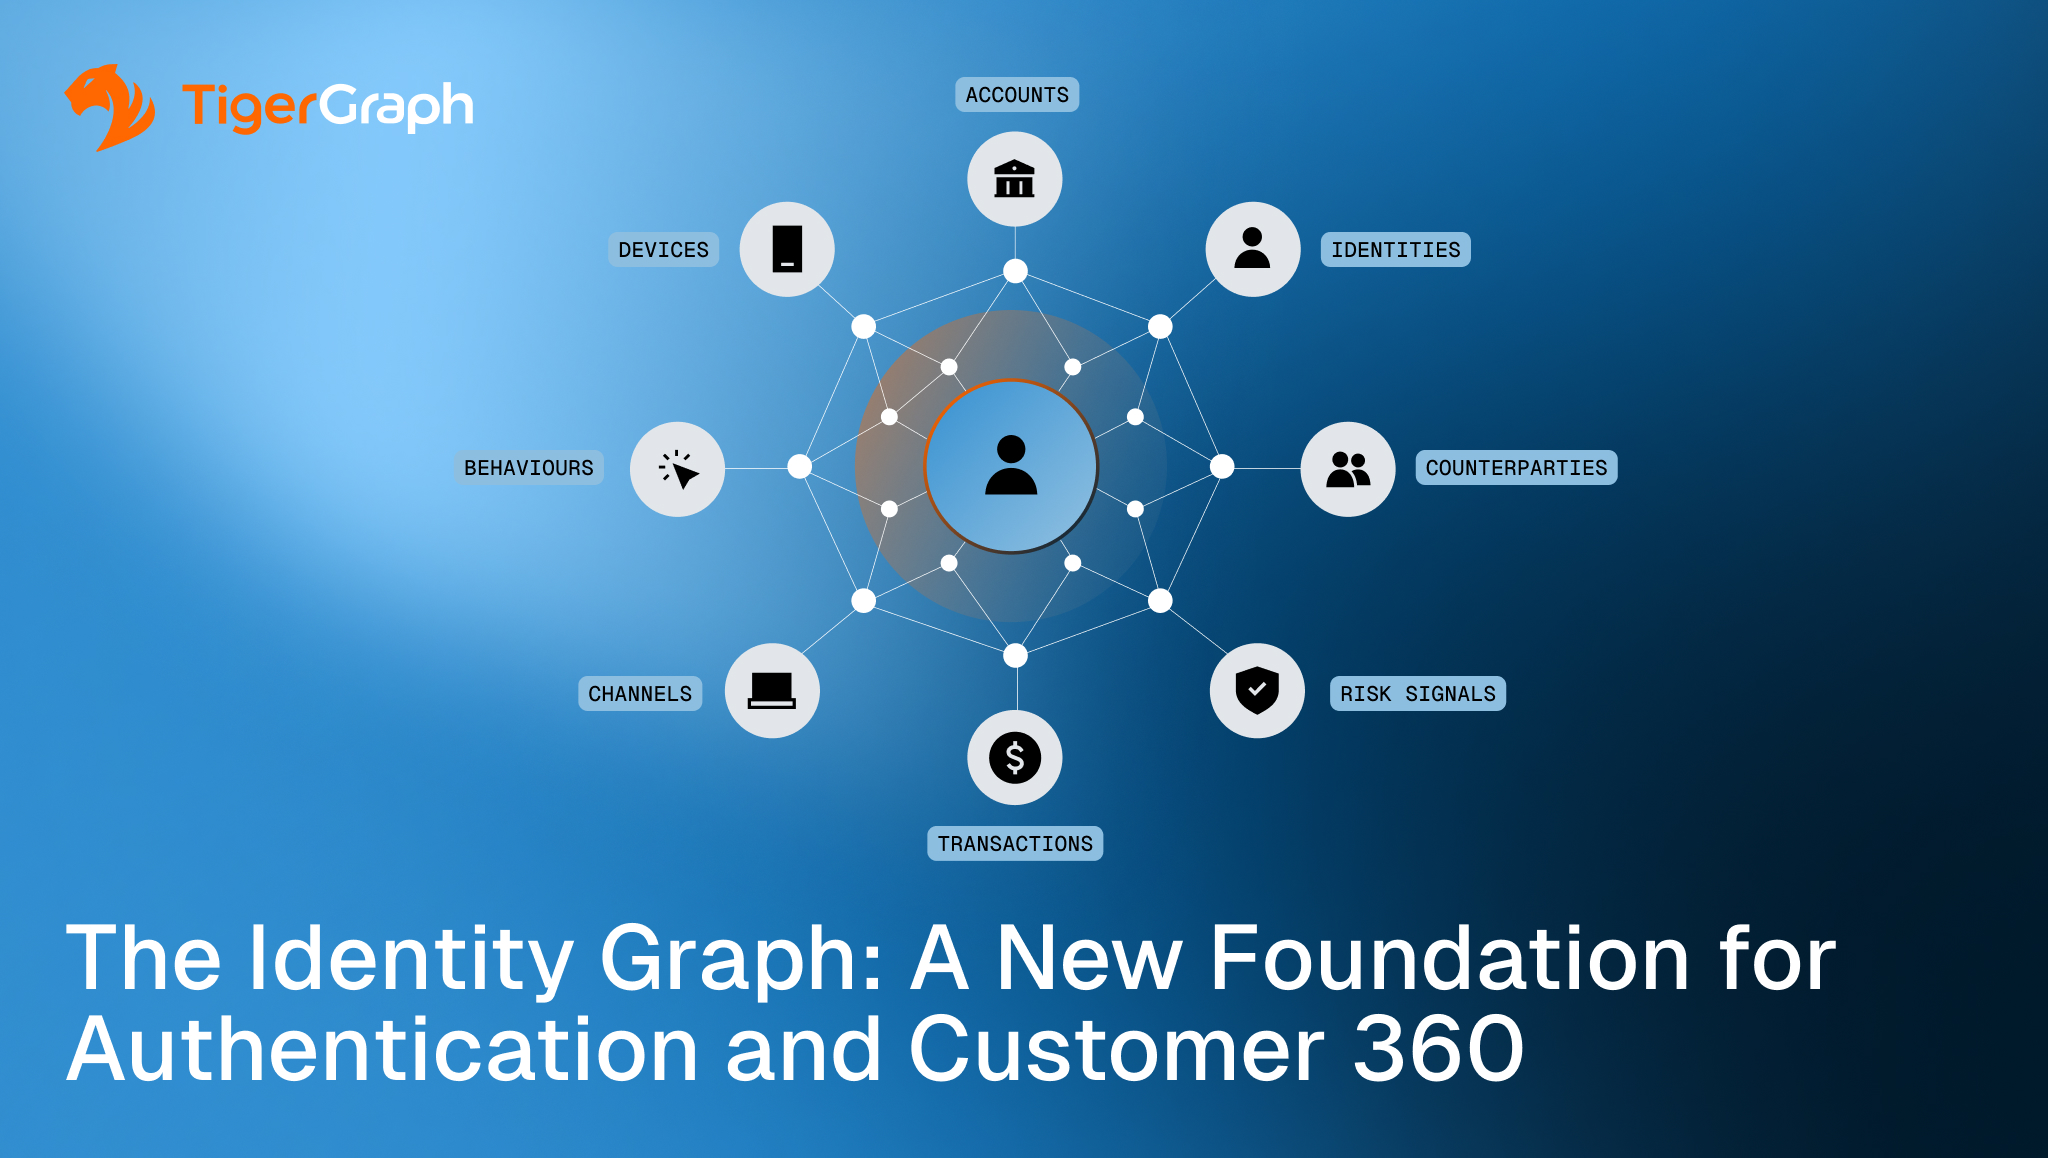
Promotional graphic illustrating the TigerGraph Identity Graph with a customer at the center of a connected network linking identities, accounts, devices, transactions, counterparties, risk signals, channels, and behaviors. Headline reads, "The Identity Graph: A New Foundation for Authentication and Customer 360.
The Identity Graph A New Foundation for Authentication and Customer 360.
Discover
June 22nd – CDO Mgz Enterprise AI Summit – Chicago
Discover
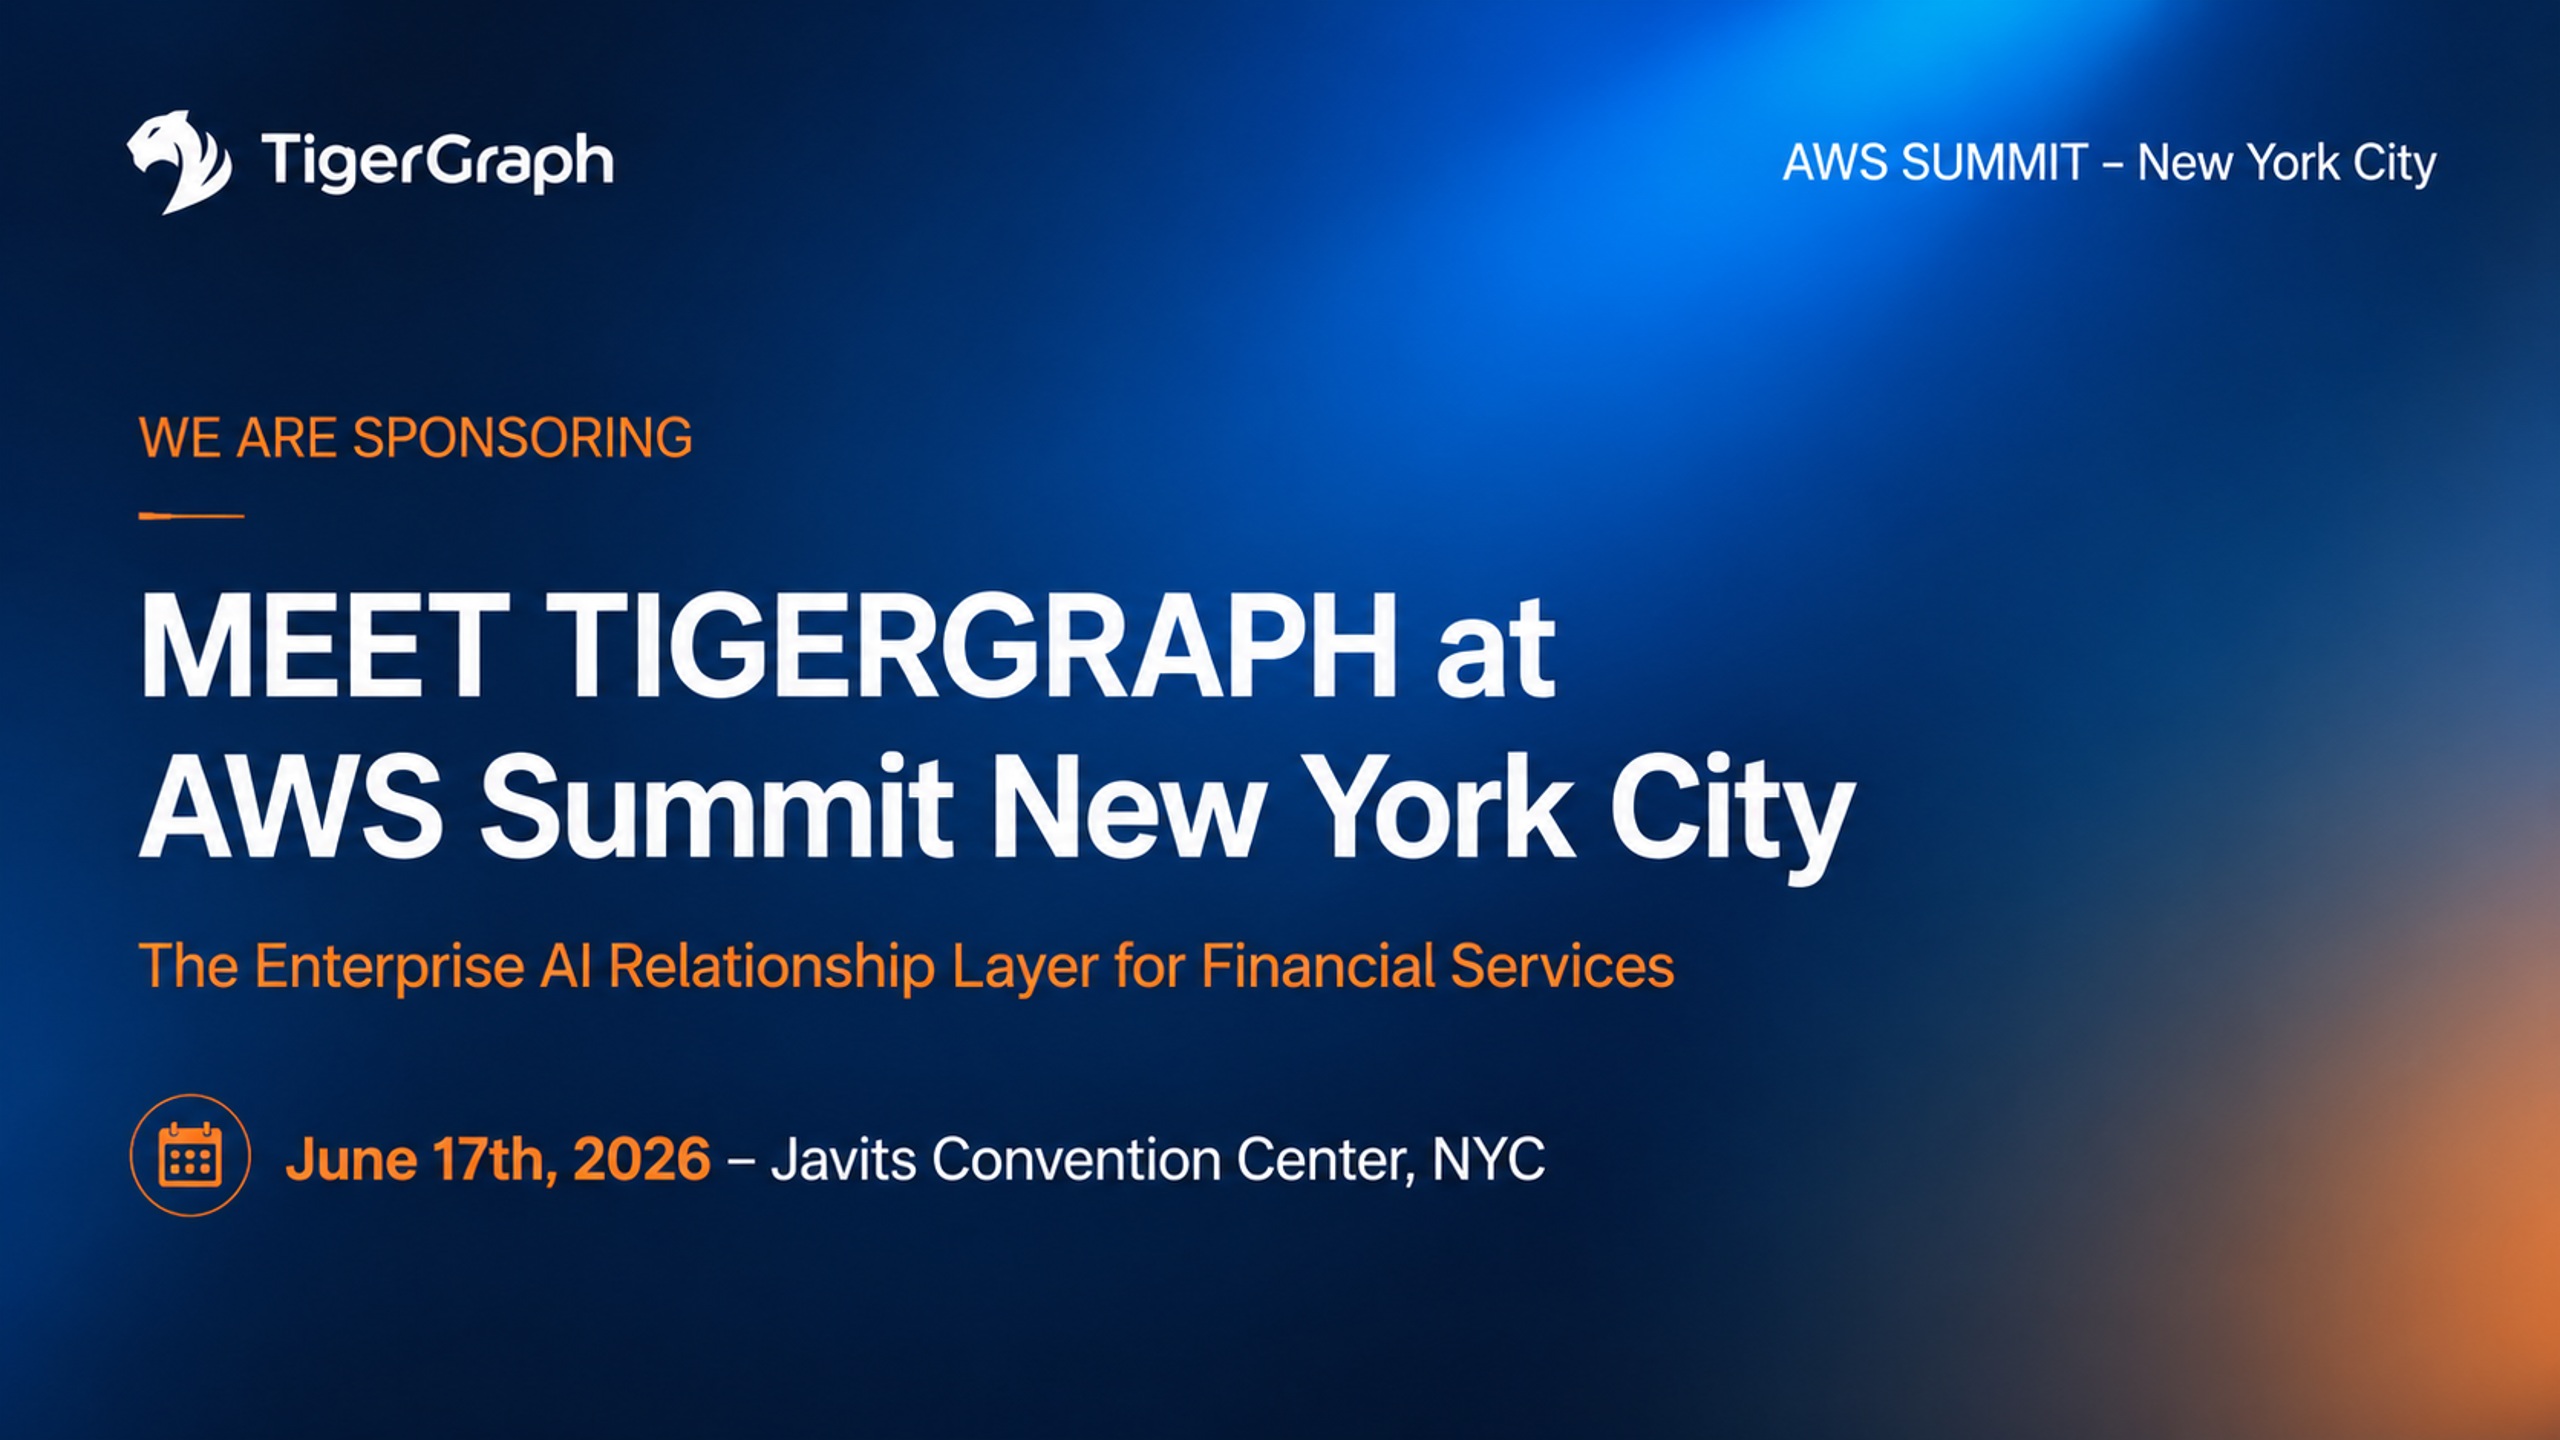
June 17th – AWS Summit – New York City
Discover
Money 20/20 – Europe
Discover
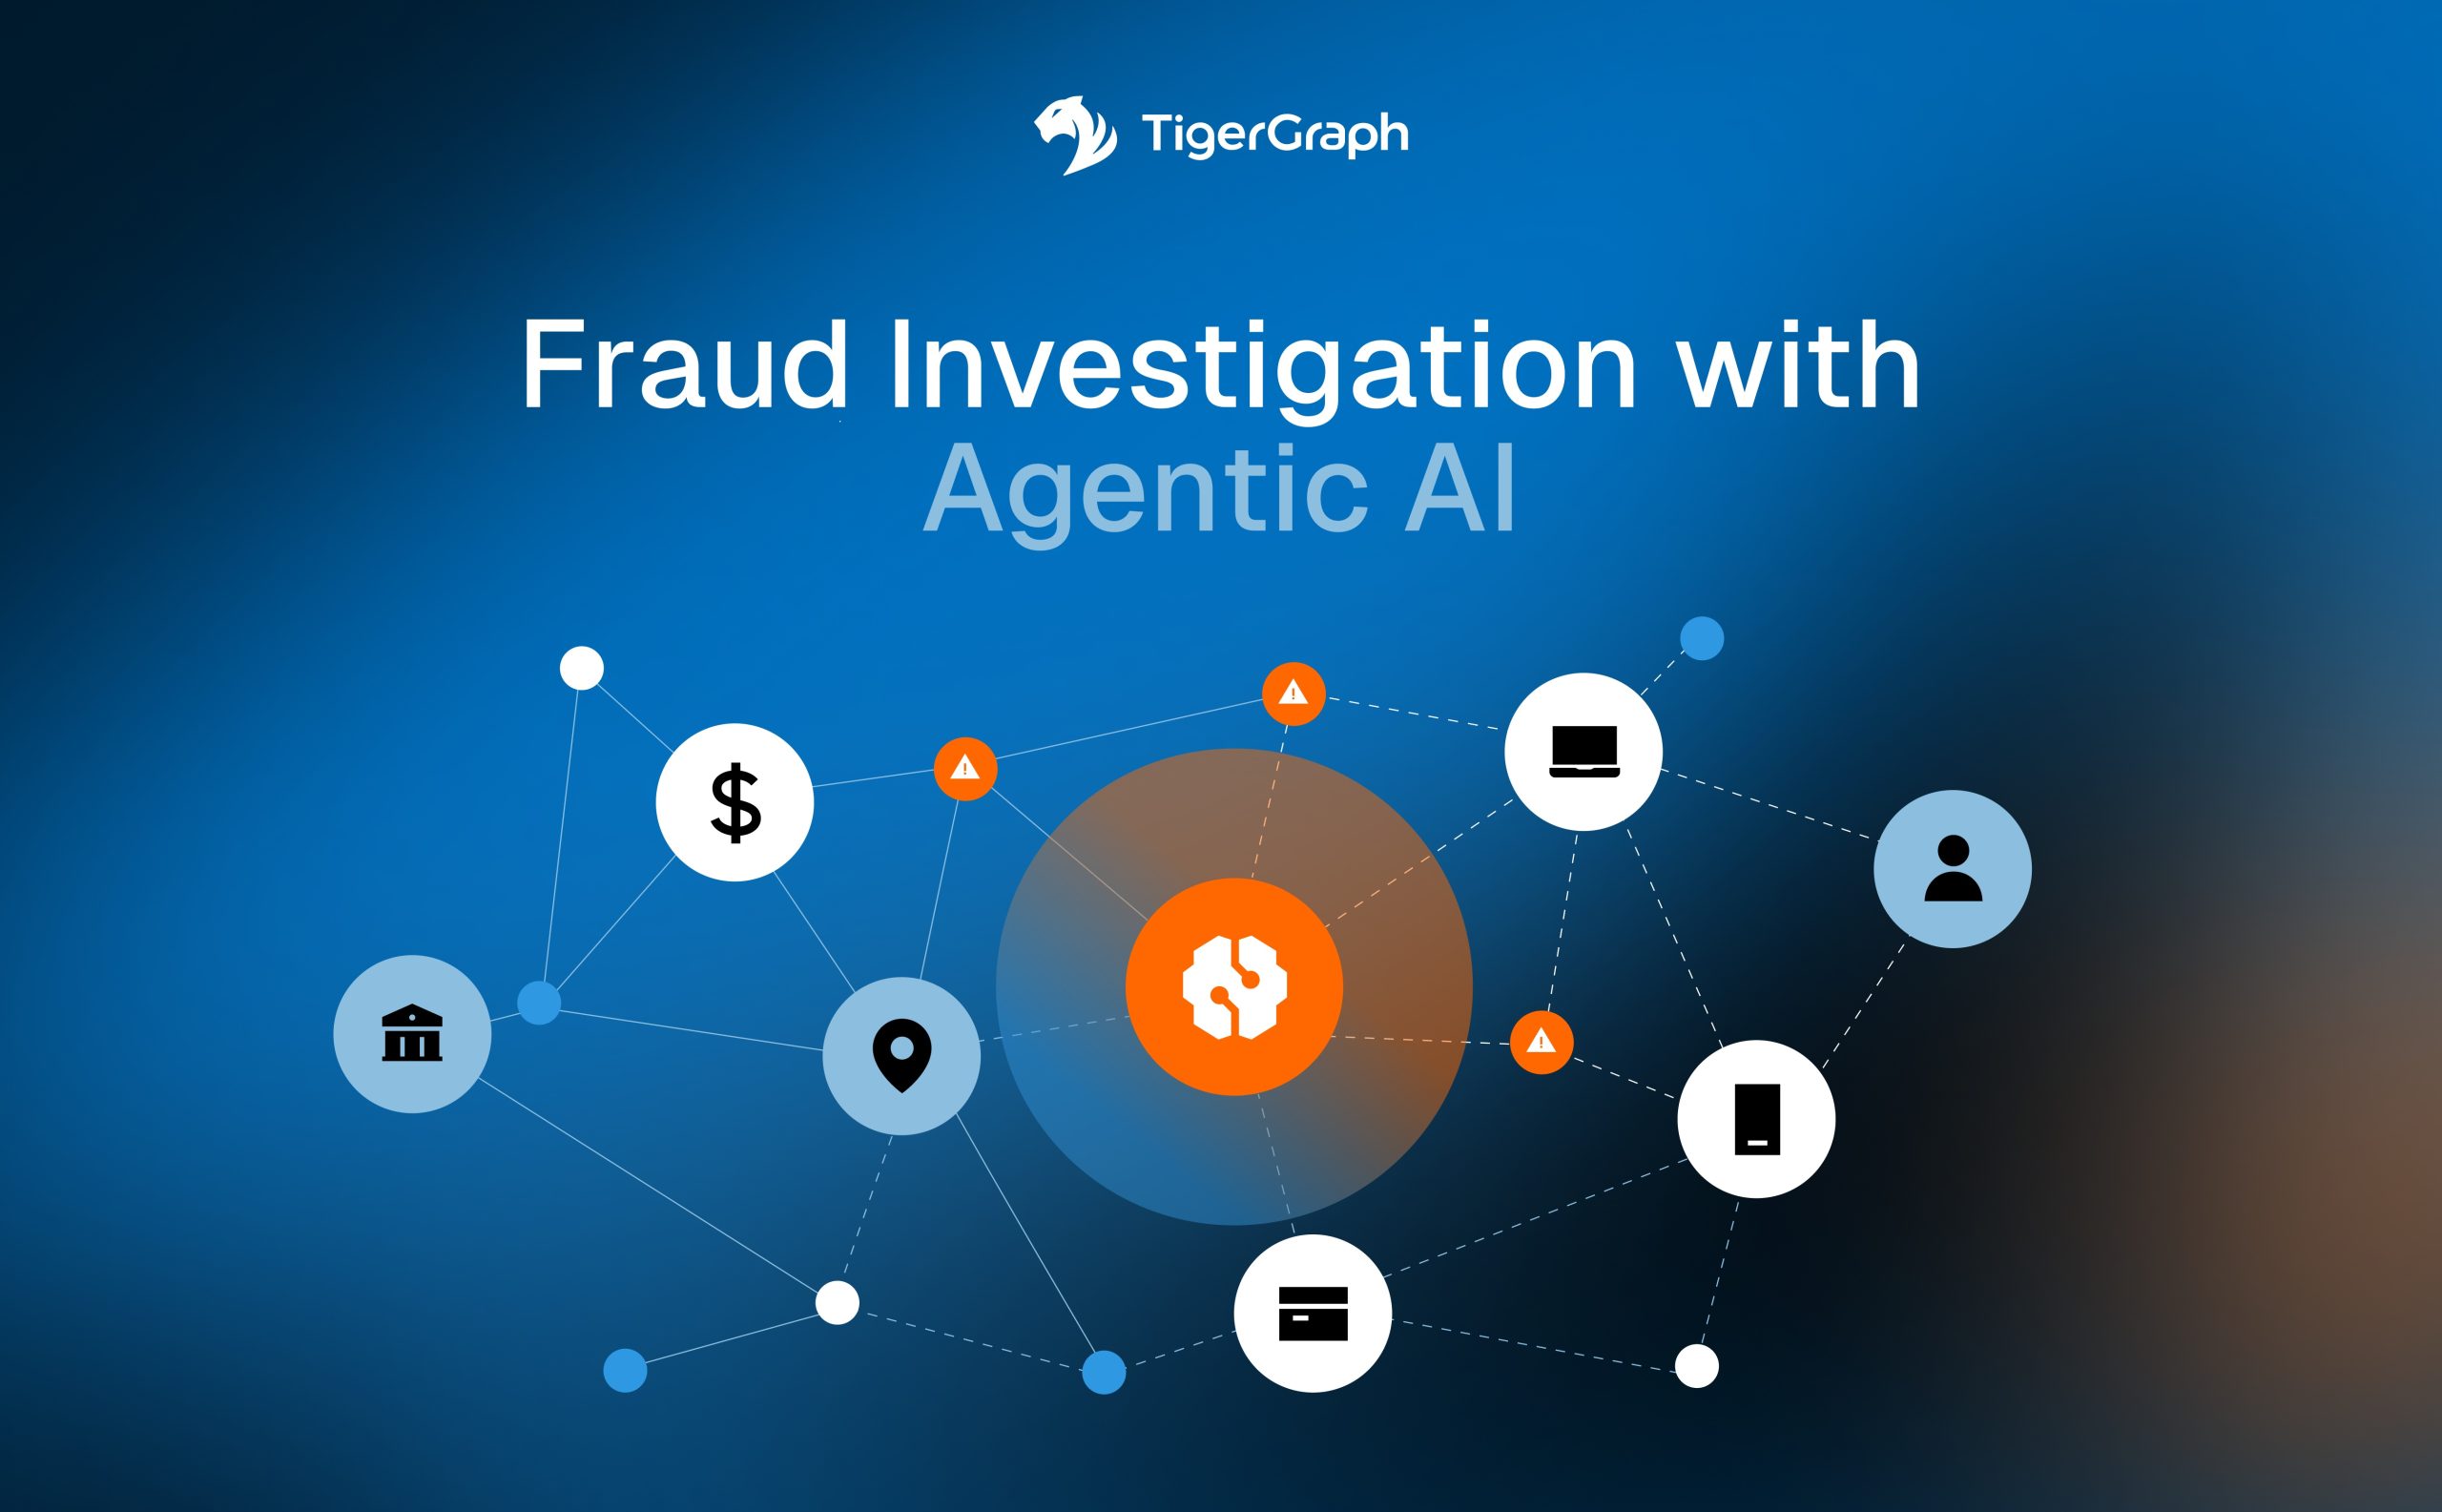
Fraud Investigation with Agentic AI
Fraud Investigation with Agentic AI: Live Demo
Discover
CDO Mgz Toronto Leadership Summit
Discover
Safeguard 2026
Discover
A network diagram with icons representing banking, security, users, and money, showing interconnected nodes on a light background. Text reads: Architecting AI That Banks Can Trust: Why Knowledge Graphs Are the Missing Layer. TigerGraph logo is in the top left.
Architecting AI That Banks Can Trust: Why Knowledge Graphs Are the Missing Layer
Discover
A network diagram with icons representing banking, security, users, and money, showing interconnected nodes on a light background. Text reads: Architecting AI That Banks Can Trust: Why Knowledge Graphs Are the Missing Layer. TigerGraph logo is in the top left.
Architecting AI That Banks Can Trust: Why Knowledge Graphs Are the Missing Layer
Discover
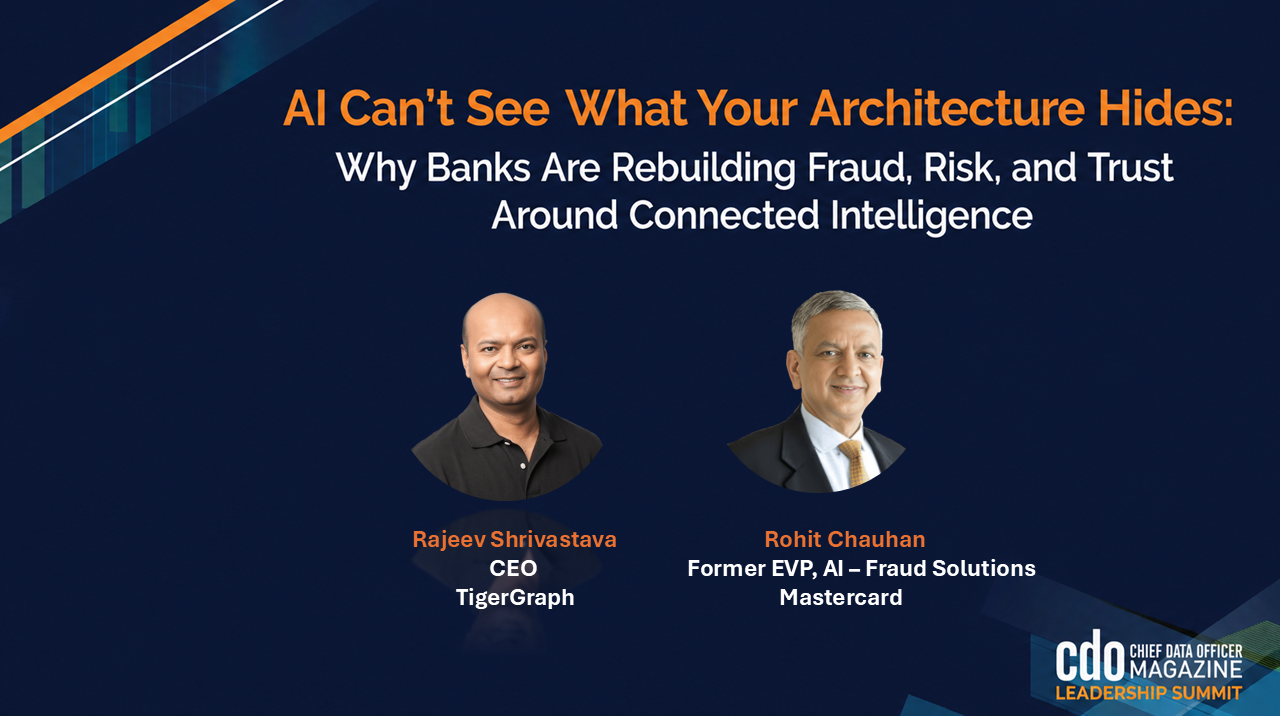
A network diagram with an orange center icon connected to various financial and technology icons, with the TigerGraph logo and the title Connected Intelligence: How Graph + AI are Redefining Fraud, Identity, and Trust in Financial Services.
Connected Intelligence: How Graph + AI are Redefining Fraud, Identity, and Trust in Financial Services
Discover
TigerGraph graphic titled “Your AI Can’t See Fraud. Here’s Why” shows reasons like single event, fragmented data, partial picture, and missed fraud. Includes portraits of Rohit Chauhan and Victor Lee, and network icons.
Your AI Can’t See Fraud. Here’s Why
Discover
TigerGraph promotional graphic with the headline Agentic AI for Fraud Detection with Graph Database: Instantly Build, Operate, and Query Graphs with TigerGraph, featuring network icons connected by lines on a blue background.
Agentic AI for Fraud: Instantly Build, Operate, and Query Graphs with TigerGraph
Discover
A digital graphic with network icons and lines illustrates fraud detection. The TigerGraph logo appears in the top left. Text reads: Stop Coordinated Fraud and Protect Revenue at Scale with Graph, next to icons for exposing fraud networks and protecting merchants.
Stop Coordinated Fraud and Protect Revenue at Scale with Graph
Discover
A soft gradient background transitioning from pale blue at the bottom to white at the top. The image is abstract and conveys a serene and calm atmosphere.
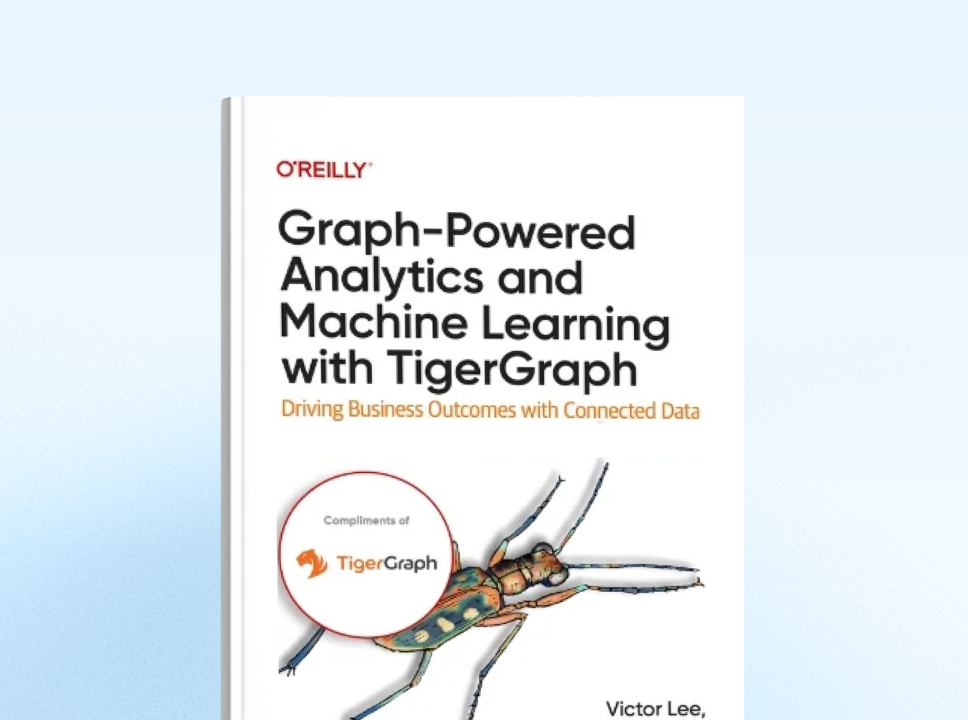
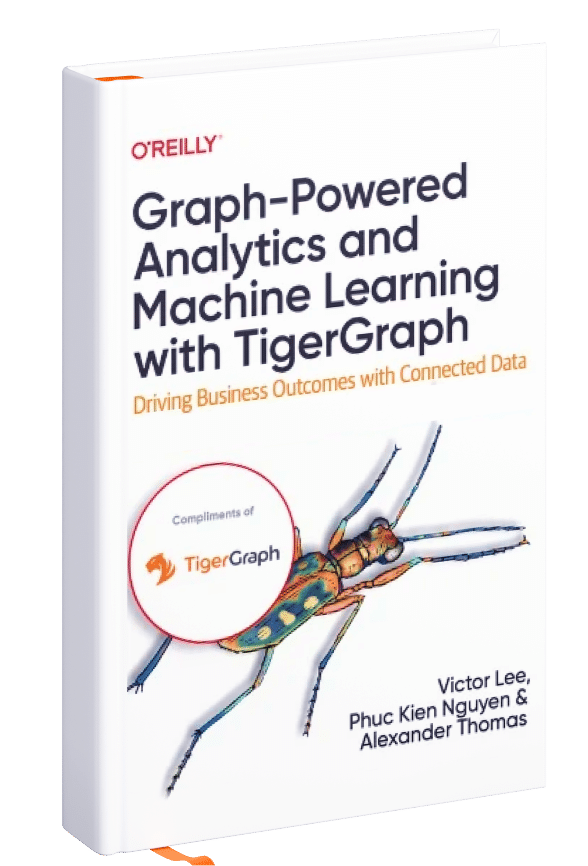
Cover of a book titled Graph-Powered Analytics and Machine Learning with TigerGraph by Victor Lee, Phuc Kien Nguyen, and Alexander Thomas. The cover features an illustrated insect and an OReilly logo.

Graph-Powered Analytics And Machine Learning with TigerGraph

A practical guide that shows data scientists, data engineers, architects, and business analysts how to get started with a graph database using TigerGraph, one of the leading graph database models available.

Cover of a book titled Graph-Powered Analytics and Machine Learning with TigerGraph by Victor Lee, Phuc Kien Nguyen, and Alexander Thomas. The cover features an illustrated insect and an OReilly logo.
Download O’Reilly Book
Smiling person with shoulder-length dark hair and glasses, wearing an orange shirt, inside an orange circle frame with a light gray background.
TigerGraph logo

Ready to Harness the Power of Connected Data?

Start your journey with TigerGraph today!

Request a Demo
Show More
A man with glasses and curly hair is looking thoughtfully to the side. He is wearing a plaid shirt and stands against a plain light gray wall with soft shadows.

Ready to Harness the Power of Connected Data?

Start your journey with TigerGraph today!