Contact Us
Back to Blog

Paige Leidig

Chief Marketing Officer

Paige brings over 20 years of experience in enterprise marketing leadership, with a strong background in brand building, driving growth, product and customer marketing. As Chief Marketing Officer, he leads our marketing efforts to increase brand awareness, communicate our unique value proposition, drive growth across key markets, and showcase the positive impact we deliver to our customers. Prior to joining TigerGraph, Paige has held executive marketing leadership roles at several notable and category defining organizations, including SIMCO Electronics, Simpplr, Quid, CipherCloud, SAP, and Ariba. Paige holds a MS in Finance from the University of Houston and a BS in Chemistry from Davidson College (alma mater of basketball star Steph Curry). In his spare time he likes to travel and surf all over the world, go hiking in the sierras, play squash, do CrossFit, and spend time with family and friends.

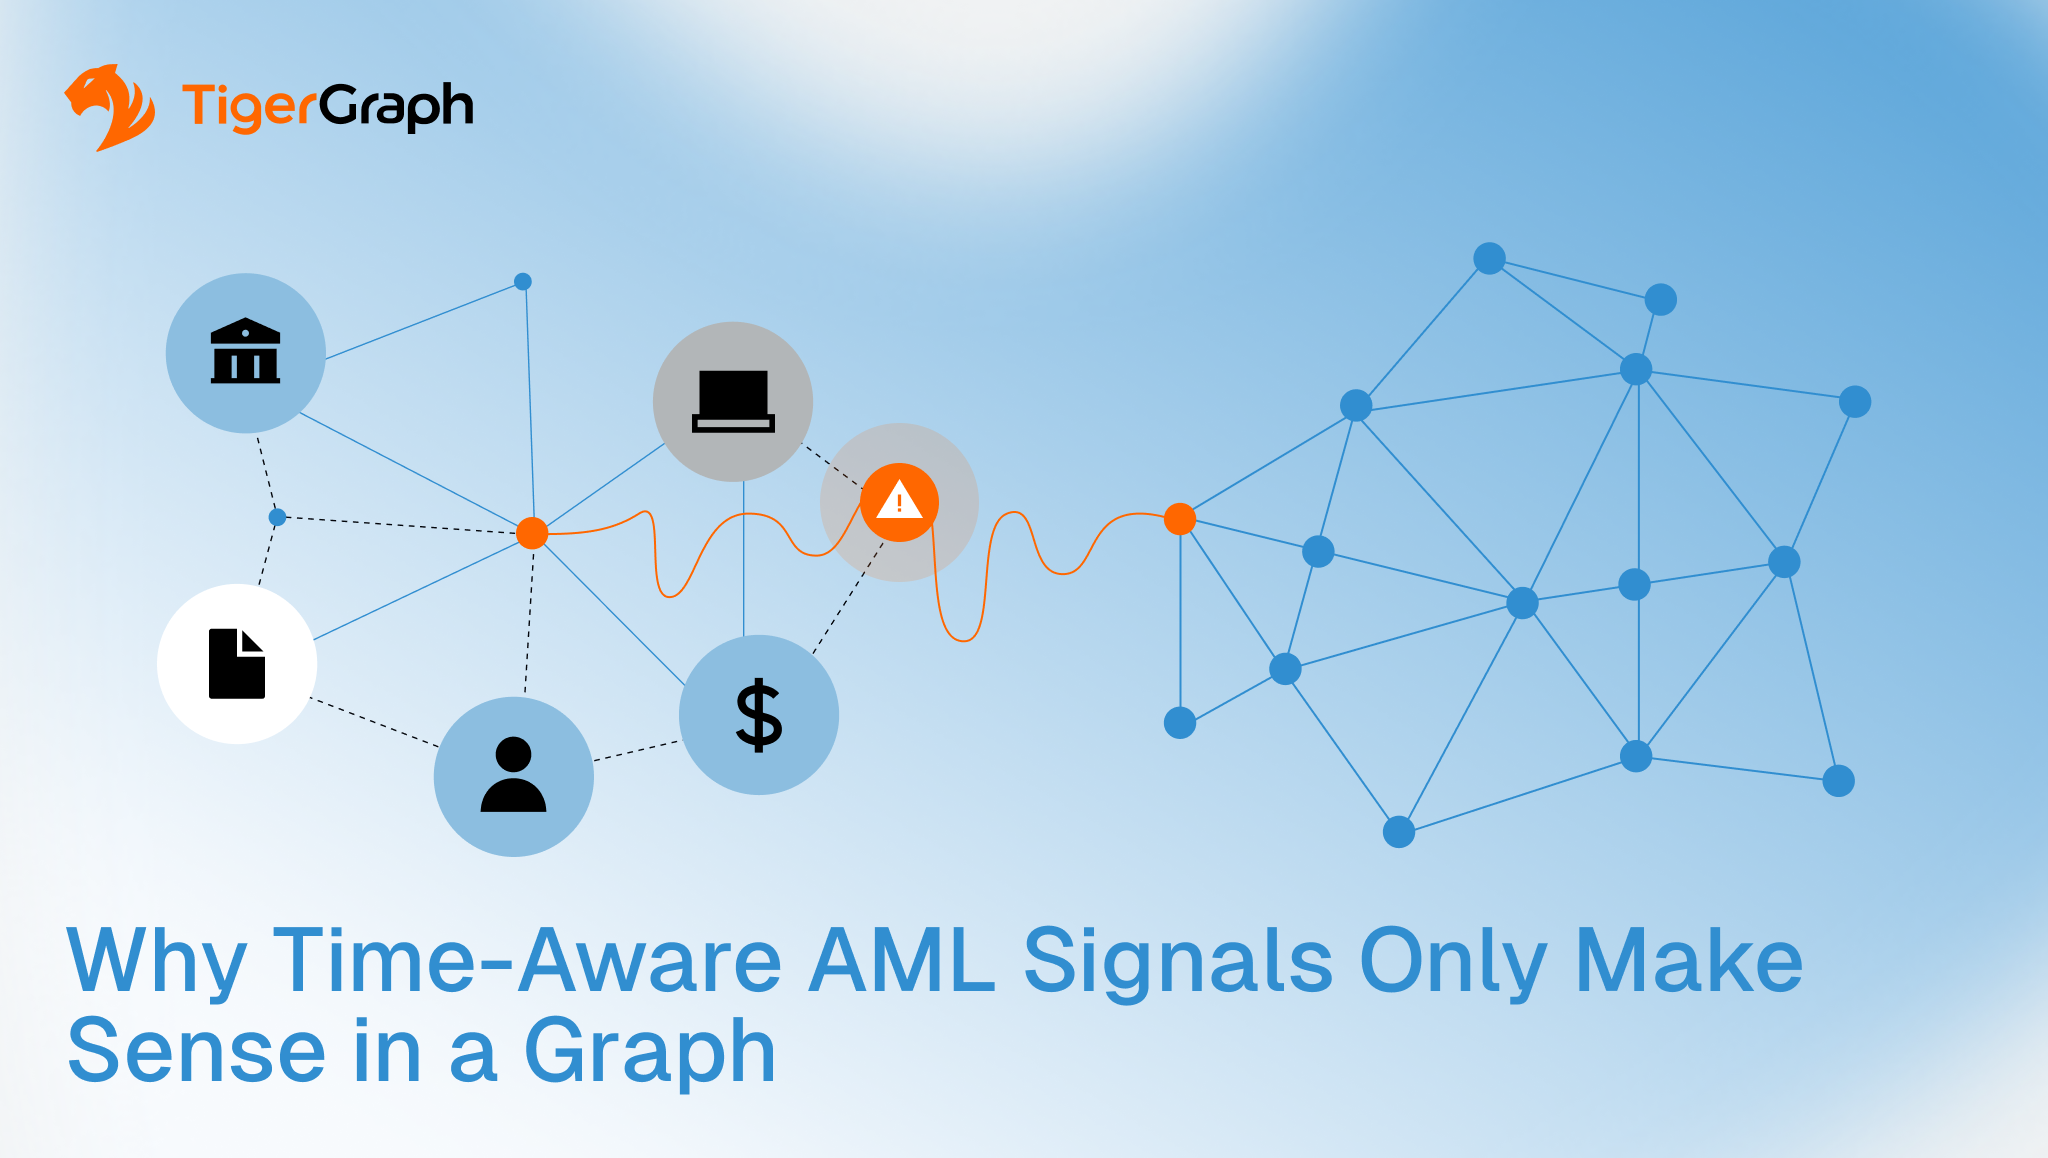
A network graph shows icons for a bank, person, document, laptop, and dollar sign, connected by lines to a cluster of blue nodes. Text reads: Why Time-Aware AML Signals Only Make Sense in a Graph. TigerGraph logo is in the top left.
Why Time-Aware AML Signals Only Make Sense in a Graph
Discover
A graphic from TigerGraph showing a glowing donut chart with the text: Your AI cost problem isn’t training. It’s inference. and 70–80% of AI cost is inference. The phrase Fix Inference appears at the bottom.
Your AI Cost Problem Isn’t Training. It’s Inference.
Discover
A graphic shows a stable entity with a shield icon in blue, a fragile entity with a warning icon in orange, and a risk alert connecting them. Text reads: Why Entity Resolution Risk Scoring Needs Graph. TigerGraph logo is at the top left.
Why Entity Resolution Risk Scoring Needs Graph
Discover
Diagram showing two records (A and B) with similar info linked to a merged ID. Network nodes connect the records, illustrating how explainability in entity resolution decisions shows why records were linked or merged.
Explainability in Entity Resolution Decisions Shows Why Records Were Linked or Merged
Discover
Infographic with the TigerGraph logo, five labeled graphs illustrating key graph algorithms: Centrality, Community Detection, Pathfinding, Similarity, and Ranking. Text reads: The Five Graph Algorithms Every Data Leader Needs to Know.
The Five Graph Algorithms Every Data Leader Needs to Know
Discover
Diagram illustrating temporal conflicts in entity resolution, showing connections between past, present, and future events, warning icons, and conflicting information between entities. TigerGraph logo and title appear at the bottom.
Why Temporal Conflicts in Entity Resolution Cause Chaos
Discover
A central orange AI circle connects with icons representing shopping, health, banking, money, business, and shipping. TigerGraph logo appears in the top left. Text below reads, Redefining Enterprise Automation with Agentic AI.
Redefining Enterprise Automation with Agentic AI
Discover
Two network diagrams compare a disorganized data dump with unclear structure to a clear 360 model with readable connections, highlighting the benefits of using 360 Models and GraphStudio for graph analytics. TigerGraph logo is present.
The Fastest Way to Start with Graph Analytics: 360 Models + GraphStudio
Discover
Show More