Understanding Network Escalation and Risk Propagation in AML
In anti-money laundering programs, risk rarely exists in isolation. Although a transaction might look routine on its own, the surrounding pattern can be the real issue. That is why many AML programs escalate based on connection and repetition, not only event severity. This is sometimes called risk propagation, where the risk can extend across connected entities because of shared behavior, shared infrastructure, or other exposure patterns. The AML program defines how that connected exposure is measured and prioritized for review.
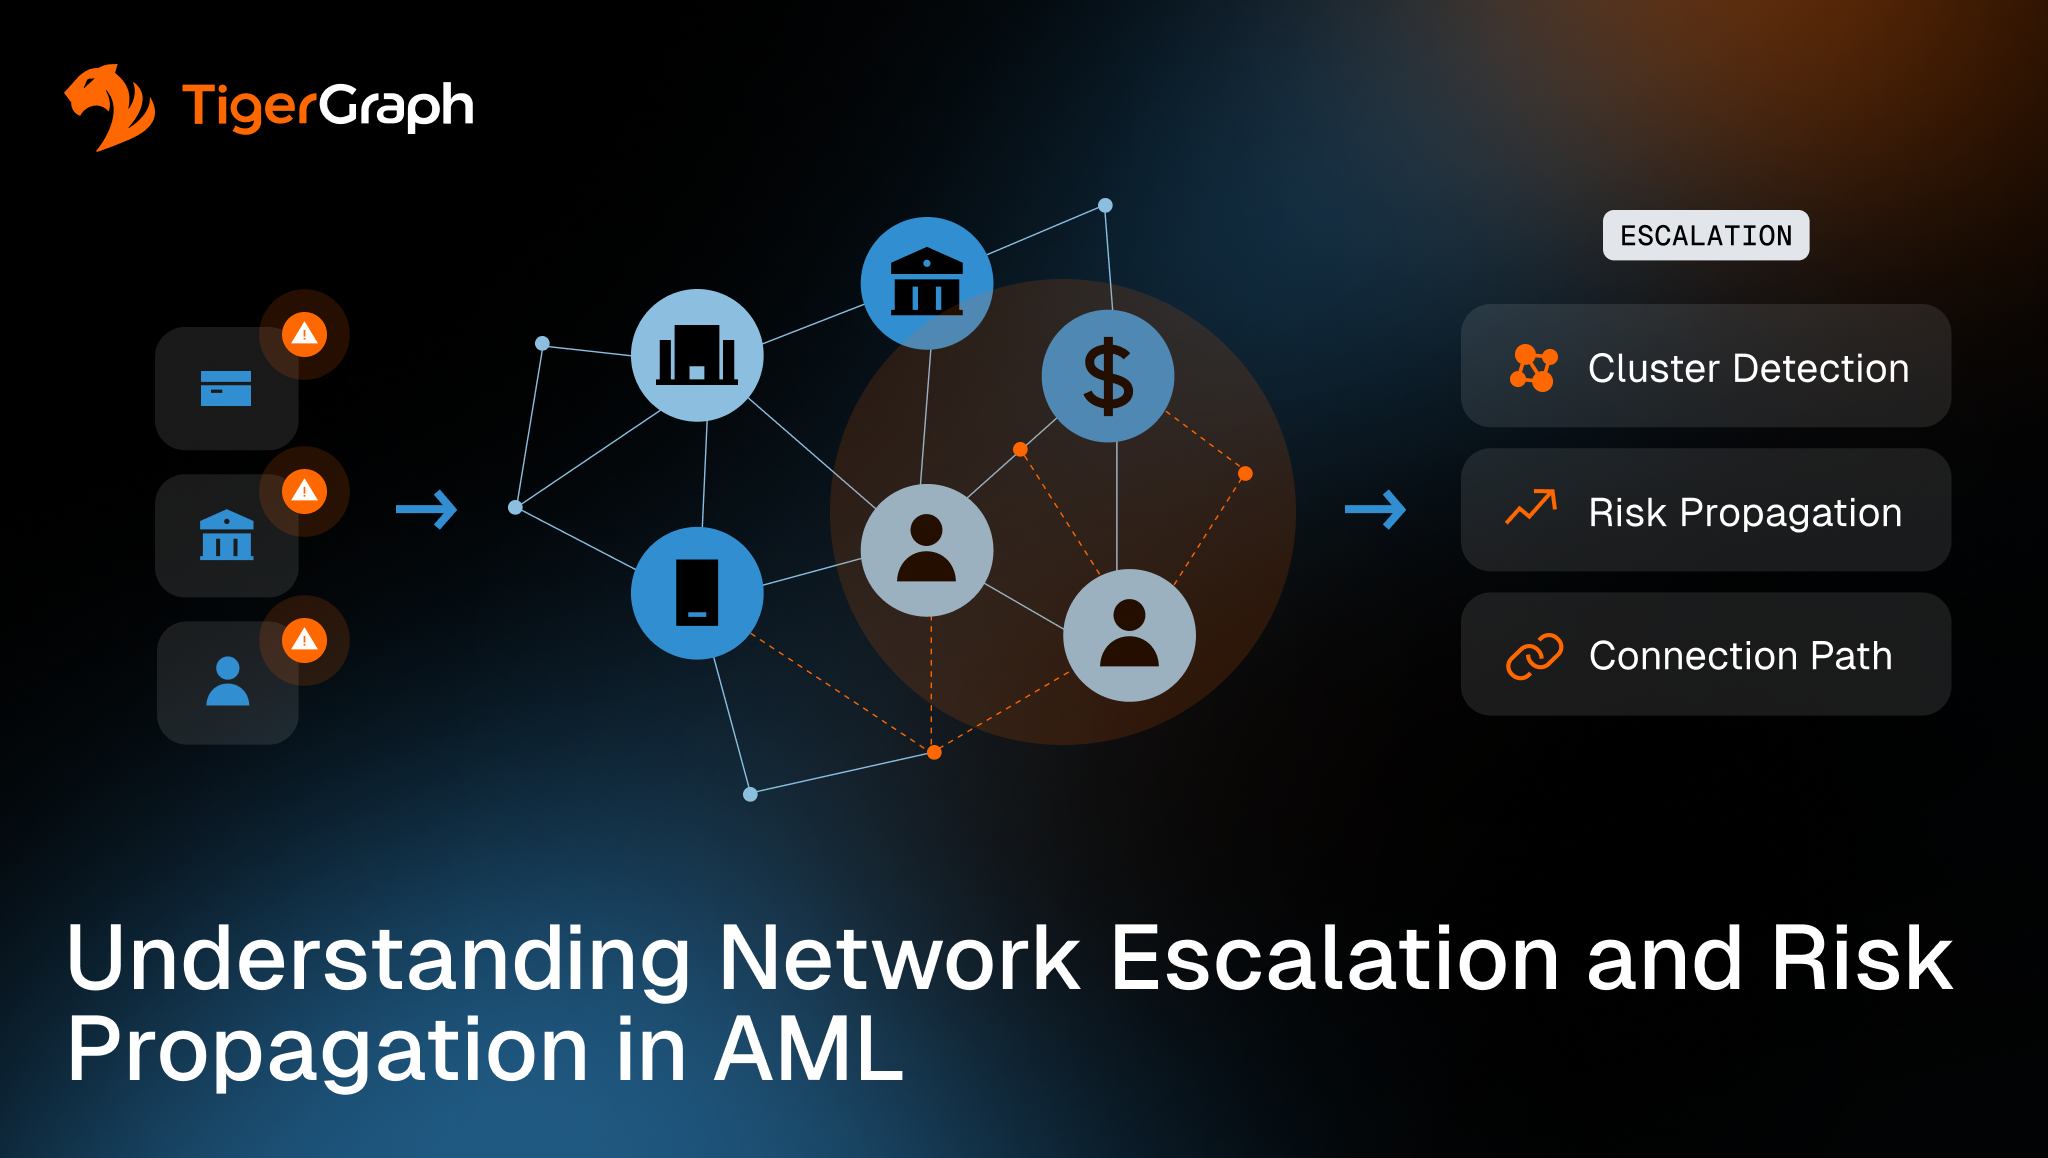
Graph analysis supports this workflow because it can group related alerts, apply the bank’s risk prioritization across relationships, and return the connecting paths reviewers need to see. The sections below outline common network escalation signals and the reviewable evidence that supports them.
Key takeaways:
- You can miss the story when you review alerts one at a time. Clustering, or grouping related alerts based on shared connections, can reveal when several small items are really one connected situation.
- Propagated risk helps with prioritization. It reflects how connected exposure is evaluated across linked entities. It does not confirm wrongdoing, though.
- Weak signals get louder when they repeat in the same connected group. Consistency across links is often the point, not any single alert.
- Reviewers need the connection trail. An escalation holds up better when you can show how exposure built across relationships, not just share a score.
Why Escalation Becomes a Network Problem
Alert volume is a significant challenge for AML, and fragmentation is another. One alert points to an account, another points to a counterparty, and a third points to a shared address or device identifier. None of those alerts is decisive alone, but together they may describe a connected situation. That is the shift that turns escalation into a network question.
This is where escalation changes shape. The decision shifts from “is this one alert severe” to “is this alert part of a connected pattern that is growing.”
Network Escalation Signals That Help Teams Make Decisions:
These signals help teams decide when a set of alerts should be treated as a single connected situation, rather than a pile of unrelated cases. Again, none of them prove wrongdoing on their own, but they do support prioritization, investigation and review.
- Alert clustering across connected entities or accounts
Example: Three alerts look separate. One is for unusual deposits on Account A, one is for fast outbound wires on Account B, and one is for a new payee on Account C. On review, all three accounts share the same phone number and log in from the same device. Instead of three cases, it becomes one connected situation. - Risk inheritance through program-defined exposure
With risk inheritance, a connected account is elevated because your program treats a specific relationship as exposure-relevant. Example: A small business account has no direct alerts, but it shares a beneficial owner with a higher-risk entity already under review. Your program treats beneficial ownership as exposure-relevant, so the small business gets elevated for review. The escalation write-up shows the ownership chain that connects them. - Weak-signal reinforcement inside a connected group
Example: One account makes occasional round-dollar transfers. Another account has intermittent address changes. A third account uses a new counterparty every week. None of this is decisive alone. When the same behaviors repeat across a connected cluster of accounts, linked through shared identifiers or repeated connections, and the group follows the same intermediary and destination corridors, the combined pattern can warrant escalation. - Risk propagation across a network under policy constraints
Example: Your program rule says, “If an entity is within two relationship steps of a flagged entity through approved relationship types, increase review priority.” An entity that is one hop away through a shared controller is elevated. Another entity two hops away through shared infrastructure is also elevated. Each elevation includes the exact chain of connections that triggered it, within the defined hop limit. - Escalation driven by concentration and spread
Example: Ten alerts appear over two weeks. Eight of them fall inside the same connected group that shares the same deposit channel and the same intermediary route. As the period continues, two new accounts enter the cluster through shared devices and immediately show similar behavior. The pattern is not “ten random alerts.” It is one cluster concentrating risk and expanding.
Each signal is revealed faster (or at all) thanks to graph analysis.
What Graph Adds
Graph analysis improves both detection and explanation because relationships are stored directly in the data model, and the workflow can return the connecting path for review.
Graph workflows support grouping alerts based on shared entities and shared infrastructure. They also support expanding from one alert to connected entities when escalation requires more context.
Most importantly, graph workflows can preserve the connecting paths used to assemble that context. That matters because escalation decisions need a rationale reviewers can see. A score is not a rationale, but a reviewable path is.
Graph outputs also support practical path details that reviewers understand.
- Hop count that shows how many relationship steps connect an entity to exposure
- Relationship types, meaning the kind of connection used such as ownership, control, shared identifiers, or transaction routing that show what kind of connections were used
- Cluster membership that shows whether activity concentrates inside a connected group or appears scattered
Keep scoring, weighting and thresholds based on your program’s rules, not as universal truths. Even if you use a score, the output should still show the connection trail that led to it so reviewers can verify the rationale.
How TigerGraph Fits
Network escalation works best when the workflow can do two things at once. It has to expand context quickly and it has to show its work.
Graph analysis supports this in general because it keeps relationships directly usable and returns the connection trail a reviewer can inspect. TigerGraph fits when teams need that same connected workflow to hold up as investigations grow, without slowing down or changing definitions case by case.
TigerGraph supports repeatable queries for step-by-step expansion across connections and relationship pattern checks. The practical value is consistency. The same escalation logic can be applied across analysts, queues, and time windows, and the output can include the specific connection paths used to justify the escalation.
Conclusion
Move from “we think these alerts are connected” to “we can prove why we treated them as one case.”
- Write down your escalation definition. Specify what “connected” means in your program. Include relationship types that count and how far the review is allowed to expand.
- Standardize what gets grouped. Decide which shared elements trigger clustering. Examples include shared devices, shared addresses, repeated intermediaries, or repeated corridor choices.
- Make the rationale review-ready by default. Require every escalation to include the connection trail that explains it, not only an alert summary or a risk label.
- Keep conclusions disciplined. Escalation and propagation raise priority for review. They do not confirm wrongdoing.
If your escalation outcomes vary depending on who reviews the case or which tool they start in, you have a consistency problem, not just a data problem. That is where a graph workflow and TigerGraph in particular are worth evaluating. Reach out to learn more.
Frequently Asked Questions
1. What is Network Escalation in AML and Why does it Matter?
Network escalation is the process of identifying AML risk based on how entities are connected—not just what each transaction shows individually. It matters because financial crime rarely appears in a single event. It emerges across networks of accounts, identities, and behaviors over time. Without a connected view, risk remains hidden.
2. What is Alert Clustering in AML and Why does it Matter?
Alert clustering groups alerts that share connections—such as common accounts, devices, identifiers, or transaction routes—into a single investigative context. It matters because what looks insignificant in isolation often becomes meaningful when viewed as part of a connected pattern. Clustering turns fragmented alerts into a coherent signal.
3. Does Risk Propagation Prove Money Laundering?
No. Risk propagation does not prove money laundering or intent—it prioritizes where to look next. It applies program-defined rules to extend exposure across relationships, helping investigators focus on connected entities that may share risk. The outcome is prioritization, not proof.
4. When do Weak Signals Become Strong in AML Detection?
Weak signals become strong when they repeat across connected entities and reinforce each other within the same network. A single anomaly rarely matters. But when similar behaviors appear across linked accounts, shared infrastructure, or repeated transaction paths, they form a pattern—and patterns are what AML programs escalate.
5. Why are Explainable Relationship Paths Critical in AML Escalation?
Because AML decisions must be defensible—not just accurate. A score can rank risk, but only a relationship path explains it. Showing how exposure accumulated across entities, accounts, and connections creates a clear evidence chain that supports investigation, escalation, and audit.