This blog post was originally featured on Towards Data Science and is written by Parker Erickson, Data Science / Machine Learning Intern at TigerGraph
Make ML Classifications Inside Your Database
Introduction
During my time at Optum, 3 trends were very important — explainable machine learning models, knowledge graph data representation, and execution of rules within those knowledge graphs. Tying these trends together, I created a method for executing decision trees inside of a TigerGraph instance.
Data Source — Banking Dataset
Data comes from a dataset hosted on Kaggle, found here. It is encouraged to read through the dataset information on the Kaggle page, but the dataset is a binary classification problem if a given customer is going to use a bank product. To train the decision tree, we only use the categorical variables in the dataset, as these can be easily modeled as vertices in our TigerGraph schema.

Input DataFrame to Decision Tree (Image by Author)
Decision Tree
A decision tree is a machine learning model in which nodes are organized in a tree structure, where each node is a conditional statement, such as checking if an attribute of a datapoint is present. These trees are trained to use a minimum number of conditions in order to classify a datapoint. Decision trees are easy to interpret, as each node has a clear meaning to what feature it is testing for in its conditional expression. This explainability of a decision tree’s classification separates it from other machine learning model types such as deep neural networks.
To train the decision tree, we use sklearn in a Python Jupyter Notebook, using only the aforementioned categorical variables. Using a maximum depth of 7, we achieve an accuracy of 89% (note that the dataset is imbalanced, so this isn’t the best metric, but serves our purposes for now). Here is the outputted tree:
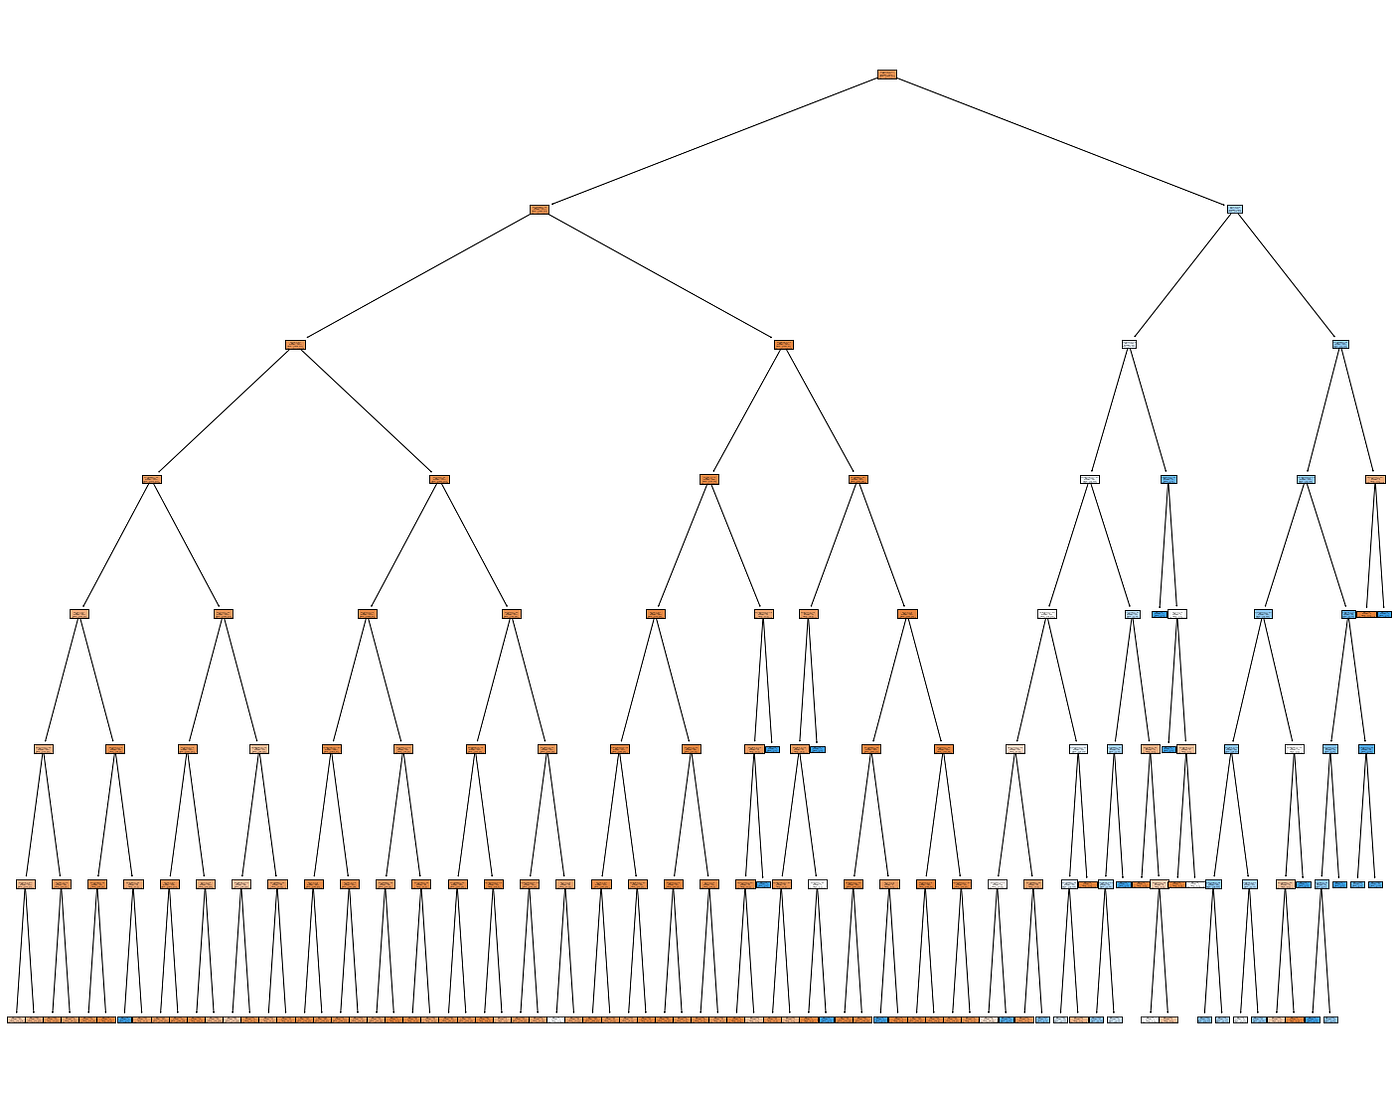
Trained Decision Tree (Image by Author)
Once the decision tree was trained, a Pandas dataframe was constructed that consisted of the edges between each node in the decision tree, to eventually be upserted into our TigerGraph instance.
TigerGraph
The data was modeled in TigerGraph such that each outcome (signing up or declining the bank product), along with each individual and categorical attributes were a vertex type. Additionally, a “SubRule” vertex is introduced, which models each node in the decision tree. Each of these vertex types were connected to one another by a series of edges defined by the schema, pictured below:
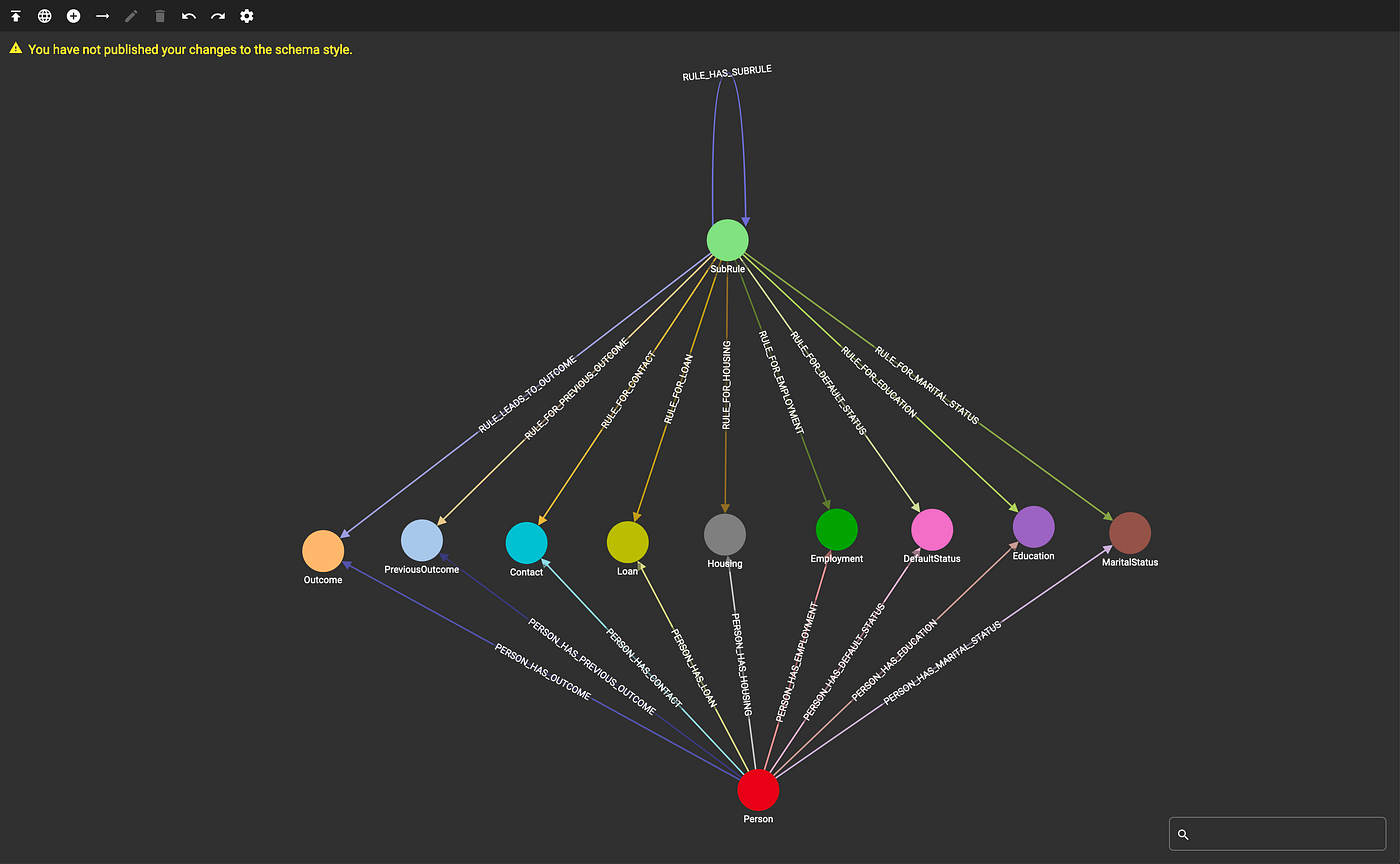
TigerGraph Schema (Image by Author)
Two loading scripts are defined to load the data and decision tree into the TigerGraph instance, written with pyTigerGraph. Once these scripts are run, we can see how much data is in the graph:
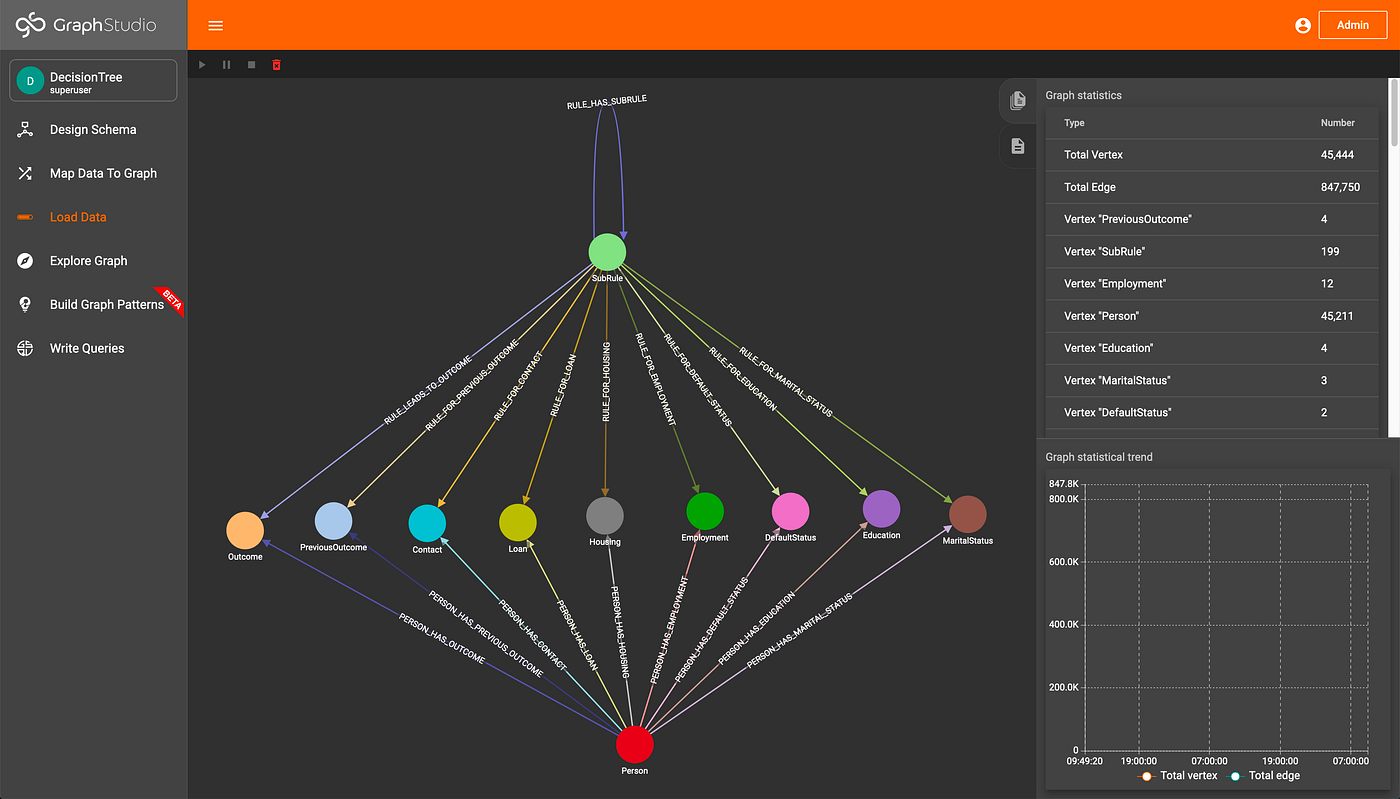
Data Loaded (Image by Author)
Accumulators in TigerGraph
According to the TigerGraph documentation, “Accumulators are special types of variables that accumulate information about the graph during its traversal and exploration.” The accumulators can be either global or local, where local accumulators are bound to each individual vertex, and global accumulators are graph-wide. This element of GSQL allows code to be very compact and easily understood. For more, check out the TigerGraph documentation.
Traversal Query
The query that traverses the decision tree and makes classifications utilizes multiple accumulators. To start, given an individual in the graph, we gather all of their attributes by traversing the graph. From these attributes, we can see what SubRules apply to those attributes by simply traversing from the attributes to the SubRules. Each SubRule is then assigned a running count as to if it has been traversed to before. Since decision trees operate on AND as well as NOT operations, the SubRules are then iteratively filtered down to valid rules by checking the number of times they have been touched, until a classification has been reached.
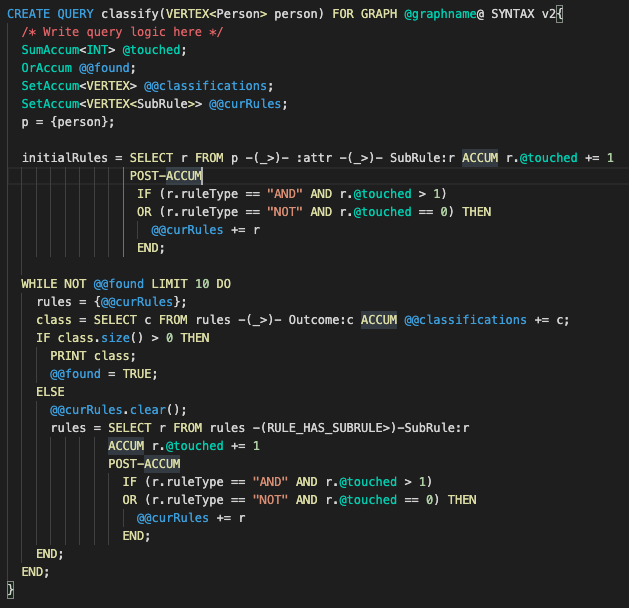
Classification Query (Image by Author)
The classify query is very simple and compact (about 30 lines of code) due to the power of accumulators and the graph structure, especially when compared to other rules engines with about 10k lines of code. Since the rules are defined in the graph and classifications are made by traversing edges within the graph, the performance is much higher than traditional rule engines such as one based on SQL and Drools since TigerGraph can typically traverse about 2 million edges per second per thread of execution.
Additionally, we can explore the decision tree inside of TigerGraph GraphStudio, the GUI visualization tool, in order to help understand why a classification was made for an individual.
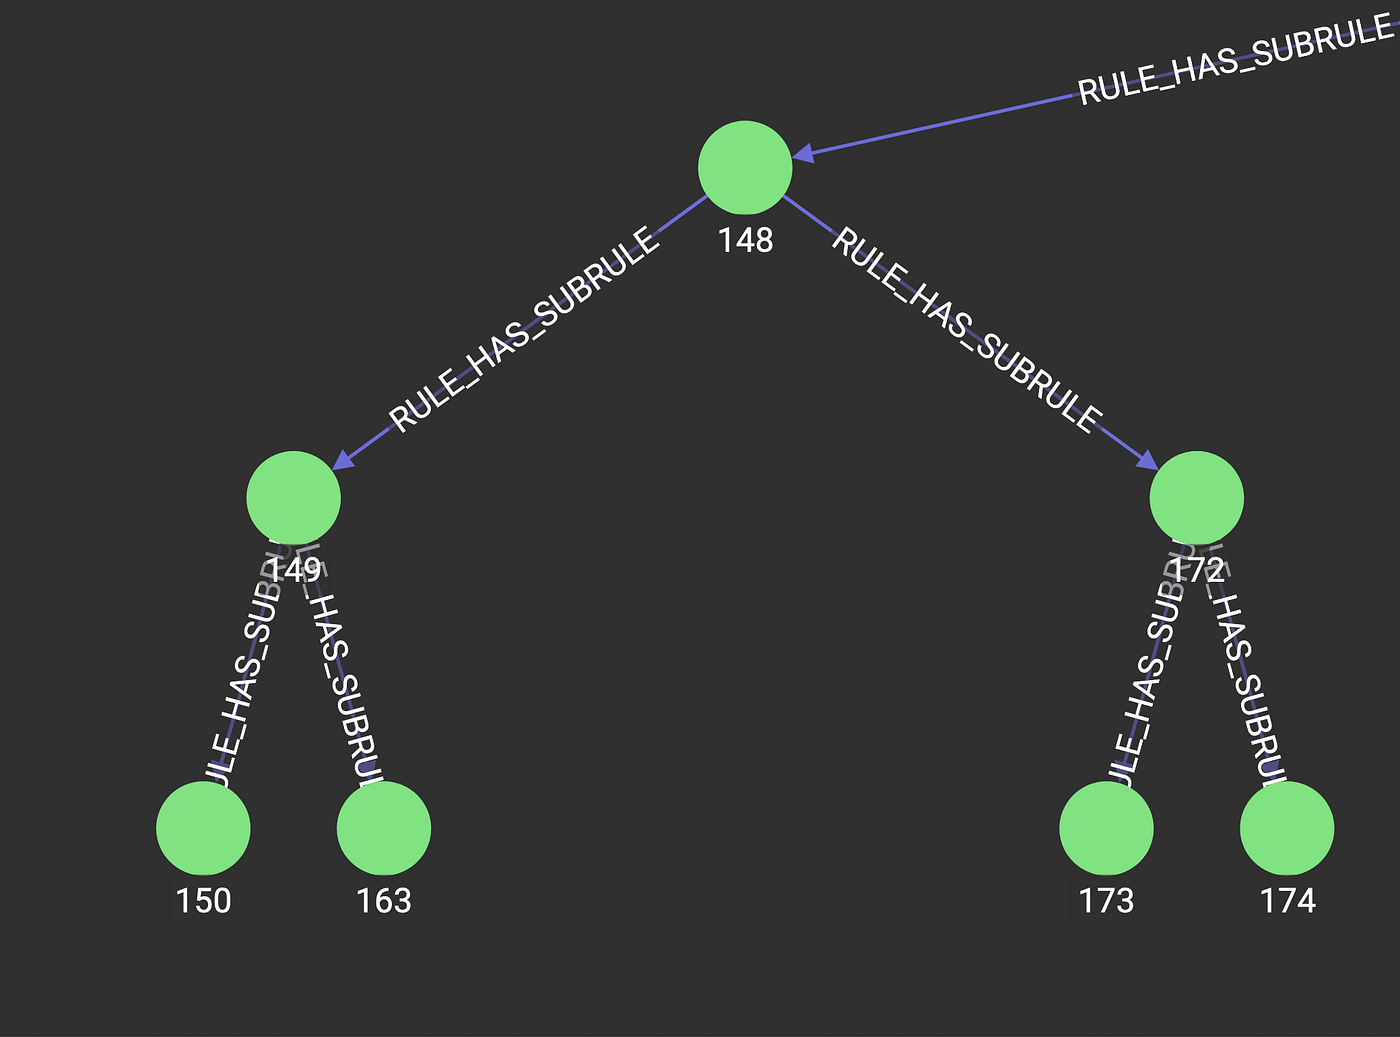
Excerpt of Decision Tree in TigerGraph (Image by Author)
Conclusion
This setup will allow users to run interpretable machine learning models inside of TigerGraph, where their data resides. Many different business processes, such as claims adjudication, can be represented as decision trees, and could be executed within the knowledge graph. Additional further work could be done to train the decision tree model within TigerGraph, removing the need to move the data in and out of the instance. All code can be found here: https://github.com/parkererickson/tigergraphDecisionTree.