Skip to content
START FOR FREE
START FOR FREE
  • SUPPORT
  • COMMUNITY
  • CONTACT
Menu
  • SUPPORT
  • COMMUNITY
  • CONTACT
MENUMENU
  • Products
    • The World’s Fastest and Most Scalable Graph Platform

      LEARN MORE

      Watch a TigerGraph Demo

      PRODUCTS

      • Why Graph?
      • Products Overview
      • What's New
      • GraphStudio User Interface
      • Visualization Toolkits
      • GSQL Query Language
      • Connectors

      TigerGRAPH ENTERPRISE

      • Enterprise Overview
      • Features

      TIGERGRAPH CLOUD

      • Cloud Overview
      • Cloud Starter Kits
      • Login/Sign Up
      • FAQ
      • Pricing
      • Marketplaces

      Graph Data Science

      • Graph Data Science Library
      • Machine Learning Workbench

      TRY TIGERGRAPH

      • Get Started for Free
      • Compare Editions
      • Test Drive - Online Demo
      • Watch Demos
      • Request a Demo
  • Solutions
    • The World’s Fastest and Most Scalable Graph Platform

      LEARN MORE

      Watch a TigerGraph Demo

      Solutions

      • Solutions Overview

      INCREASE REVENUE

      • Customer Journey/360
      • Product Marketing
      • Entity Resolution
      • Recommendation Engine

      MANAGE RISK

      • Fraud Detection
      • Anti-Money Laundering
      • Threat Detection
      • Risk Monitoring

      IMPROVE OPERATIONS

      • Supply Chain Analysis
      • Energy Management
      • Network Optimization

      By Industry

      • Advertising, Media & Entertainment
      • Financial Services
      • Healthcare & Life Sciences

      FOUNDATIONAL

      • AI & Machine Learning
      • Time Series Analysis
      • Geospatial Analysis
  • Customers
    • The World’s Fastest and Most Scalable Graph Platform

      LEARN MORE

      CUSTOMER SUCCESS STORIES

      • Citrix
      • Ford
      • Intuit
      • JPMorgan Chase
      • READ MORE SUCCESS STORIES
      • Jaguar Land Rover
      • United Health Group
      • Xbox
  • Partners
    • The World’s Fastest and Most Scalable Graph Platform

      LEARN MORE

      PARTNER PROGRAM

      • Partner Benefits
      • TigerGraph Partners
      • Sign Up
      TigerGraph partners with organizations that offer complementary technology solutions and services.​
  • Resources
    • The World’s Fastest and Most Scalable Graph Platform

      LEARN MORE

      BLOG

      • TigerGraph Blog

      RESOURCES

      • Resource Library
      • Benchmarks
      • Demos
      • O'Reilly Graph + ML Book

      EVENTS & WEBINARS

      • Graph+AI Summit
      • Trade Shows
      • Graph for All - Million Dollar Challenge
      • Webinars

      DEVELOPERS

      • Documentation
      • Ecosystem
      • Developers Hub
      • Community Forum

      SUPPORT

      • Contact Support
      • Production Guidelines

      EDUCATION

      • Certification
      • Training
  • Company
    • Join the World’s Fastest and Most Scalable Graph Platform

      WE ARE HIRING

      COMPANY

      • Company Overview
      • Leadership
      • Legal Terms
      • Patents
      • Security and Compliance

      CAREERS

      • Join Us
      • Open Positions

      AWARDS

      • Awards and Recognition
      • Leader in Forrester Wave
      • Gartner Research

      PRESS RELEASE

      • Read All Press Releases
      TigerGraph Leads Global Organizations into the Future with New Cloud Features that Make Graph Technology More Accessible to All
      June 29, 2022
      Read More »

      NEWS

      • Read All News
      Farnell

      TigerGraph rend la technologie des graphes plus accessible à tous

      AI Authority

      TigerGraph Leads Global Organizations into the Future with New Cloud Features that Make Graph Technology More Accessible to All

  • START FOR FREE
    • The World’s Fastest and Most Scalable Graph Platform

      GET STARTED

      • Request a Demo
      • CONTACT US
      • Try TigerGraph
      • GET STARTED FOR FREE
      • TRY AN ONLINE DEMO

Introducing TigerGraph 3.0

  • Victor Lee
  • July 1, 2020
  • About TigerGraph, blog
  • Blog >
  • Introducing TigerGraph 3.0
This blog is the first in a series to unveil the TigerGraph 3.0 GA release. In this blog, we would like to talk about the motivation behind the release, the benefits to the users and of course, the feature set introduced in this release.

Importance of Graph in Today’s World 

As we announce the release of TigerGraph 3.0 GA version, we would like to step back and take a wider look at the current state of the data management market. Graph is consistently listed as a top 10 technology trend in the past few years. There is a clear, big change in recent times in terms of use of Graph to solve business problems. Businesses are no longer satisfied with knowing what happened in the past. Rather the new use cases in advanced analytics are about predicting future outcomes. Any use cases that require in depth analysis of relationships are a natural fit for Graph. Graph analytics allow the exploration of relationships between entities of interest such as organizations, people and transactions.  Graph analytics will grow in the next few years due to the need to ask complex questions across complex data, which is not always practical or even possible at scale using SQL queries. Graph data stores can efficiently model, explore and query data with complex interrelationships across data silos, but the need for specialized skills has limited their adoption to date. So, the key question is: Will Graph DB vendors step up to make Graph databases easily accessible for non-technical users? The answer is yes. TigerGraph 3.0 addresses some of the features to help democratize Graph Analytics.

Areas of Product Focus 

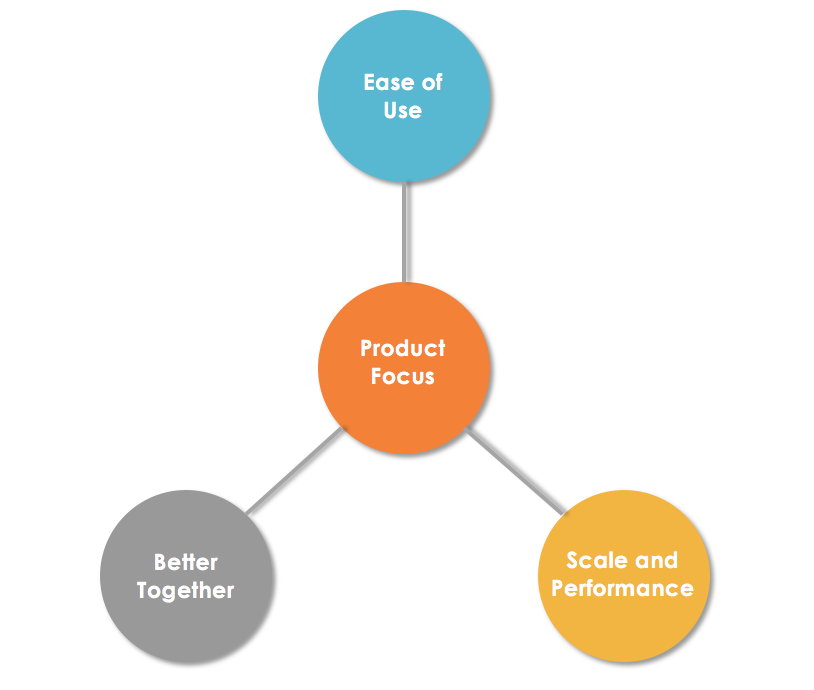
As with any major software release, there is a need to clearly delineate the design thinking behind the TigerGraph feature set. Prior releases have laid the groundwork for the industry leading Graph Database. In terms of performance and enterprise-level features, TigerGraph is the best Graph database in the market. So, the challenge was to build on top of existing functionality and focus on specific areas to make TigerGraph even more compelling for our customers. With that in mind, our approach was to follow three key design principles for 3.0 release: Ease of use: Make it easy for non-technical, new-to-Graph users to quickly onboard and gain value from Graph Databases. Scale and Performance: Ensure that performance and other enterprise requirements scale seamlessly from TBs to PBs to future-proof customer investments. Better Together: Make TigerGraph entry into existing customer data environments as frictionless as possible. Basically, ensure TigerGraph can interoperate with other data management tools so that customers can continue to get returns on their previous investments

TigerGraph 3.0 Feature Benefits

Application End Users • Easy exploration of Graph data for non-Graph users using No-Code tooling. • Easier integration with downstream applications through an expanded connector library Application Development • Enhances developer productivity by providing quick Visual tools; • Faster and simpler development of sophisticated queries, through Enhanced Pattern Matching • Modular, reusable, and portable code, through Dynamic Querying • Provides a scalable integration path to take solution into production environment Operations & Administration  • At least 10x improvement in Cluster Operations speed • Parallel Installer for concurrent upgrades for all cluster sizes • Easier, UI-based management of user and data access privileges 

TigerGraph 3.0 Release Highlights

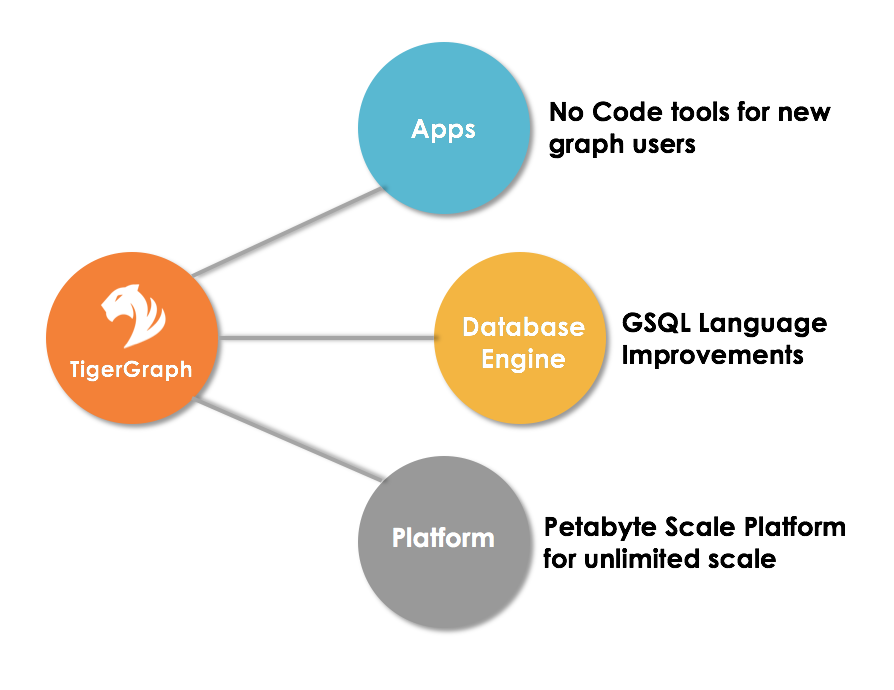
New features and enhancements in 3.0 touch all areas of the product. Broadly, TigerGraph is divided into three layers: Apps, Database Engine and Platform.

Apps:

No Code Migration from Relational Database • Empower data scientists to access the RDBMS data stores by providing a No-code path to convert schema & load data to TigerGraph No Code Graph Analytics with Visual Query Builder • Help non-technical users to produce and run graph queries simply by drawing the patterns they want, similar to visual data modeling GraphStudio Application • Support for Interpreted mode querying for immediate Query Processing • Full MultiGraph access support in GraphStudio • Internationalization and Localization enhancements in GraphStudio • One-click enablement for User-Defined Indexing

Database Engine:

User-Defined Indexing • Allow users to access non-key data attributes directly based on usage patterns • Identical semantics to SQL to make sure easy adoption for new Graph users GSQL/Engine Features • Dynamic Querying to improve developer productivity via simpler application code that allows sharing and reuse. • Enhanced Pattern Matching, including Conjunctive Pattern Matching enables developers to express complex search patterns, fully incorporated with GSQL’s signature accumulator-based analytics.

Platform:

Easier & Faster Deployment Across Distributed Environment • Empower database administrators to scale up TigerGraph deployments with bigger datasets, in minutes System Management Enhancements • Database Export/Import Utility for easy migration of database instances • New and Improved Installer with 10X speed for installation, upgrades and other management operations. • Enhanced UI with User and License Key management And many more … 

Community Projects to TigerGraph Ecosystem

In addition to the new features introduced in TigerGraph 3.0 release, there are ongoing contributions from the TigerGraph community that helped with system integration with other data management tools and technologies. Here are a few recent ones: • PyTigerGraph Python connector – pyTigerGraph • Automatic JSON to GSQL Schema conversion • Kafka Integration Data Pipeline Pattern • Alexa TigerGraph Integration • GSQL101 – on a Colab Notebook  More details can be found at community.tigergraph.com

Industry Recognition for TigerGraph 3.0

In closing, we wanted to share some exciting news for us at TigerGraph. We are honored to be selected ‘Cool Vendor in Data Management’ by Gartner. This recognition by a leading industry research firm speaks volumes on TigerGraph’s impact and potential to provide Graph Analytics solutions. The latest recognition is not one off. It is part of a trend. The detailed Gartner report which is available for download on our website goes into the details of how the new grounding breaking features in 3.0 have helped make the selection as a Cool Vendor.  Here’s the link: TigerGraph Named a 2020 “Cool Vendor” in Gartner’s Cool Vendors in Data Management Report.

Additional Resources

As stated earlier, this is the first in a series of blogs that are planned to share more information about TigerGraph 3.0 Release. Please stay tuned for more blogs on all feature areas. In the meantime, we invite you to check out TigerGraph 3.0 functionality in Graph Gurus 35 and Graph Guru 39 webinars. If you would like to get started with TigerGraph 3.0, you can download TigerGraph 3.0 binary packages at TigerGraph Download Location. If you have any questions or feedback regarding TigerGraph 3.0 release, please feel free to reach out to TigerGraph Product team at [email protected] Thank you

You Might Also Like

Five Indications a Graph Solution Is the Right Fit for Your Data Problem

Five Indications a Graph Solution Is...

June 30, 2022
Podcast: TigerGraph Machine Learning Workbench with Victor Lee

Podcast: TigerGraph Machine Learning Workbench with...

June 28, 2022
Turn Customer Data into Valuable Insights and Improved Operations with Customer 360

Turn Customer Data into Valuable Insights...

June 23, 2022

Introducing TigerGraph 3.0

July 1, 2020

Everything to Know to Pass your TigerGraph Certification Test

June 24, 2020

Neo4j 4.0 Fabric – A Look Behind the Curtain

February 7, 2020

TigerGraph Blog

  • Categories
    • blogs
      • About TigerGraph
      • Benchmark
      • Business
      • Community
      • Customer
      • Customer 360
      • Cybersecurity
      • Developers
      • Digital Twin
      • eCommerce
      • Emerging Use Cases
      • Entity Resolution
      • Finance
      • Fraud / Anti-Money Laundering
      • GQL
      • Graph Database Market
      • Graph Databases
      • GSQL
      • Healthcare
      • Machine Learning / AI
      • Podcast
      • Supply Chain
      • TigerGraph
      • TigerGraph Cloud
    • Graph AI On Demand
      • Keynote
      • Session
    • Video
  • Recent Posts

    • Evanta CDO Executive Summit – Chicago
    • FIMA Europe 2022
    • Data. AI. Precision. Innovation. For Pharma, Healthcare & Partners
    • Gartner IT Symposium/Xpo
    • Gartner IT Symposium
    TigerGraph

    Product

    SOLUTIONS

    customers

    RESOURCES

    start for free

    PRODUCT
    • Overview
    • What's New
    • Toolkits
    • Connectors
    • Data Science Library
    TIGERGRAPH DB
    • Overview
    • No-Code Graph Analytics
    • Features
    • GSQL Query Language
    TIGERGRAPH CLOUD
    • Overview
    • Cloud Starter Kits
    • Login
    • FAQ
    • Pricing
    • Cloud Marketplaces
    GRAPHSTUDIO
    • Overview
    • Take a Test Drive
    TRY NOW
    • Get Started for Free
    • Compare Editions
    • License FAQ
    SOLUTIONS
    • Why Graph?
    industry
    • Advertising, Media & Entertainment
    • Financial Services
    • Healthcare & Life Sciences
    use cases
    • Benefits
    • Product & Service Marketing
    • Entity Resolution
    • Customer 360/MDM
    • Recommendation Engine
    • Anti-Money Laundering
    • Cybersecurity Threat Detection
    • Fraud Detection
    • Risk Assessment & Monitoring
    • Energy Management
    • Network & IT Management
    • Supply Chain Analysis
    • AI & Machine Learning
    • Geospatial Analysis
    • Time Series Analysis
    success stories
    • Customer Success Stories

    Partners

    Partner program
    • Partner Benefits
    • TigerGraph Partners
    • Sign Up
    LIBRARY
    • Resources
    • Benchmark
    • Webinars
    Events
    • Trade Shows
    • Graph + AI Summit
    • Million Dollar Challenge
    EDUCATION
    • TigerGraph Academy
    • Certification
    Blog
    • TigerGraph Blog
    DEVELOPERS
    • Developers Hub
    • Community Forum
    • Documentation
    • Ecosystem

    COMPANY

    Company
    • Overview
    • Careers
    • News
    • Press Release
    • Awards
    • Legal
    • Patents
    Get Started
    • Get TigerGraph
    • Compare Editions
    • Online Demo - Test Drive
    • Request a Demo

    Product

    • Overview
    • TigerGraph 3.0
    • TIGERGRAPH DB
    • TIGERGRAPH CLOUD
    • GRAPHSTUDIO
    • TRY NOW

    customers

    • success stories

    RESOURCES

    • LIBRARY
    • Events
    • EDUCATION
    • BLOG
    • DEVELOPERS

    SOLUTIONS

    • SOLUTIONS
    • use cases
    • industry

    Partners

    • partner program

    company

    • Overview
    • news
    • Press Release
    • Awards

    start for free

    • Request Demo
    • take a test drive
    • SUPPORT
    • COMMUNITY
    • CONTACT
    • Copyright © 2022 TigerGraph
    • Privacy Policy
    • Linkedin
    • Facebook
    • Twitter

    Copyright © 2020 TigerGraph | Privacy Policy

    Copyright © 2020 TigerGraph Privacy Policy

    • SUPPORT
    • COMMUNITY
    • COMPANY
    • CONTACT
    • Linkedin
    • Facebook
    • Twitter

    Copyright © 2020 TigerGraph

    Privacy Policy

    • Products
    • Solutions
    • Customers
    • Partners
    • Resources
    • Company
    • START FOR FREE
    START FOR FREE
    START FOR FREE
    TigerGraph
    PRODUCT
    PRODUCT
    • Overview
    • GraphStudio UI
    • Graph Data Science Library
    TIGERGRAPH DB
    • Overview
    • Features
    • GSQL Query Language
    TIGERGRAPH CLOUD
    • Overview
    • Cloud Starter Kits
    TRY TIGERGRAPH
    • Get Started for Free
    • Compare Editions
    SOLUTIONS
    SOLUTIONS
    • Why Graph?
    use cases
    • Benefits
    • Product & Service Marketing
    • Entity Resolution
    • Customer Journey/360
    • Recommendation Engine
    • Anti-Money Laundering (AML)
    • Cybersecurity Threat Detection
    • Fraud Detection
    • Risk Assessment & Monitoring
    • Energy Management
    • Network Resources Optimization
    • Supply Chain Analysis
    • AI & Machine Learning
    • Geospatial Analysis
    • Time Series Analysis
    industry
    • Advertising, Media & Entertainment
    • Financial Services
    • Healthcare & Life Sciences
    CUSTOMERS
    read all success stories


    PARTNERS
    Partner program
    • Partner Benefits
    • TigerGraph Partners
    • Sign Up
    RESOURCES
    LIBRARY
    • Resource Library
    • Benchmark
    • Webinars
    Events
    • Trade Shows
    • Graph + AI Summit
    • Graph for All - Million Dollar Challenge
    EDUCATION
    • TigerGraph Academy
    • Certification
    Blog
    • TigerGraph Blog
    DEVELOPERS
    • Developers Hub
    • Community Forum
    • Documentation
    • Ecosystem
    COMPANY
    COMPANY
    • Overview
    • Leadership
    • Careers  
    NEWS
    PRESS RELEASE
    AWARDS
    START FOR FREE
    Start For Free
    • Try TigerGraph Now
    • Request a Demo
    • SUPPORT
    • COMMUNITY
    • CONTACT
    Dr. Jay Yu

    Dr. Jay Yu | VP of Product and Innovation

    Dr. Jay Yu is the VP of Product and Innovation at TigerGraph, responsible for driving product strategy and roadmap, as well as fostering innovation in graph database engine and graph solutions. He is a proven hands-on full-stack innovator, strategic thinker, leader, and evangelist for new technology and product, with 25+ years of industry experience ranging from highly scalable distributed database engine company (Teradata), B2B e-commerce services startup, to consumer-facing financial applications company (Intuit). He received his PhD from the University of Wisconsin - Madison, where he specialized in large scale parallel database systems

    Todd Blaschka | COO

    Todd Blaschka is a veteran in the enterprise software industry. He is passionate about creating entirely new segments in data, analytics and AI, with the distinction of establishing graph analytics as a Gartner Top 10 Data & Analytics trend two years in a row. By fervently focusing on critical industry and customer challenges, the companies under Todd's leadership have delivered significant quantifiable results to the largest brands in the world through channel and solution sales approach. Prior to TigerGraph, Todd led go to market and customer experience functions at Clustrix (acquired by MariaDB), Dataguise and IBM.