


Originally posted on Towards Data Science by Shreya Chaudhary.
What’s TigerGraph and Why Should I Get Certified?
Listed as one of Gartner’s top ten data and analytics trends for 2019, graph technology is the future, allowing users to ask complex questions over complex data, and TigerGraph is one instance of this. Here, we’ll walk through all the content you’ll need for using TigerGraph and learning about graph technology. If you get certified, your credibility increases, therefore I strongly suggest you give it a try. In addition, TigerGraph is “the only scalable graph database for enterprise.” By taking the certification test, not only will you increase your credibility, but you’ll also learn something new that could help you almost anywhere. Also, taking the test is completely free, so all it takes is time and willingness to learn to pass your test!
Step 1: Theory
The first four modules you’ll watch consists of theory. What is graphing technology? Can you tell the difference between some popular versions and what their different applications would be?
Graph Database and Analytics
A graph consists of vertices (also called nodes) which are connected by edges. All the vertices and edges make a schema. The power of graph technology is that the data are interconnected, allowing users to ask complex questions across complex data which sometimes isn’t possible using SQL. The nodes and edges can have properties or attributes, such as age, location, time, etc., which provide details about each node and edge; graphs with nodes, vertices, and properties are called property graphs
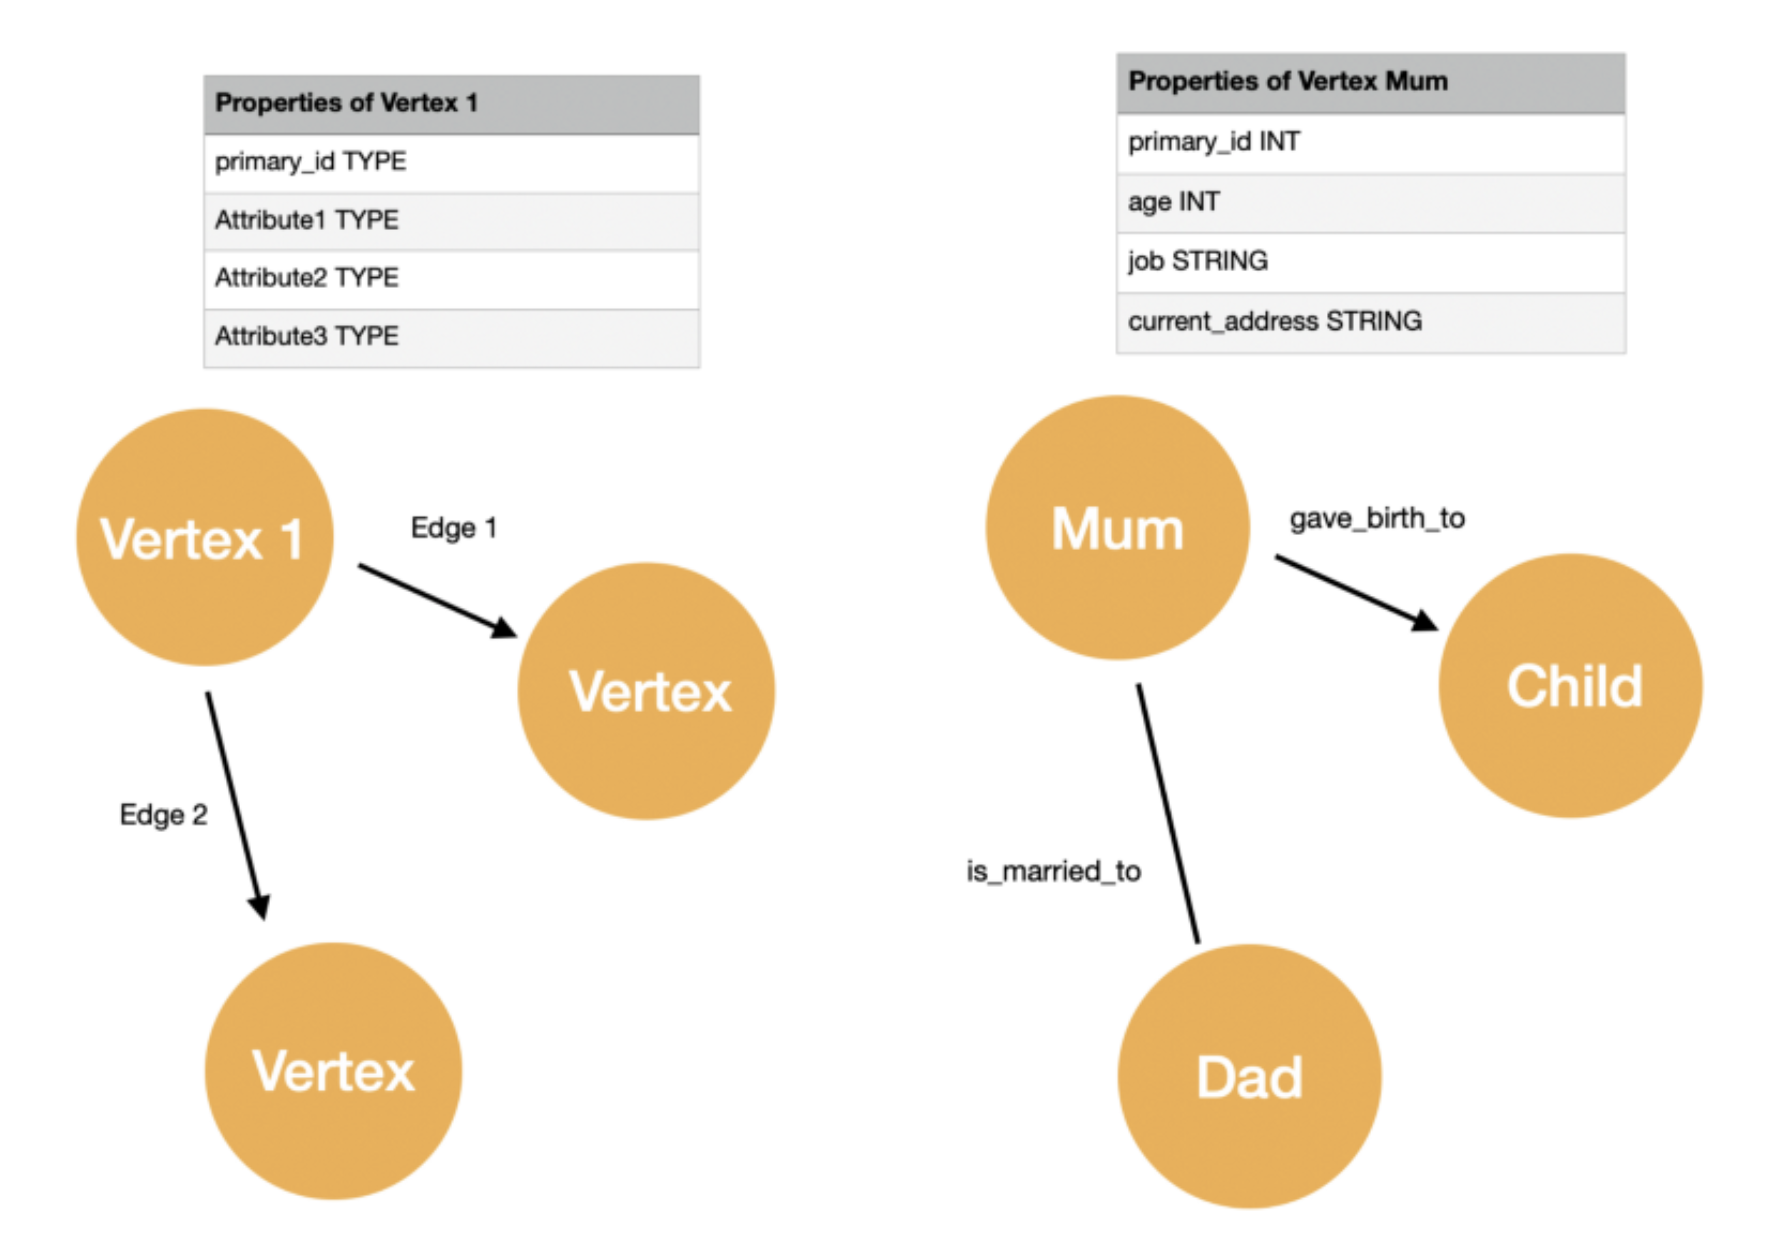
Photo by Shreya Chaudhary. The above shows a basic property graph plus an example. Each vertex is connected with either a directed or undirected edge (an arrow or a line respectively) and have unique primary_id.
Graphs can be used as a referral network by searching for different entities which have multiple vertices in common and are a few hops (or edges) away. You can find referral networks in your everyday life, like your suggested LinkedIn connections or suggested doctors.
Property graphs contrast from Resource Description Framework (RDF) Graphs because each node on an RDF is a Unique Resource Identifier (URI) which cannot carry any attributes. They have subjects and objects (nodes), connected with predicates (edges), but they can get verbose.
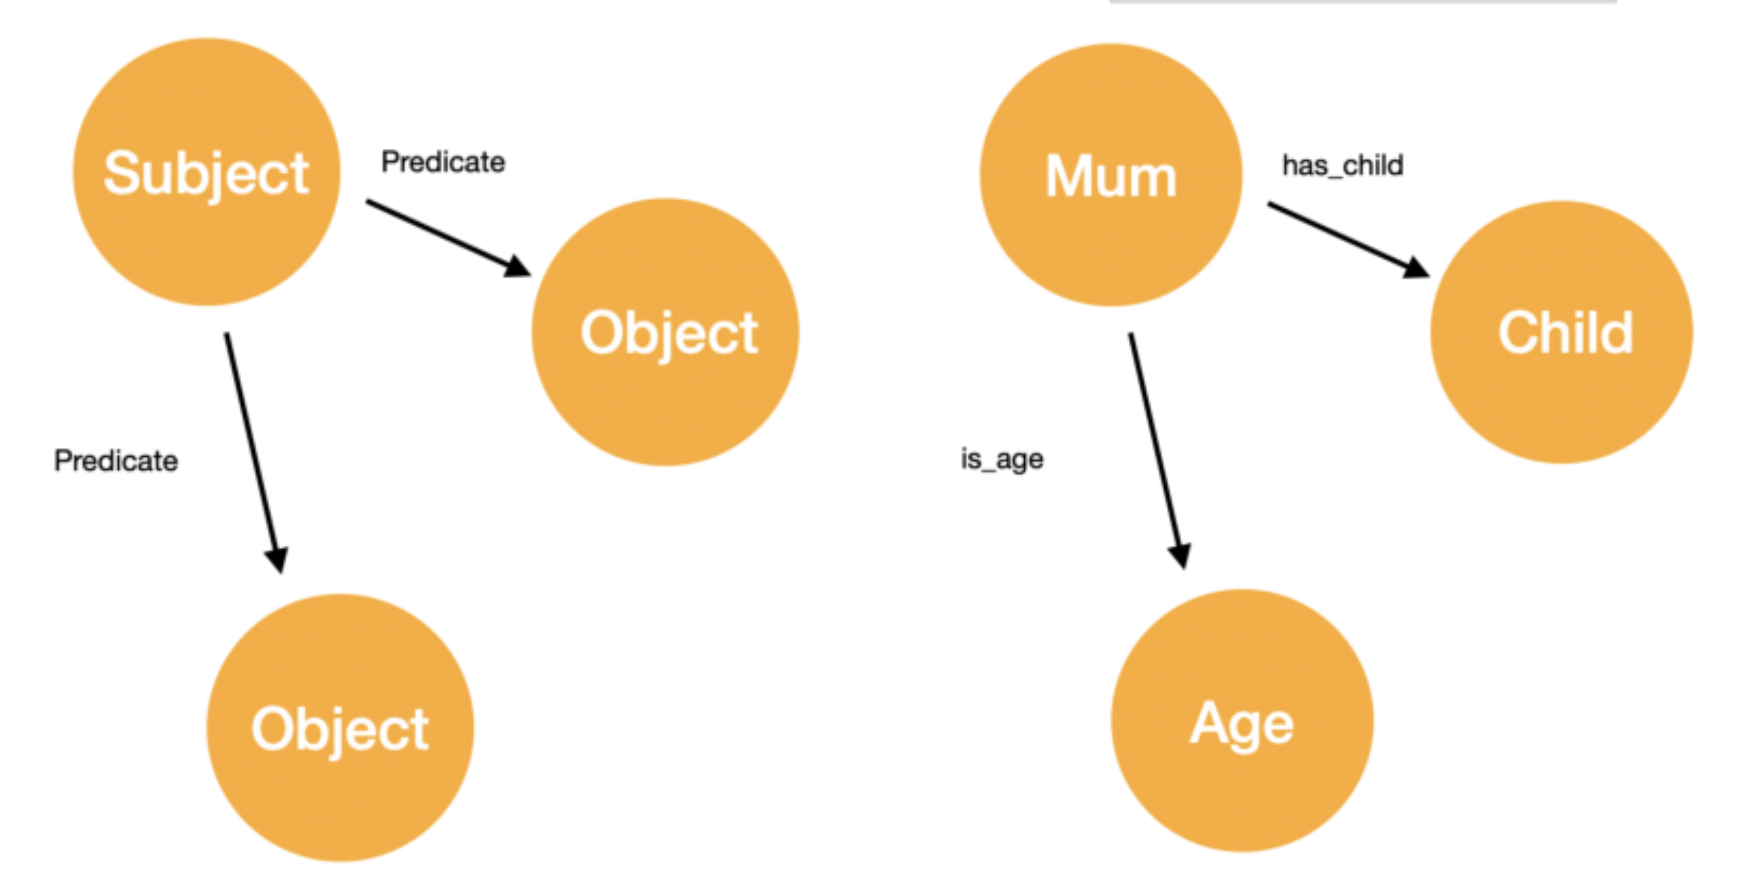
Photo by Shreya Chaudhary. This is an RDF. Notice that the properties are separate nodes, not attributes of a node.
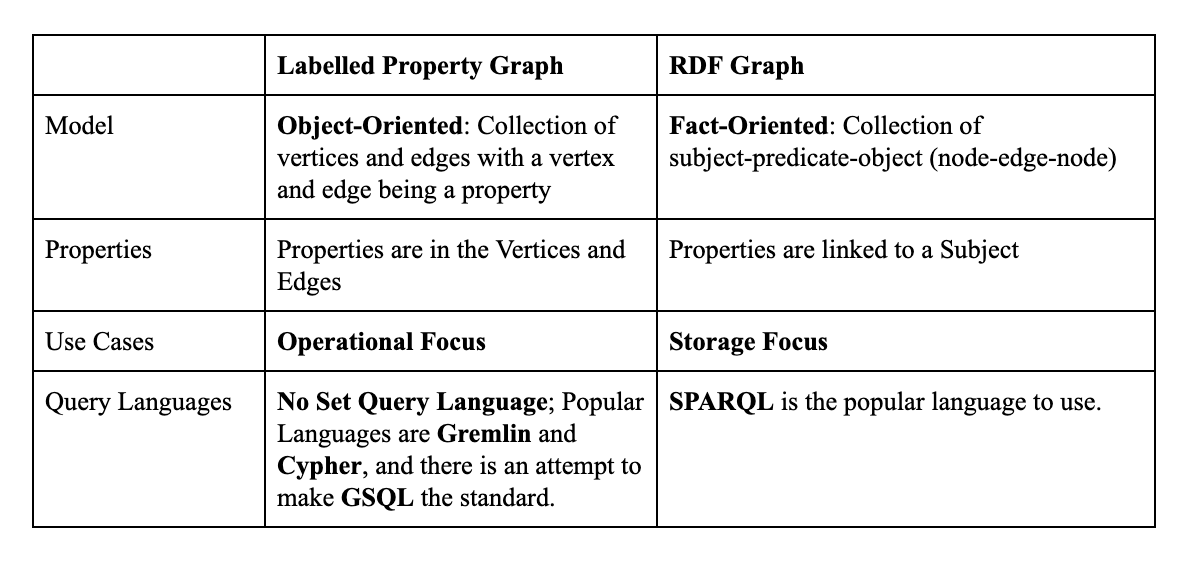
Be sure to remember the information in the above chart for the exam.
Managing Relationships
Next, we learn about different databases’ methods of storing relationships and how graph compares. Relational databases stores each entity in separate tables which then require table joins to connect, an action which could take hours and are computation expensive. It can be used for indexing and searching for one type of data and performing basic analyses. Relational databases are optimised for transactions, not deep analytics.
Photo by Shreya Chaudhary. This is an example of a relational database with table joins between different entities.
Graph databases, in contrast, are one, single, pre-connected table. They’re a natural storage model built for storing and analysing relationships. Because all of its relationships are first-class entities, graph databases, optimised for deep analytics, tend to be much faster than relational databases.
Compared to a NoSQL, graph databases tend to be better for deep analytics. One example of such is a key-value database, which stores all its data in a single table. Key-value databases allow for data flexibility and fast key lookups, but it’s low-level. Column-family is efficient processing at scale, but it’s slow for transactions and updates. Document can handle structures like XML and JSON, but it’s often very specialised. All of these require traversing and analysing relationships, taking many scans of the tables, making it unfit for analysing deep relationships. Finally, graphs are good for dealing with relationships and are the only of the said structures which manage relationships well, but not all graphs offer real-time speed at scale. Overall, while NoSQL graphs can store a wide variety of data, graphs are the best choice for handling relationships and entities.

Photo by Shreya Chaudhary. This shows a Key-Value database, which is one huge database that takes a lot of time to iterate over.
The Evolution of Graphs
There are currently three types of graph: Graph 1.0, Graph 2.0, and Graph 3.0. Graph 1.0 using native graph storage with a single server and non-parallel architecture. Graph 2.0 uses a NoSQL base for storage scale and can support two hops queries, but they aren’t designed for real-time updates. Graph 3.0, however, is both native and parallel, supporting over ten hops and taking less time to run hops and load data.
Graph 3.0, as provided by TigerGraph, supports HTAP (Hybrid Transactions and Analytics). It also supports OLTP and OLAP, has real-time performance, is a transactional graph, has scalability for massive datasets, can use Deep Link Multi-Hope Analytics, provides ease for develop and deployment, and provides enterprise grade security. TigerGraph is the world’s first Native Parallel and Distributed Graph and has interoperability, parallelism with MPP, has many graph algorithms in a libraries, supports MultiGraph, uses GSQL (which is similar to SQL to allow easy transition). Graph Studio, a GUI, allows for quick and simple creations of graphs and easy visualisation.
Data Science Capabilities
Graphs support many machine learning and data science algorithms. This is a walk-through of a few of them.
Deep Link Analysis supports looking through data with more than three hops. This can grow exponentially. An example of Deep Link Analysis is trying to find a user’s fraudulent history. Not only will it look at shallow connections, but it will also look deeper to detect whether a user’s history is clear.
Multi-dimensional Entity and Pattern Match will look for a pattern within a graph.
Relational Commonality looks for something in common with two vertices, like common customers for two vendors.
Hub Community Detection searches for the most influential vertex in a graph, the vertex with the most edges. This can help find the relevance of something within a community.
Geospatial Graph Analysis shows how close two things are to each other using latitude and longitude.
Temporal Graph Analysis is similar, but it looks at how entities and relationships change over time.
Machine Learning and Explainable AI can be used by graph by extracting features and using GraphStudio (the GUI) to provide visual aids for the graphs.
Step 2: TigerGraph Cloud
To use TigerGraph Cloud, go to https://tgcloud.io/. Login and then make sure you’re comfortable with using this resource. Be able to create a solution, upload data, create queries, and build graphs using GraphStudio. There are already several great blogs about this, so I’ll link them here.
Here’s one that I would recommend: https://www.tigergraph.com/2020/01/20/taking-your-first-steps-in-learning-tigergraph-cloud/
Step 3: SELECT Statement
SELECT
Using a Select Statement, one can traverse from one set of vertices to another. This is the general syntax (required parameters are in bold):
resultSet = SELECT vSet FROM (edgeSet | vertexSet) [whereClause]
[accumClause] [havingClause] [orderClause] [limitClause] ;
When running this command, the algorithm starts with FROM, goes through all the other clauses to “filter” or do operation with them, then the SELECT returns all the vertices that fit.
Here is an example query:
CREATE QUERY GetFriends(vertex<Users> inputUser) FOR GRAPH Social {
   Start = (inputUser);
   Friends = SELECT t FROM Start:s- (IsFriend:e)-User:t;
   PRINT Friends;
}
In the example, s is the starting node, e is the edge, and t is the target or final node.
WHERE and AND
WHERE filters out vertices that don’t match a certain condition. These conditions can be joined using the AND statement.
CREATE QUERY GetFriends(vertex<Users> inputUser) FOR GRAPH Social {
   Start = (inputUser);
   Friends = SELECT t FROM Start:s- (IsFriend:e)-User:t
             WHERE e.connectDt BETWEEN to_datetime("2019-01-01")
             AND to_datetime("2020-01-01")
             AND t.gender == "F";
   PRINT Friends;
}
In the case, it’s filtering all the edges with a connectDt between 2019–01–01 and 2020–01–01. Next, it filters all the target nodes with the gender attribute as “F”. In the end, Friends prints out all female friends who connected in 2019.
Accumulators
Accumulators can be local(notated with one @) or global (notated with two @@). Local accumulators are specific to each vertex, and global accumulators are for the entire graph.
Next, there are more specific types of accumulators:
SumAccum<int> stores the running total of all numbers passed.
MaxAccum<int> stores the maximum number passed.
MinAccum<int> stores the minimum number passed.
AvgAccum<int> stores the running average of all numbers passed.
SetAccum<int> requires that all elements are unique.
ListAccum<int> has a list of the elements in the order it was passed in.
MapAccum<int, SumAccum<int>> use key-value pairs to store data like a map.
HeapAccum<Tuple> stores the data in tuples in ascending or descending order. One can also set a capacity limit; when the limit is reached, it will either remove the highest or lowest value.
Here are two examples. The first has a one-hop global MinAccum:
CREATE QUERY GetFriends(vertex<Users> inputUser) FOR GRAPH Social {
   MinAccum<uint> @@youngFriend;
   Start = (inputUser);
   Friends = SELECT t FROM Start:s- (IsFriend:e)-User:t
             WHERE e.connectDt BETWEEN to_datetime("2019-01-01")
             AND to_datetime("2020-01-01")
             AND t.gender == "F";
             ACCUM @@youngFriend += t.age;
   PRINT Friends;
}
That second has a two-hop local AvgAccums:
CREATE QUERY GetFriends(vertex<Users> inputUser) FOR GRAPH Social {
   AvgAccum @avgAge;
   Start = (inputUser);
   Friends1Hop = SELECT t FROM Start:s- (IsFriend:e)-:t;
   Friends2Hop = SELECT t
                 FROM Friends1Hop:s- (IsFriend:e)-:t
                 ACCUM t.@avgAge += s.age;
   PRINT Friends2Hop;
}
POST-ACCUM
POST-ACCUM is independent from the ACCUM clause. They can either access the starting or target vertex (the s or t alias). If it’s a global accumulator, the work will be queued and take effect after leaving the POST-ACCUM clause.
Check out an example of normalising, with a global max accumulator and a sum accumulator:
CREATE QUERY GetFriends(vertex<Users> inputUser) FOR GRAPH Social {
   SumAccum<uint> @sumAge;
   SumAccum<float> @normCNum;
   MaxAccum<float> @@maxCNum;
   Start = (inputUser);
   Friends1Hop = SELECT t FROM Start:s- (IsFriend:e)-:t;
   Friends2Hop = SELECT t
                 FROM Friends1Hop:s- (IsFriend:e)-:t
                 ACCUM t.@cNum += 1
                 POST-ACCUM @@maxCNum += t.@cNum;
   Friends2Hop = select s FROM Freinds2Hop:s
                 POST-ACCUM s.@normCNum += s.@cNum/@@maxCNum;
   PRINT Friends2Hop;
}
HAVING
The HAVING clause is another way to filter out data. It’s similar to the WHERE clause, but the HAVING clause only has access to the selected vertices and attributes, whereas a WHERE clause has access to the start and target vertices.
CREATE QUERY GetFriends(vertex<Users> inputUser) FOR GRAPH Social {
   AvgAccum @avgAge;
   Start = (inputUser);
   Friends1Hop = SELECT t FROM Start:s- (IsFriend:e)-:t;
   Friends2Hop = SELECT t
                 FROM Friends1Hop:s- (IsFriend:e)-:t
                 ACCUM t.@avgAge += s.age
                 HAVING t.@avgAge > 30;
   PRINT Friends2Hop;
}
ORDER BY and LIMIT
Finally, the ORDER BY can sort the results to be ascending or descending. The LIMIT sets the maximum number of values in the accumulator.
CREATE QUERY GetFriends(vertex<Users> inputUser) FOR GRAPH Social {
   AvgAccum @avgAge;
   Start = (inputUser);
   Friends1Hop = SELECT t FROM Start:s- (IsFriend:e)-:t;
   Friends2Hop = SELECT t
                 FROM Friends1Hop:s- (IsFriend:e)-:t
                 ACCUM t.@avgAge += s.age
                 ORDER BY t.@avgAge ASC
                 LIMIT 2;
   PRINT Friends2Hop;
}
The above example orders the results to be ascending, then it grabs the top two, which would be the smallest two.
Step 4: GSQL Demo
Graph Schema
For each vertex in your schema, you need to have a primary ID. In addition, for each vertex, you need to specific a FROM and To. Observe the following syntax:
CREATE VERTEX Test(PRIMARY_ID test_id STRING)
CREATE VERTEX Test2(PRIMARY_ID test2_id STRING)
CREATE DIRECTED EDGE TEST_TO_TEST2(FROM Test, To Test2)
CREATE UNDIRECTED EDGE TEST2_TO_TEST(FROM Test2, To Test)
Load Data
To load data, you’ll need to define a loading job. To do this, you’ll need to create filename variables and use loading statements:
DEFINE FILENAME f1 = “/path”
LOAD f1 TO VERTEX person($”name”)
Graph Inspection
For this module, you’ll need to be familiar with using your terminal or console for inspecting the graph. You can select which graph you’ll use using the following:
use graph social
Then you can use a variety of other commands. Commands listed include from, to, directed, to, attributes, e_type. Here’s an example:
SELECT * FROM person WHERE var=”Val”
Basic GSQL
The queries you will create will return JSON. You can also use curl to run this graph. Know how to create queries and results.
CREATE QUERY name(VERTEX=person p) FOR GRAPH social;
Start = ()
Result = SELECT tgt from Start:src -{friendship x} -person-tgt
Advanced GSQL
This module reviews accumulators, like OrAccum and AvgAccum and local and global accumulators. These are different ways to accumulate a variable. Remember, to make a global variable, use two @@, else just use a singular @ sign.
Deep Query in GSQL
For deep query, the module went over khop and run query name(parameters).
Other Sources
In this article, I reviewed each video series and provided a summary or description of each. In addition, there are some miscellaneous topics, like how to use gadmin, on the exam. I recommend you also review TigerGraph’s documentation if you have time.
Gadmin: https://www.tigergraph.com/managing-tigergraph-servers-with-gadmin/
TigerGraph Docs: https://www.tigergraph.com/tigergraph-docs-gsql-101/
Original Link to Video Series: https://community.tigergraph.com/t/tigergraph-getting-started-guide/11
You’re Now Ready
This is a textual version of what will be on TigerGraph’s Certification test. Now, go here to get certified and learn more beyond this article. Good luck and happy learning!


