A one-stop hub for the TigerGraph family of cloud products and tools, included with TigerGraph Savanna
All of TigerGraph at Your Fingertips
Whether it’s designing your first graph database, creating great dashboards, building machine learning pipelines, or administering your database privileges, TigerGraph Savanna Suite has the tools you need.
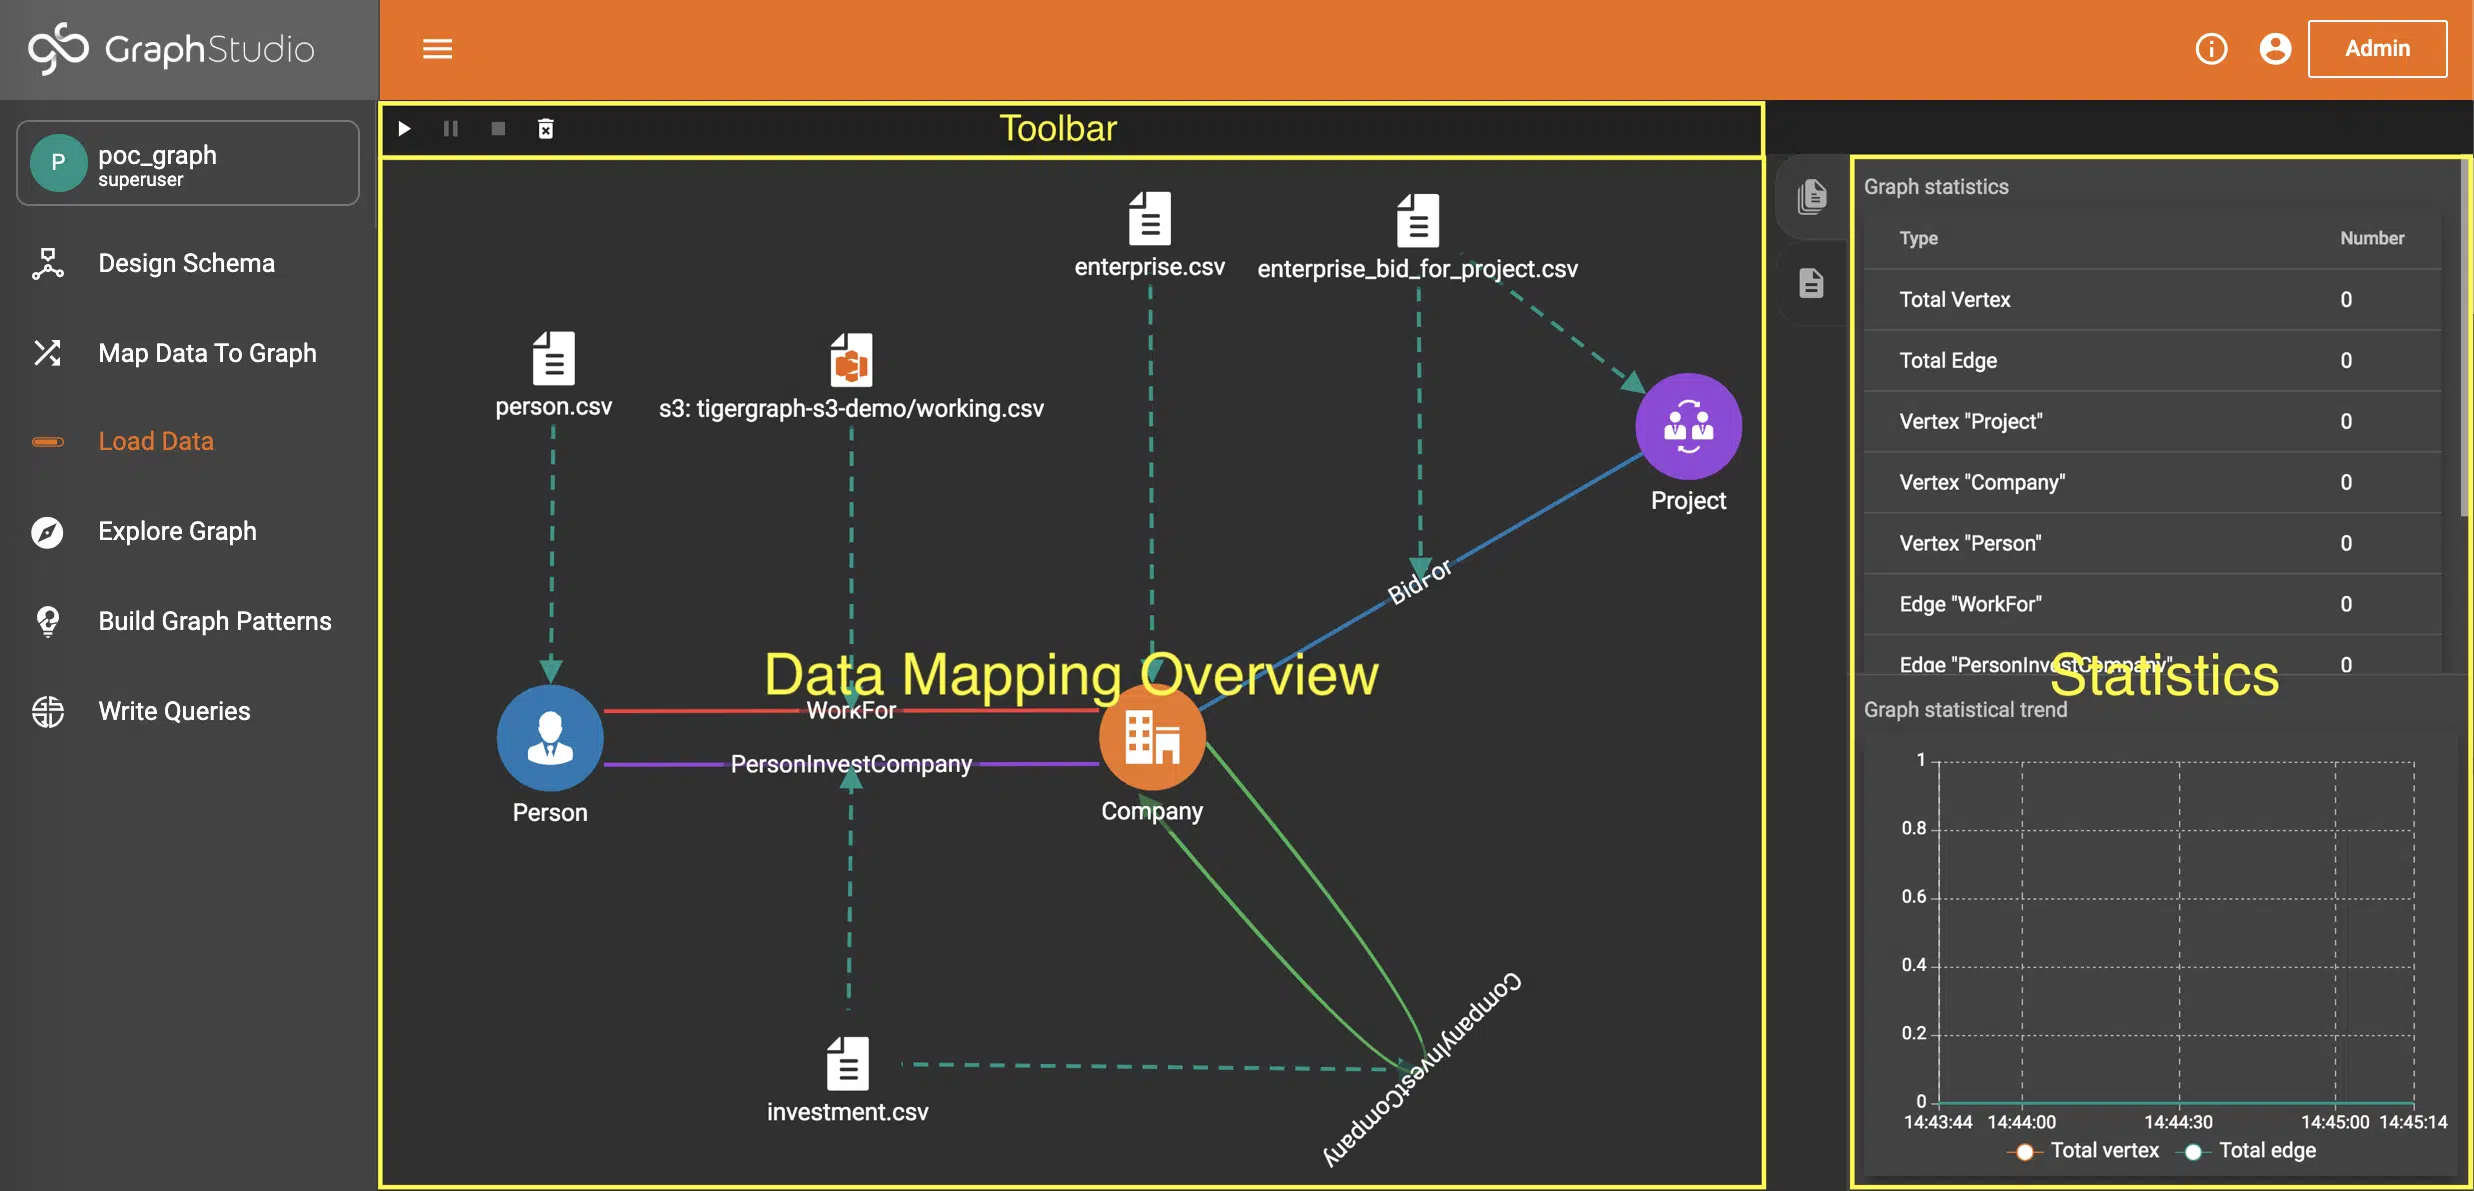
GraphStudio
Design, develop, load data to your graph database. A no/low-code interface for database architects and database developers.
Design a global graph model and unlimited local graph views
Map incoming data fields to your graph objects
Load data with one click
Explore and query your graphd
TigerGraph Insights
Build graph-powered applications in minutes. A no-code interface for anyone to build user-facing applications.
Explore/analyze the graph via widgets for charts, tables, maps, and graphs
Construct queries by drag-and-drop
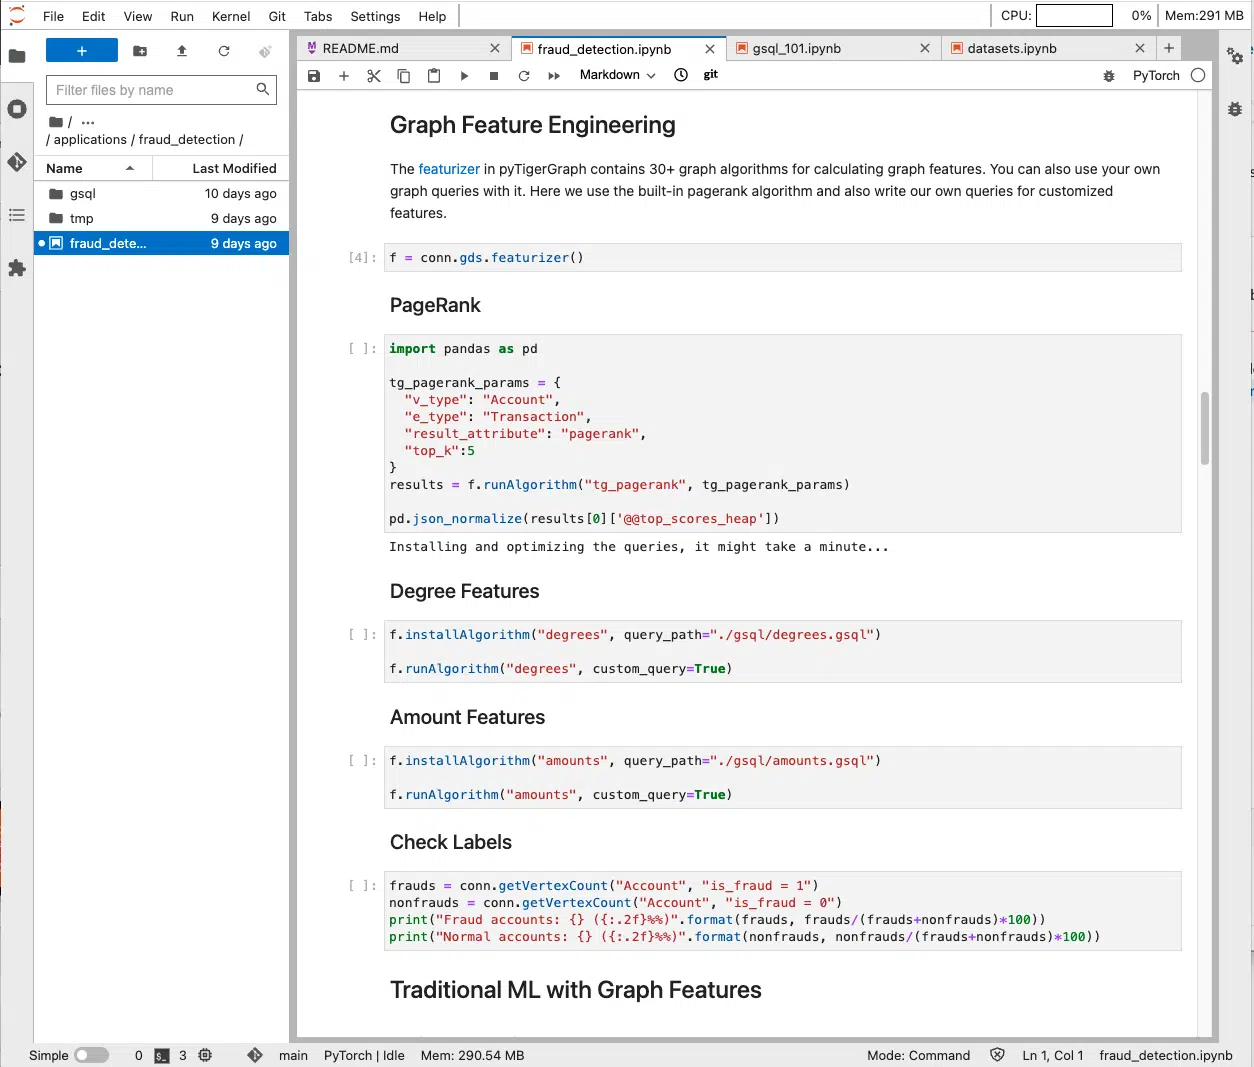
Machine Learning Workbench
Unlock powerful machine learning capabilities on your connected data. A Jupyter/Python coding interface for data scientists.
Work in Python using TigerGraph’s pyTigerGraph library
Use built-in functions for graph feature generation, graph data partitioning, subgraph sampling, and mini-batch processing
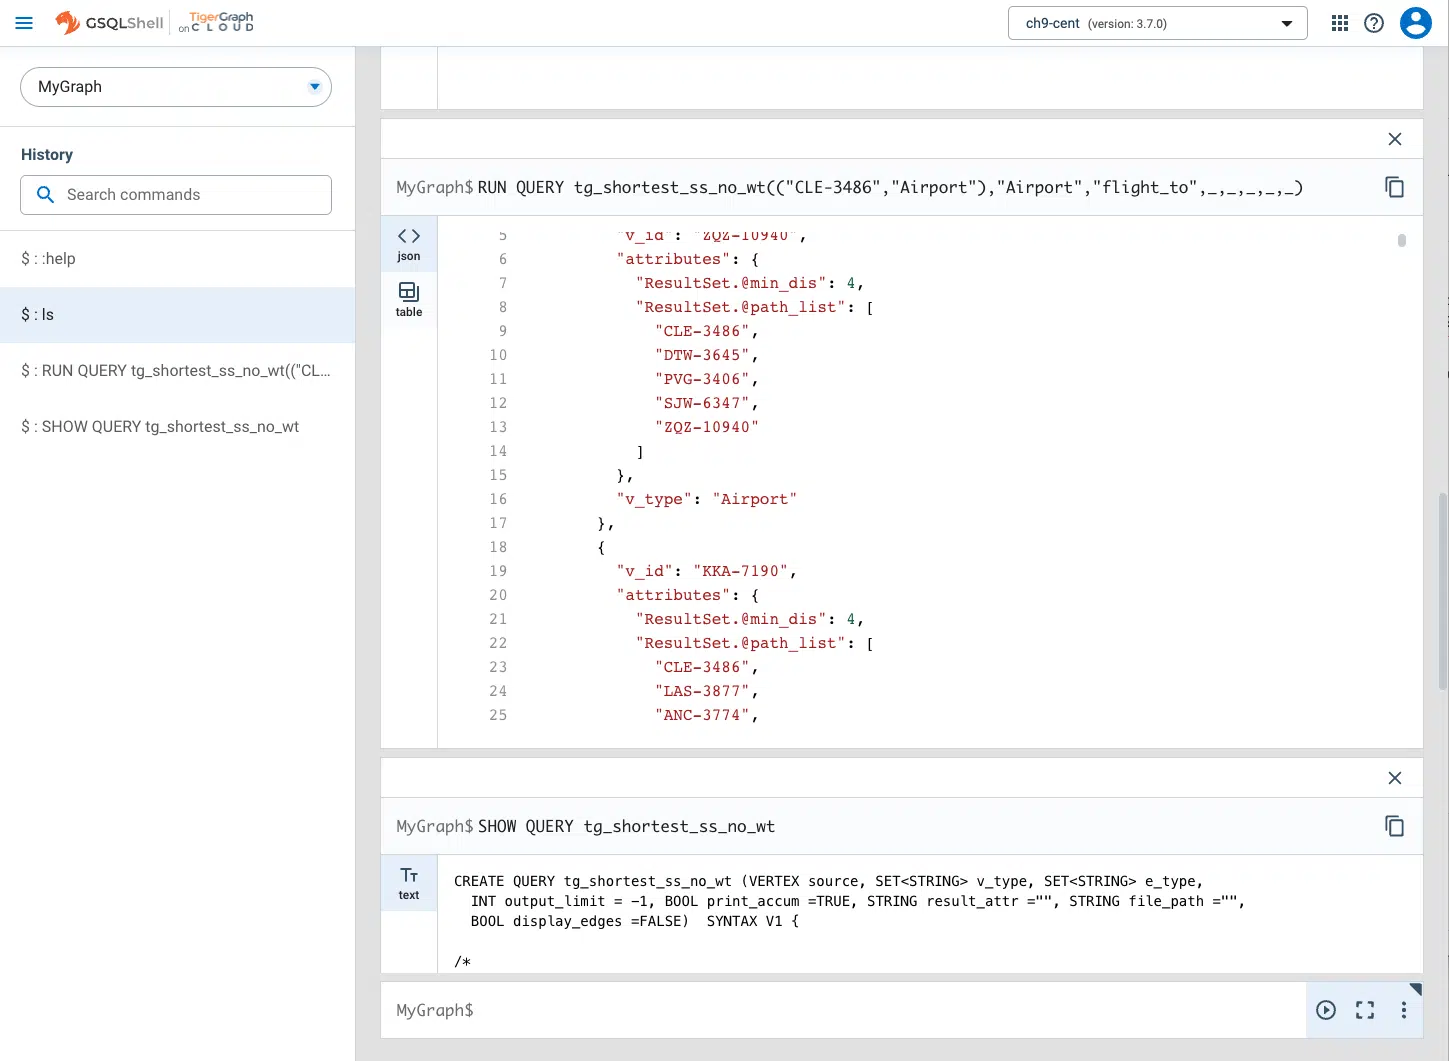
GSQLShell
Edit and run GSQL with code hints. A GSQL shell for GSQL query developers.
Write and edit GSQL commands with autocomplete hints
See input and output with syntax highlighting
Review and reuse your command history
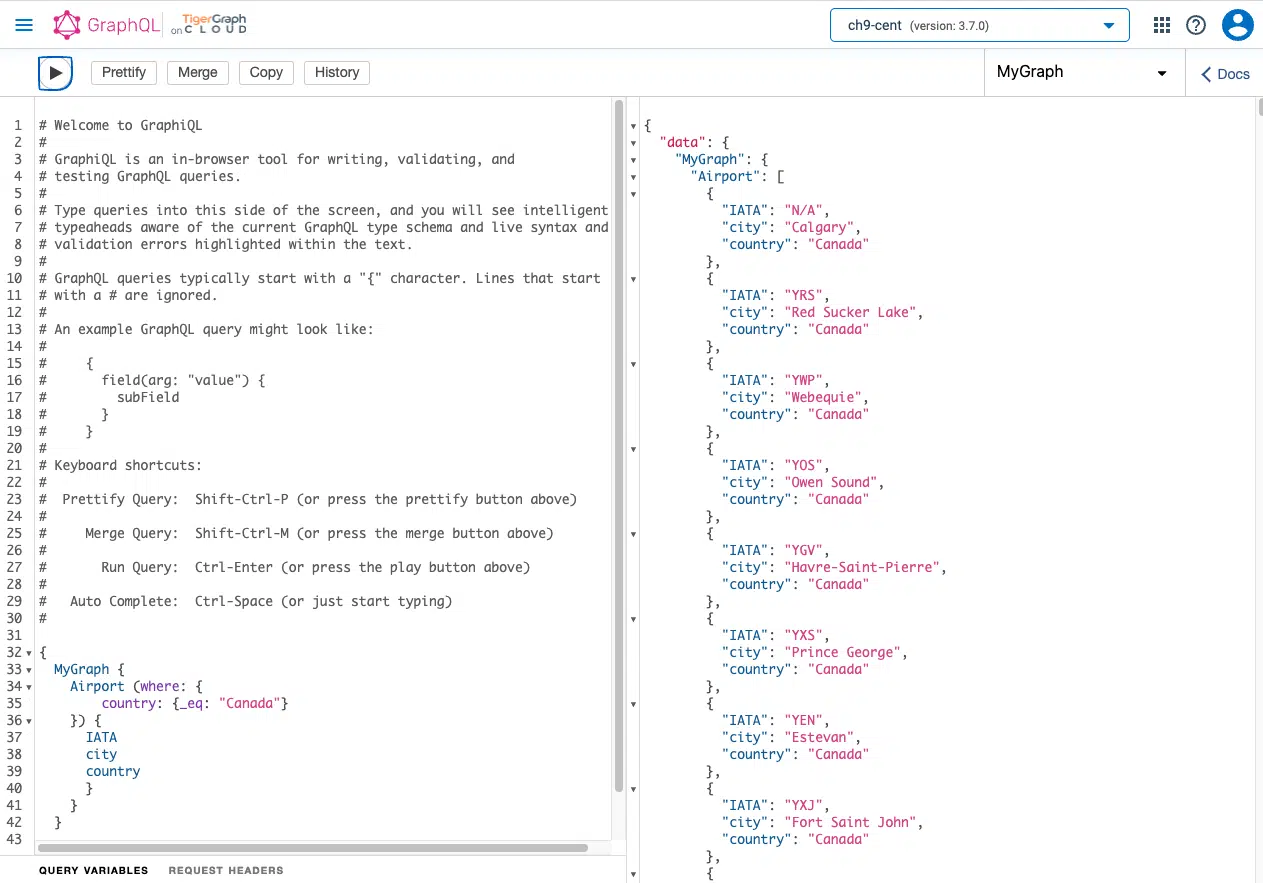
GraphQL Service
Unlock powerful machine learning capabilities on your connected data. A coding shell for GraphQL developers.
See input and output side-by-side with syntax highlighting
Read and modify graph data using an industry-standard, multi-platform protocol
Get schema-aware autocompletion hints
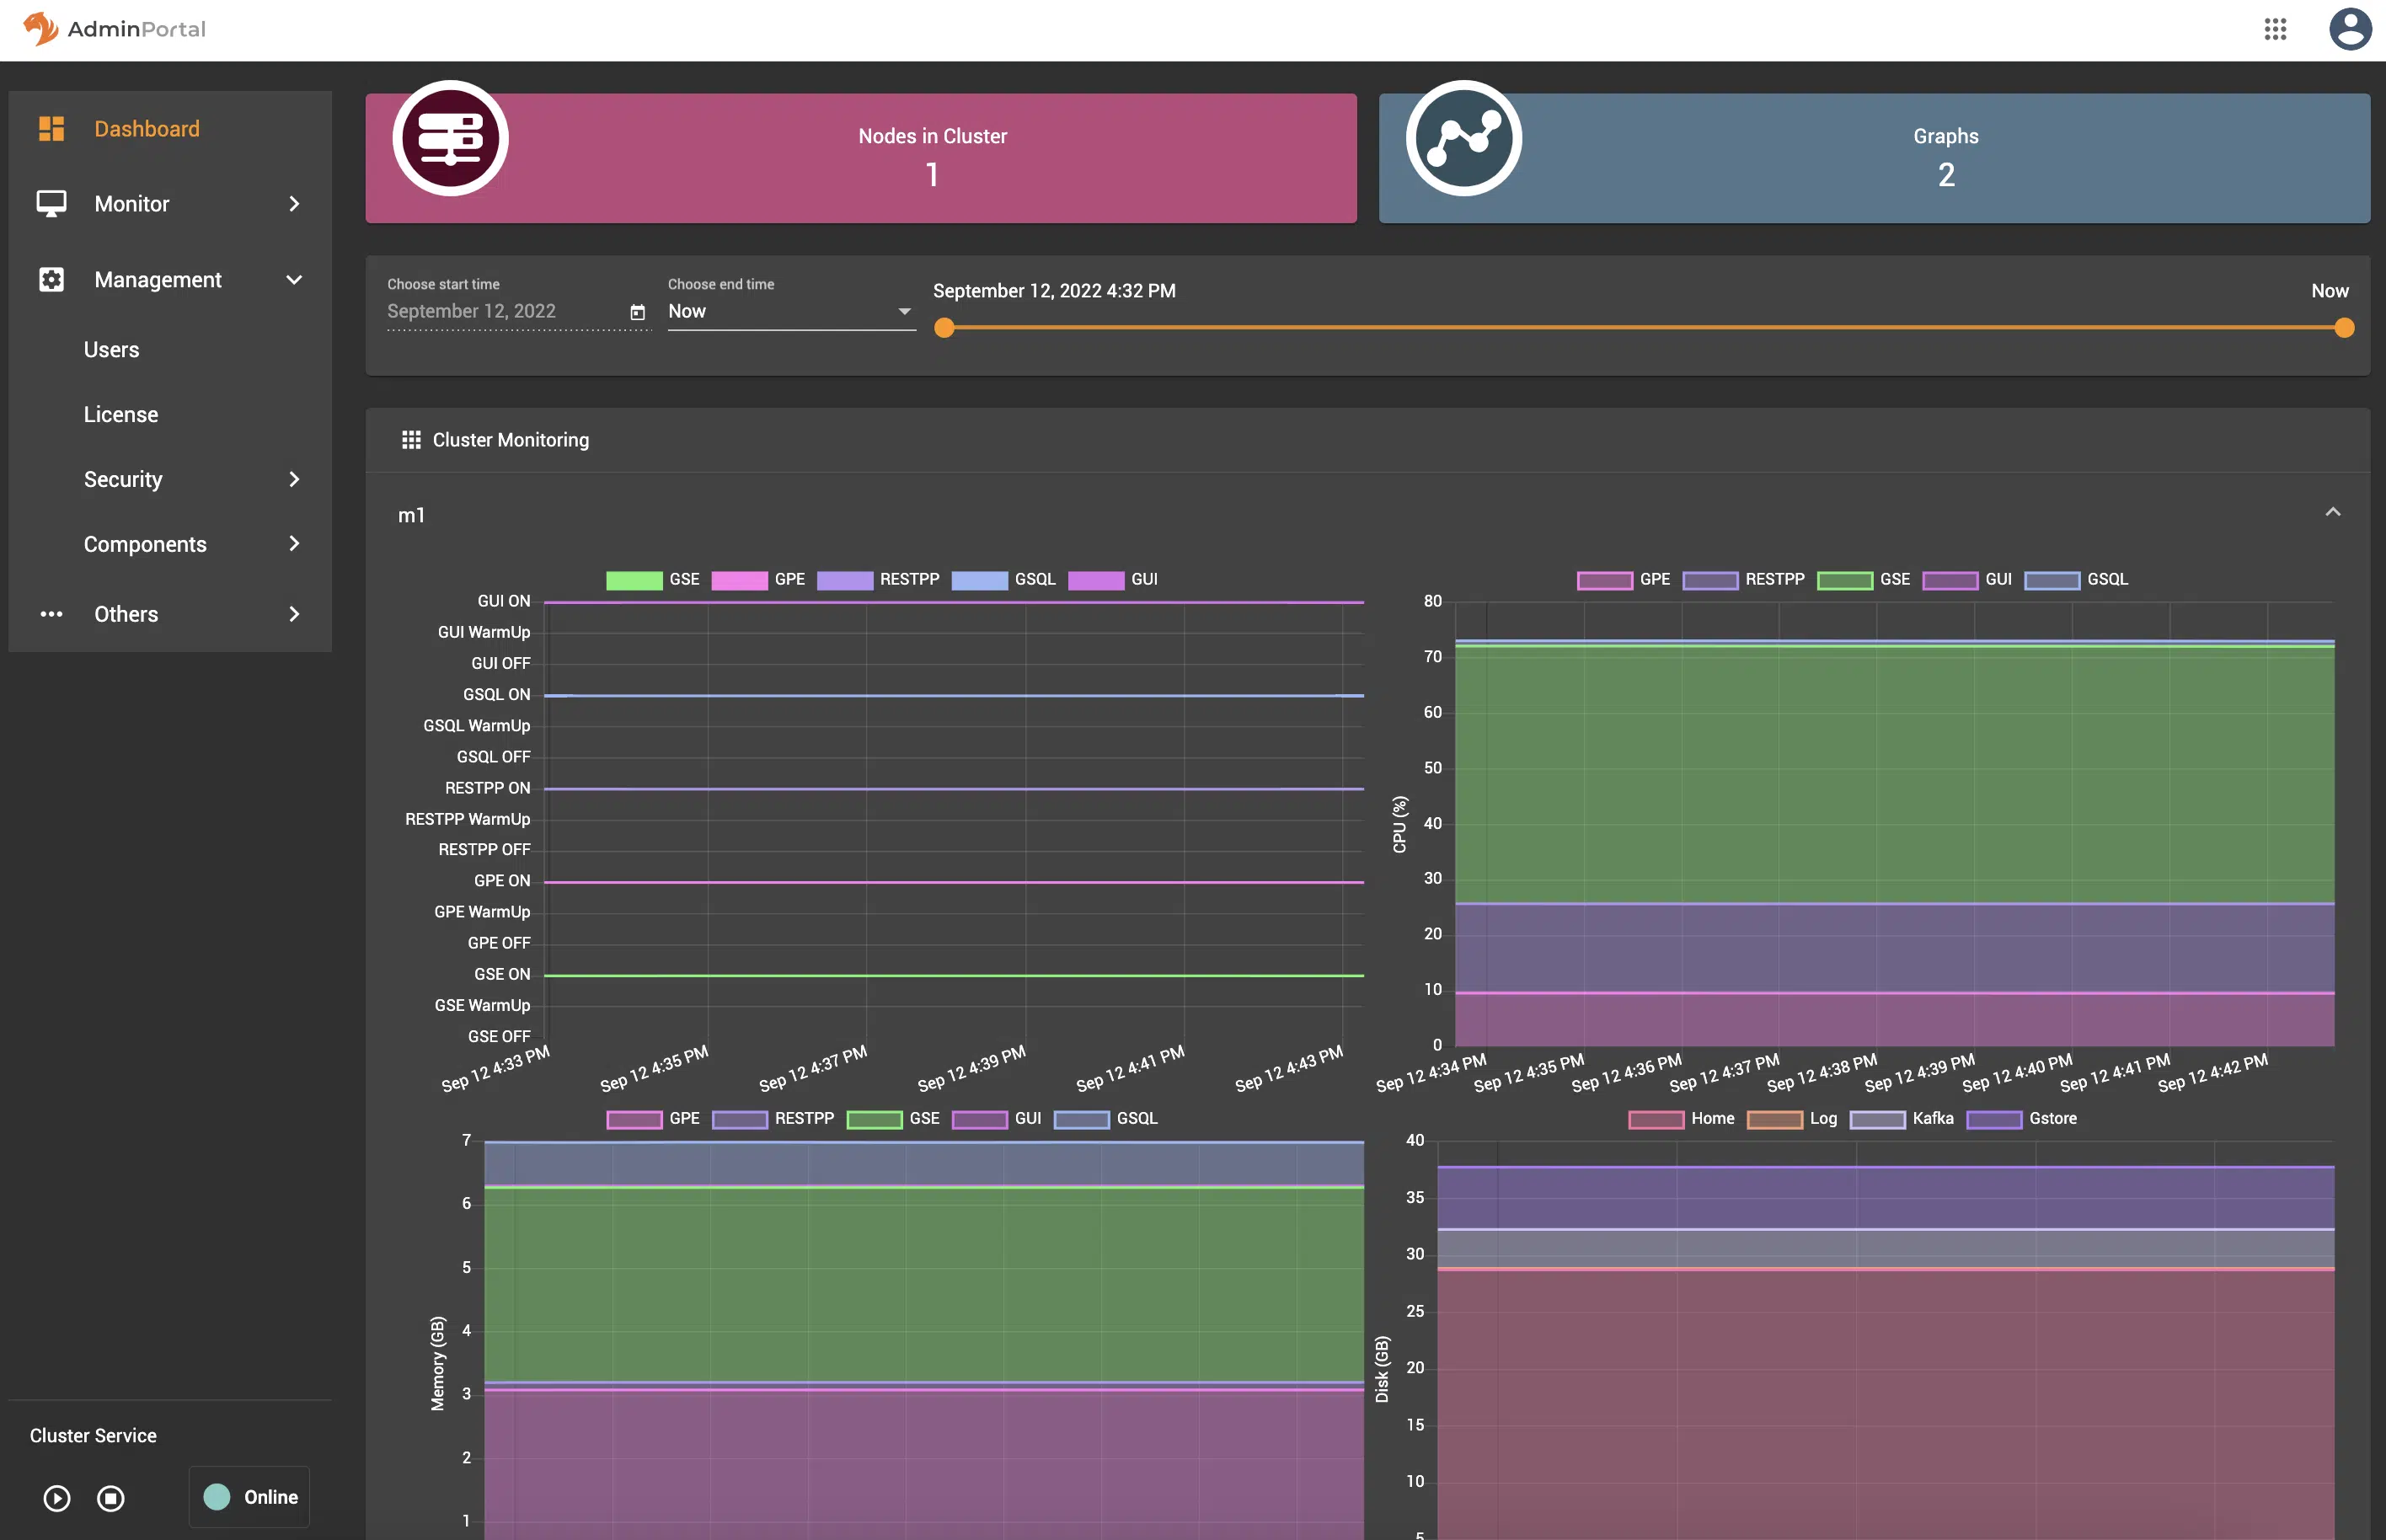
AdminPortal
Manage your TigerGraph System. A graphical interface for database administrators.
Manage users and privileges
Configure your database
Monitor database operations
Search and read logs
Get Started with TigerGraph Savanna Suite
Ready to start unlocking deeper and smarter insights from TigerGraph?
Dr. Jay Yu is the VP of Product and Innovation at TigerGraph, responsible for driving product strategy and roadmap, as well as fostering innovation in graph database engine and graph solutions. He is a proven hands-on full-stack innovator, strategic thinker, leader, and evangelist for new technology and product, with 25+ years of industry experience ranging from highly scalable distributed database engine company (Teradata), B2B e-commerce services startup, to consumer-facing financial applications company (Intuit). He received his PhD from the University of Wisconsin - Madison, where he specialized in large scale parallel database systems
Todd Blaschka |COO
Todd Blaschka is a veteran in the enterprise software industry. He is passionate about creating entirely new segments in data, analytics and AI, with the distinction of establishing graph analytics as a Gartner Top 10 Data & Analytics trend two years in a row. By fervently focusing on critical industry and customer challenges, the companies under Todd's leadership have delivered significant quantifiable results to the largest brands in the world through channel and solution sales approach. Prior to TigerGraph, Todd led go to market and customer experience functions at Clustrix (acquired by MariaDB), Dataguise and IBM.