TigerGraph Accelerates Enterprise AI Infrastructure Innovation with Strategic Investment from Cuadrilla Capital
Read More

TigerGraph DB
Community Edition

The Best Free Graph Database for AI-Powered Applications

The most powerful free graph database and vector database combination for turbocharging AI applications for developers, researchers, and everyone else seeking enterprise-grade graph database tools free of charge.

Why Choose TigerGraph Community Edition
as Your Free Graph Database?

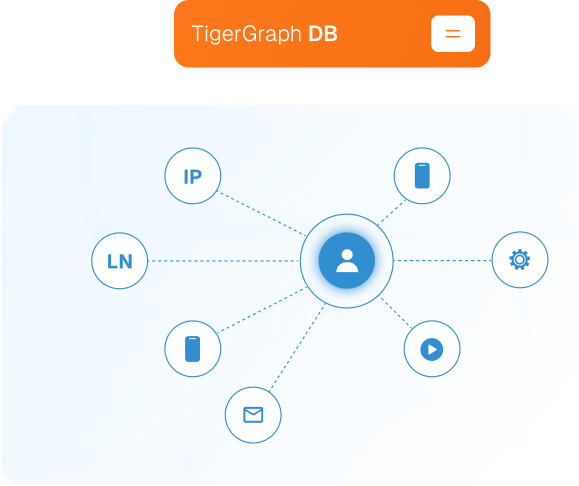
TigerGraph is as excited as you about the growing interest and demand for databases designed to supercharge AI. We're proud about what we have to offer a scalable multi-model graph + vector database with massively parallel processing, trusted by some of the biggest companies in the world. Just as GenAI is now available as a free service, TigerGraph DB Community Edition is our gift to you.

As the best free graph database in the market, TigerGraph DB Community Edition delivers enterprise-level capabilities without the enterprise price tag. Whether you're building knowledge graphs, conducting network analysis, or developing AI-powered applications, our free graph database provides the performance and scalability you need.

What Makes This the Best Free Graph Database?

TigerGraph DB Community Edition is fully optimized for single-server deployment, allowing you to experience TigerGraph’s analytical capabilities, deeper insights, and exceptional performance. This graph database free solution includes advanced features typically found only in premium offerings.

If you prefer an online graph database free solution, try TigerGraph Savanna, our cloud-based offering. The Community Edition, while powerful, focuses on single-server optimization and does not include professional support or certain enterprise features for advanced access control.

A black pie chart with one segment outlined in blue, highlighting a quarter section. The chart is simple with bold lines on a white background.
Advanced Analytics

Leverage built-in graph algorithms and machine learning capabilities.

A simple flowchart icon with one blue rectangle at the top connected by lines to four white rectangles arranged in two rows below it.
Multi-Model Architecture

Seamlessly combine graph and vector data in one platform.

A blue upward-curving arrow appears above the bold, lowercase letters ooc, suggesting growth or an increasing trend.
High Performance

Massively parallel processing for complex queries and analytics.

A small icon of two overlapping speech bubbles, one containing blue code brackets, representing coding or programming discussion.
Developer-Friendly

Multiple query languages and comprehensive APIs.

Features and Benefits

Graph+Vector Data Size

Up to 300GB.

Parallel Processing

Yes.

Compute Resource

Up to 16 CPUs.

AI/ML Library

Yes, Python-based

Query Languages

GSQL, OpenCypher. GQL in progress.

Clustering

No. Single-server only.

Access Control

Multi-user with 8 built-in roles.

License

Free, even for production..

Vector Functionality

Yes (similarity search, ANN, auto incremental indexing).

Graph Algorithm Library

Yes - User-customizable

A minimalistic background with a light blue gradient and faint dotted lines forming angular patterns, connecting small blue dots at some intersections. The overall design has a subtle, abstract geometric feel.
A light blue, minimalistic background with faint outlines of squares and a single small blue dot on the lower left. The design creates a sense of calm and simplicity.

Getting Started with Your Free
Graph Database

TigerGraph Community Edition is designed for developers, data scientists, researchers, and organizations looking to explore graph database capabilities without upfront investment. This free graph database provides the foundation for advanced graph analytics and AI applications.

FAQs

A black background with three thin, blue lines weaving across the space. The lines create a geometric, abstract pattern with smooth curves and angles, with each line intersecting at different points.
Black background with a light blue, dotted line forming a branching path or flowchart. The line starts at the top left and moves right, then curves downward with a loop, ending at the lower right. Two blue dots mark branching points.
An organizational chart with a circular head node labeled Executive Team connected by dashed lines to several square nodes beneath it, each labeled with different departments such as Finance, HR, and Marketing, representing a companys structure.
Is community support available?

Yes, TigerGraph has a Community Forum.

Do you have tutorials and documentation?

Absolutely! Comprehensive documentation, tutorials, and getting-started guides are available at docs.tigergraph.com. Our documentation covers everything from basic graph concepts to advanced analytics implementation.

How does this compare to other online graph database free options?

TigerGraph Community Edition offers superior performance, larger data capacity, and more advanced features compared to most free alternatives. Our multi-model architecture and built-in AI capabilities set us apart from traditional graph database free solutions.

If I start with the Community Edition, can I upgrade it to the full version of TigerGraph DB with a license key?

The Community Edition cannot be directly upgraded to the full enterprise version of TigerGraph DB. However, you can migrate your data and applications to an enterprise deployment when your needs exceed the Community Edition’s capabilities.

Ready to Harness the Power of Connected Data?

Start your journey with TigerGraph today!