Improving the Management of Welfare Services
Santa Clara is the fifth largest county in California, with a population of 1.9 million residents, and its government consists of more than 22,000 employees across 70 agencies. The county’s social service agency provides essential services intended to address the needs of its weakest and vulnerable residents.

The Challenge
With multiple case management systems built over the last 25 years using different technologies and different vendors, finding the most recent information about a person was a challenge for the county.
The Solution
Santa Clara County realized they needed to start with Master Data Management (MDM) in order to save time and money, but with most of their data in a relational database, they had performance issues.
The Results
After upgrading to TigerGraph, Amgen was able to load the data a lot faster and identified referral networks in a massive dataset in terabytes
Testimonials
Accelerating Advanced Analytics, AI and Machine Learning with Graph.

The Challenge
With multiple case management systems built over the last 25 years using different technologies and different vendors, finding the most recent information about a person was a challenge for the county. There could, for example, be a thousand Joe Smiths in database, each with different phone numbers, different addresses or even different names, and trying to find out “who was who” became a challenge. With families on welfare, sometimes across generations, there might be a mother, father, two or three kids, and a grandmother that may be eligible for federal and state benefits and that was when it started to get complicated. The county realized they needed to not only look at individuals but also at family household relationships of Joe Smith – where he lives, who his parents are, details about his spouse and children, and so on. The county needed to see what benefits they were all getting and determine if anyone was getting double benefits or not receiving the benefits due to them.
The Solution
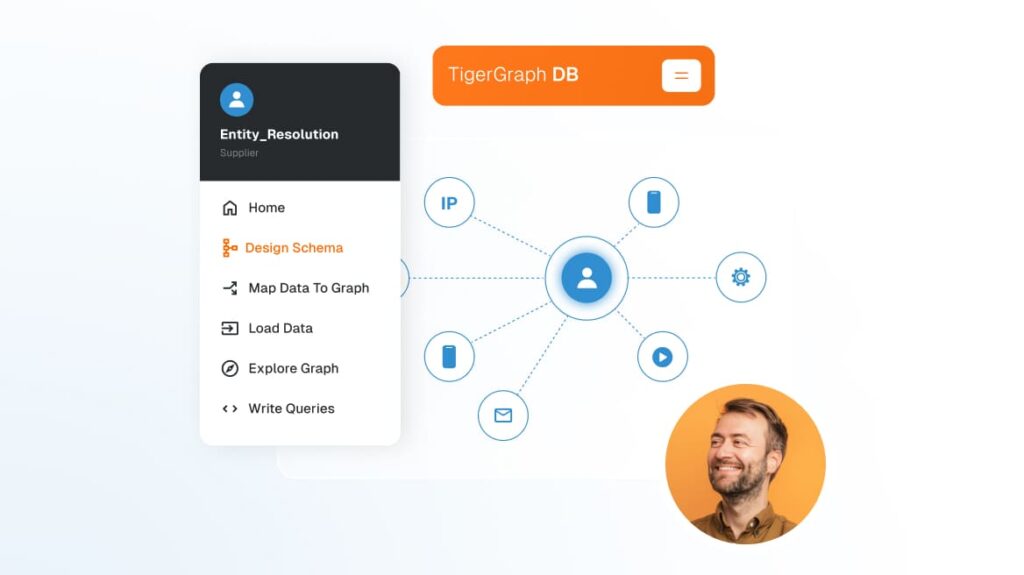
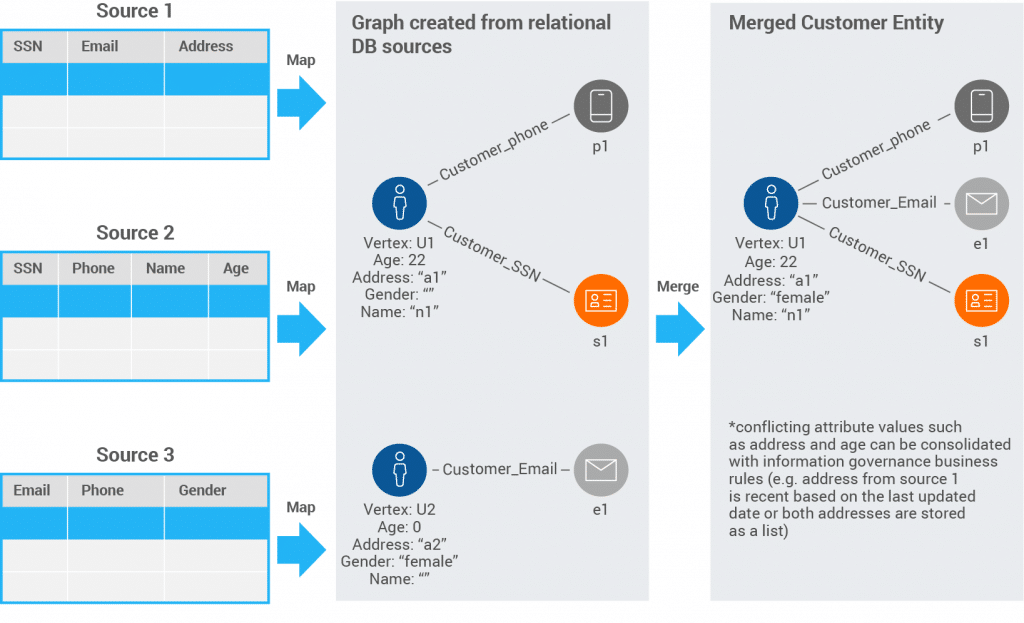
Santa Clara County realized they needed to start with Master Data Management (MDM) in order to save time and money, but with most of their data in a relational database, they had performance issues. Relational databases are great tools for indexing and searching for data, as well as for supporting transactions and performing basic analysis; however relational databases are poorly-equipped to connect across the tables or business entities and identify hidden relationships and patterns. They realized that a native parallel Graph could connect across multiple sources to create a single record.
After an extensive review of technology solutions, the county chose TigerGraph to provide a Graph database and analytics platform.
“As we were doing the MDM implementation, we were pulling the data together and matching the individuals, but then realized we needed a better tool for relationships, to find how one individual relates to another,” says Ely Turkenitz, Information Systems Manager. “The questions that Graph databases answer are hard to come by in RDBMS or it takes forever. We needed a better tool to find relationships and TigerGraph was just that.”
The Results
Being a government organization short on staff and with much to do, the county immediately saw the value of TigerGraph. What would take hours or days, or could not be done at all, was done instantly. With TigerGraph they were quickly able to easily see how individual beneficiaries were connected to each other as a part of a household and across households, in order to consolidate and compute the welfare benefits for individuals and across the household to review potential fraud or abuse.
“TigerGraph allowed us to look at certain characteristics of an individual and then jump instantly to another related individual, answering questions beautifully, which we could not do before,” said Turkenitz.
“TigerGraph allowed us to look at certain characteristics of an individual and then jump instantly to another related individual, answering questions beautifully, which we could not do before,” said Turkenitz.
More stories


Ready to Harness the Power of Connected Data?
Start your journey with TigerGraph today!