Artificial Intelligence & Machine Learning

Improve Machine Learning and Explainable AI With a Graph Database

Graph Machine Learning Has the Potential to Transform Businesses

Many organizations are using artificial intelligence (AI) and machine learning (ML) to provide them with competitive advantages. Businesses are expected to spend $57.6 billion on AI and ML by 2021 and to reap $2.9 trillion in business value as a result. Artificial intelligence and machine learning are behind the headline-grabbing applications such as self-driving cars and virtual personal assistants (such as Siri and Alexa), but they are also providing better performance and cost savings for universal tasks such as online chat and customer support, product recommendations, design support, and fraud detection. For enterprises, the decision has become not whether to use machine learning, but where to use it and how to do it well.

Legacy Approaches to Machine Learning

Legacy Approaches to Machine Learning Are Insufficient

Machine learning uses analytical and statistical techniques to uncover patterns in data and provide businesses with more insightful conclusions The results, however, are limited by two factors: how good is the data and how good are the analytics?

You can’t detect a pattern in data if the pattern isn’t there or if the pattern is very weak. To succeed, your data needs to consist of millions of records, to cover a variety of cases, and hopefully to draw from multiple sources. In our increasingly digitized world, harvesting raw data is much less of a problem. Several challenges remain. These include:

  • Feature selection – Do I have the right data?
  • Data integration – How do I bring my data from multiple sources together into one unified data model? 
  • Analytical performance – With so much data, can I afford the computational effort?

Traditional approaches often fail due to a lack of variety of features that have a high correlation to the outcome and low volume of the training data, resulting in poor accuracy for machine learning solutions.

Why TigerGraph, a Native Parallel Graph Database for Powering Artificial Intelligence and Machine Learning?

Real-Time Graph Analytics

Develop Machine Learning Features With Real-Time Graph Analytics

Graph databases offer solutions to many of these ML data challenges. Graphs are built on the idea of connecting and traversing links, so they are the natural choice for data integration. Graphs can also enrich the raw data. In traditional tabular data, each column is one “feature” that the ML system can use. In a graph, each type of connection is an additional feature. Moreover, small graph patterns, such as causal chains, loops, and forks can themselves be considered features.

TigerGraph’s deep link analytics means it can process the datasets with terabytes of data, and traverse millions of connections in a fraction of a second. 

Fraudsters get away with billions of dollars of fraud each year. The measure of an anti-fraud detection and prevention system is not whether it can catch fraud, but how much. 

China Mobile is using TigerGraph to check each of its hundreds of millions of daily calls in real time to see if it looks to be from a spammer or phone-based fraudster. China Mobile gathers over 118 graph features for each of its hundreds of millions of subscriber phones to feed its ML fraud detection engine, builds a detection model, and then again extracts the 118 features for each phone with every call in real-time. This generates training dataset with billions of new features, resulting in improved accuracy of the fraud detection.

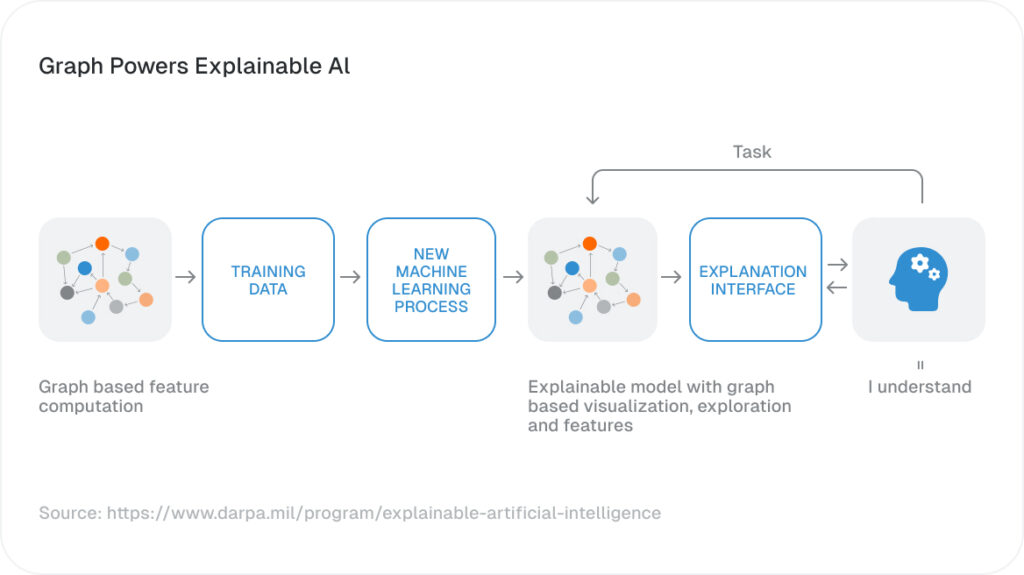
Improve Explainable Artificial Intelligence With Graph Analytics

One of the biggest obstacles to widespread artificial intelligence adoption is a lack of transparency as to how the AI system arrived at a particular decision. Consider a welfare claim that was rejected, after an artificial intelligence computed a high probability of potential fraud based on the history of previous claims from the recipient. The welfare recipient deserves to know why his or her claim was rejected and the government organization needs to make sure that it wasn’t due to a bias against a specific race, religion, gender, or culture.

Consider another example where the AI system computes and offers a mortgage with a higher rate of interest or an insurance policy with a higher premium to an applicant. Again, it’s important for the bank or insurance company to explain the higher rate of interest for the loan or higher premium for a policy, especially in case of litigations related to race, ethnicity, culture, or gender bias. Machine learning features developed using TigerGraph can be used to explain clearly why the AI solution arrived at a particular decision based on the combination of the computed feature values. Moreover, TigerGraph’s GraphStudio can show how the features were computed and what led to a particular welfare claim being rejected or a higher mortgage interest rate for an applicant, or a higher premium insurance policy. 

TigerGraph ensures that the explainable AI can be rolled out to all the users within the enterprise as well as external parties such as the welfare recipients, mortgage, and insurance policy applicants with real-time visualization, exploration, and analytics of interconnected data.

Improve Explainable Artificial Intelligence