

Transform Financial Services With a TigerGraph Financial Database and AI
Increase in monthly successful fraud attempts for mid-large US retailers
Cost per dollar of fraud for US retail and eCommerce merchants
$1.5 Billion in OFAC sanctions penalties for 2023

Can Uncover Patterns of Financial Fraud
Tame the Rising Costs of Payments Fraud in Financial Services
Find Patterns of Fraud in Connected Data
Traditional fraud analytics solutions can’t detect the bulk of the online payment fraud, as they can’t find complex payment fraud patterns with 6 or more connections or hops linking current payment to historical fraudulent activity. TigerGraph provides the financial database analytics for leading financial institutions to find these patterns going 6 or more hops into the connected data and stop fraudulent transactions in real-time.
Read More
Improve Credit and Regulatory DataRisk Assessment and Monitoring with Enterprise Knowledge Graph
Banks using traditional solutions struggle to vet every account and payment in order to maintain regulatory compliance, resulting in $1.5B in fines in 2023. TigerGraph provides analytics for risk assessment and monitoring by building an unified database for financial data, ownership, and other relevant data to find and flag connections with sanctioned entities. TigerGraph also finds potential money laundering rings and other suspicious activity.
Read MoreDeliver a Real-time Customer 360 Across All Touchpoints
Financial services has moved beyond banks and credit card companies, to Buy-Now-Pay-Later services (Klarna, Amazon, Walmart), cash transfer (Venmo, PayPal) and point-of-sale financing (Affirm, Square). More than ever, financial services organizations need to tap into their core asset – customer data. TigerGraph can bring together dozens of datasets into a global financial development database, connecting the entire customer journey across all channels.
TigerGraph also allows customer service, sales, marketing and other client facing employees to find similar customers in real-time and create recommendations for cross-sell, up-sell as well as for churn prevention.
Read More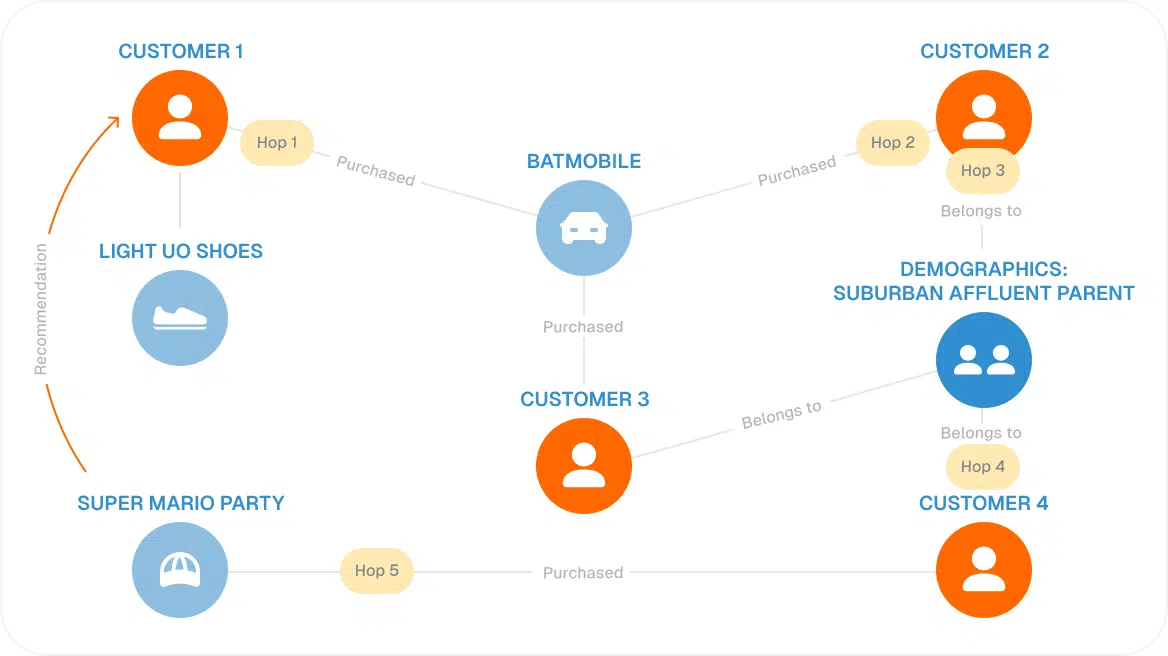
FAQ
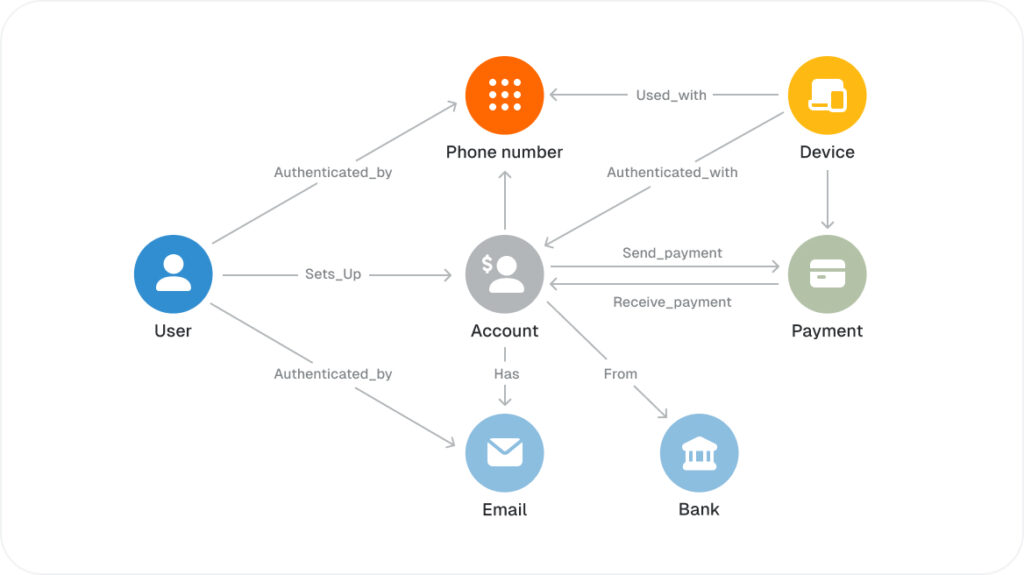
A graph-based financial services database stores and analyzes connected data about account holders, service offerings, and service activity including transactions and how they were conducted. Leveraging the connected data, financial service organizations are better equipped to predict fraud, assess risk, satisfy KYC and other compliance requirements, and offer personalized recommendations and interactions.
A graph offers several advantages for financial service databases:
- The explicit and easily-explored relationships provide faster investigations and more thorough and explainable reports, with less effort.
- The improved insights, context, and pattern detection result in more accurate fraud prediction.
- The graph provides a flexible Customer 360 view for a finer grained and more personalized understanding of each customer.
Tasks such as fraud detection, KYC, risk assessment require a comprehensive analysis of data, including seeing patterns of activity and how parties are related to one another. Tabular databases are not built for this type of activity and cannot perform it quickly or at scale. Graphs, on the other hand, are outstanding from finding and analyzing connectional patterns and seeing similarities.
Yes, TigerGraph is built for scalability, with massively parallel processing (MPP) and distributed database architecture. This means to handle bigger and bigger data sets, just add more servers, and the performance will keep up. TigerGraph has been benchmarked up to 108 TB.
Yes! Just ask TigerGraph’s customers, such as JP Morgan Chase, Bank of America.
TigerGraph features include encrypted data transfer, fine-grained access control, advanced user authentication, high availability, cross-region replication, disaster recovery support, and detailed audit logs.
TigerGraph is the top financial graph database because it offers:
- Real-time deep-link analytics
- Scalability to handle enterprise-level data volumes
- Machine learning integration for improved accuracy
- FinServ-level security, reliability, and data connectivity
- Proven track record with major financial institutions and government agencies