A Buyer’s Guide to the Fraud Technology Market
Fraud programs are not struggling because they lack tools. They are struggling because many tools do not share a consistent view of who is involved and how activity connects across systems. As a result, teams spend significant time rebuilding context manually before they can make a decision.
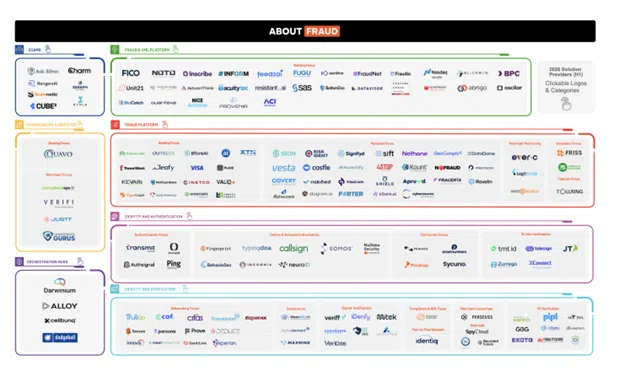
This post outlines how the fraud technology market is structured, where fragmentation typically appears, and how to evaluate architectures that reduce manual context assembly. Reference the About Fraud – 2026 Fraud Solution Provider Infographic https://www.about-fraud.com/
Key takeaways
- The fraud technology market spans multiple functional categories, and most stacks combine several of them.
- High-impact fraud patterns are distributed across accounts and time windows, not isolated events.
- Point solutions handle individual detection tasks and generate risk signals. Turning those signals into defensible evidence usually requires additional manual context assembly across tools.
- A connected intelligence layer reduces reconciliation work, improves detection of network patterns, and strengthens explainability. Explainability means teams can show why an alert was generated and how the evidence connects.
- TigerGraph fits when connected context must be operational at scale, with predictable performance and explainable outputs.
Market Buckets and What Each One Does
Fraud teams buy capabilities, not vendor names. Each category below solves a specific problem, but none of them sees the full picture on its own. To keep this simple, the buckets below answer one question. What job does each category do in a typical fraud workflow, and where does it hand off work to people because the data does not connect cleanly?
Fraud platforms and transaction monitoring
This bucket covers scoring, monitoring, alerting and case initiation across channels. These tools often serve as the operational entry point for detection and triage.
Limitations appear when detection depends on understanding how multiple events relate to one another rather than evaluating each transaction in isolation.
Many costly patterns only appear when teams connect activity across customers, accounts, counterparties, merchants, devices and time windows. That connection step is often manual when each tool holds only part of the story.
Transaction monitoring often starts the investigation, but not all fraud looks like an “unauthorized transaction.” Many losses come from scams where the customer authorizes the payment under manipulation. That shifts the detection problem to scams and social engineering.
Scams and social engineering controls
This bucket focuses on scam detection and intervention, including patterns tied to manipulation, mule activity, and rapid movement through accounts. Mule activity refers to accounts that receive and move funds on behalf of others to obscure where the money is going. The goal is to prevent authorized activity that is still fraudulent in intent.
These programs depend on fast linkage across behavior signals, counterparties, and prior activity patterns that repeat across accounts and channels. Scams often reuse infrastructure and spread through networks, which increases the value of relationship evidence during triage. This relationship evidence is a set of connections between shared, repeated or reused parties, accounts and devices.
Whereas scam detection examines connections across accounts and behaviors, identity and authentication criteria approach the question differently. The goal here is to help teams determine whether the person logging in is legitimate and if the session behavior matches user activity.
Identity and authentication
This bucket covers tools that help you decide whether a login or session looks legitimate. It includes device and session signals, step-up checks when risk is higher, including two-factor authentication passcodes, and behavioral indicators that flag unusual activity. These controls help prevent account takeover and other access-related fraud.
Login signals are most useful when they connect to what happens next in the account lifecycle, such as transactions, changes to contact information, or interactions with other accounts.
A risky session matters more when it links to suspicious account activity, reused devices or contact details across multiple accounts, or connections to known fraud networks. If fraud is detected, teams also need to determine whether a larger pattern is at play or if the attempt is a one-off anomaly.
This work relates to access requests in the moment, but it starts with identity verification and onboarding. This is where the focus rests squarely on who is entering the ecosystem in the first place and where identity credibility is established.
Identity verification and onboarding
This bucket covers identity verification at onboarding, including document checks, biometrics and onboarding decisioning. These tools reduce immediate onboarding fraud risk.
Fraud risk continues after onboarding. Programs need a way to recognize the same person or organization over time, even when data arrives from different systems. This way, new signals connect back to the same underlying identity and related accounts.
Identifying fraud early is optimal, but some types of fraud are downstream challenges requiring teams to reconstruct events. With chargebacks and disputes, recovery hinges on how clearly these details can be documented.
Chargebacks and disputes
This bucket covers post-transaction dispute workflows, chargeback management and operational handling across merchant and consumer contexts. These processes manage downstream cost and recovery.
Disputes often require cross-system evidence gathering and identity reconciliation, meaning confirming that records across systems refer to the same person or account. When identity and relationship context remain fragmented, teams spend time reconstructing not only what happened, but also who the key players are and how they connect.
Once evidence is gathered, teams need to quickly route alerts through the organization to take action.
Orchestration and workflow hubs
This bucket covers the tools that route work. It includes decision orchestration, alert routing and case workflow systems that assign tasks, manage approvals and track progress across teams and other tools.
Workflow makes the process run more smoothly, but it does not fix fragmented data. If identity and relationship context are scattered across systems, workflows can only move partial information from one place to another, leaving analysts to rebuild the full picture by hand.
Over time, these modern fraud stacks show predictable strain points.
Where Stacks Break Down
When complexity accumulates, failure points emerge.
- Identity is inconsistent across systems, which creates duplication and ambiguity.
- Relationship context is fragmented, which forces manual linkage across tools.
- Network patterns are difficult to detect consistently, which leaves multi-entity behavior underdetected or inconsistently flagged.
- Evidence assembly becomes manual, which slows triage and weakens explainability.
- Operational load increases as tools accumulate, which expands integration and reconciliation work.
These are not isolated technical isues. They are connected-data constraints that impact how quickly fraud cases are resolved, governance burden and analyst workload.
This is why stacks can grow while performance plateaus. The operating model becomes a collection of systems that detect events while people reconstruct context.
A program can quickly and consistently connect activity to a pattern when relationships are treated as first-class data. This means connections are stored and evaluated as part of the data model instead of being pieced together from separate systems for each investigation.
And this is where graph comes in. A graph database stores accounts and the relationships between them so teams can query connections directly, rather than reconstructing them case by case.
Where fraud becomes a graph problem
Fraud becomes a graph problem when the risk signal is not contained in a single event. The signal is a pattern that only becomes visible when people, accounts, devices and transactions connect over time.
Common examples include:
- Mule activity and funnel accounts. Many senders route value into a small number of receivers, followed by rapid movement or cash-out.
- Collusive networks. Connected accounts and merchants coordinate behavior and reuse infrastructure.
- Synthetic identity clusters. Multiple identities share phones, emails, addresses, devices or other attributes across accounts.
- Layered movement. Value moves through multiple hops across accounts and intermediaries within defined time windows.
- Cross-channel linkage. Authentication anomalies become more meaningful when tied to downstream account behavior and network exposure.
These patterns are difficult to manage when relationship logic is scattered across tools and application code. They are also difficult to defend when evidence is assembled manually.
Where TigerGraph Fits
TigerGraph is suited for fraud programs that need connected context operational at scale, with predictable performance and explainable outputs.
In fraud workflows, TigerGraph supports:
- Connected views across fragmented data sources
- Multi-hop detection of network-based patterns, meaning detection that follows connections across several steps, (for example, across accounts, customers, merchants, devices, and events)
- Query-driven logic that centralizes relationship rules and governance boundaries
- Explainable evidence paths that accelerate investigation and support auditability
- Modernization approaches that augment existing tools rather than forcing immediate rip and replace
TigerGraph keeps relationship logic in one place. Instead of spreading detection rules across application code, spreadsheets, and manual enrichment steps, teams can define common fraud and laundering patterns directly as graph queries. Those queries can enforce scope boundaries on what context is pulled into an investigation and return relationship paths that explain why an account was flagged.
If your fraud program is modernizing transaction monitoring, identity workflows, or case operations, evaluate whether you also need a connected intelligence layer that makes relationships and evidence paths clear.
TigerGraph can walk through a representative fraud pattern and show how to return explainable paths that investigators and governance teams can use.
How to Evaluate Vendors Without Getting Trapped
Procurement often focuses on feature coverage within a category. That is necessary, but it is not sufficient.
The most useful evaluation question is whether a tool reduces manual context assembly. If it generates more alerts without improving identity resolution, relationship reasoning, or explainability, it can increase workload even when detection coverage improves.
A practical approach is to evaluate how each category performs in a full workflow. Start with one representative fraud pattern. Trace what it takes to move from signal to evidence to action. Count the handoffs. Identify where investigators still rebuild the same context.
Then use the checklist below to compare tools and architectures.
Evaluation checklist for buyers
- Does the solution improve decisions, or does it mainly produce more alerts?
- Can it unify identity across sources, channels and time windows?
- Can it support multi-hop relationship reasoning at an operational scale?
- Can it control what context is pulled and how far relationship expansion can go so results remain governed and consistent?
- Can it return explainable evidence paths that investigators can act on and auditors can review?
- Does it reduce manual reconciliation and repeated research across tools?
The fraud-fighting market is large because fraud is multi-surface and constantly evolving. Most organizations will continue to rely on multiple point solutions.
TigerGraph fits when connected reasoning must be operational, predictable and explainable in production workflows.
Frequently Asked Questions
Why do Fraud Teams Still Spend so Much Time “Rebuilding the Story” for Every Case?
Because most fraud stacks detect events, not connected patterns. Identity and relationship context lives across multiple tools, so investigators still have to manually stitch together who’s involved, what’s shared, and how activity connects before they can make a defensible decision.
Why are Scams, Mule Networks, and Coordinated Fraud so Hard to Catch Consistently?
Because the signal is distributed across accounts, devices, counterparties, and time windows. These attacks reuse infrastructure and spread through networks, so point solutions often see only fragments — which leads to missed rings, delayed detection, and inconsistent outcomes.
What is a Connected Intelligence Layer in Fraud Prevention?
A connected intelligence layer unifies identity and relationships across systems so fraud teams can reason across customers, accounts, devices, merchants, and transactions in one view. It turns isolated risk signals into connected evidence that investigators can act on.
How does Graph Technology Improve Fraud Detection and Explainability?
Graph makes relationships first-class data, so teams can detect multi-hop patterns directly instead of reconstructing them case by case. It also returns evidence paths — the specific connections that explain why an entity was flagged and how the behavior fits a known fraud pattern.
What is the Most Important Question to Ask When Evaluating Fraud Vendors?
Does it reduce manual context assembly. If a tool produces more alerts without unifying identity, connecting relationship evidence, and returning explainable paths, it increases workload — even if detection coverage improves.
