Capturing Cross-Border Routing Signals That Hide in Plain Sight
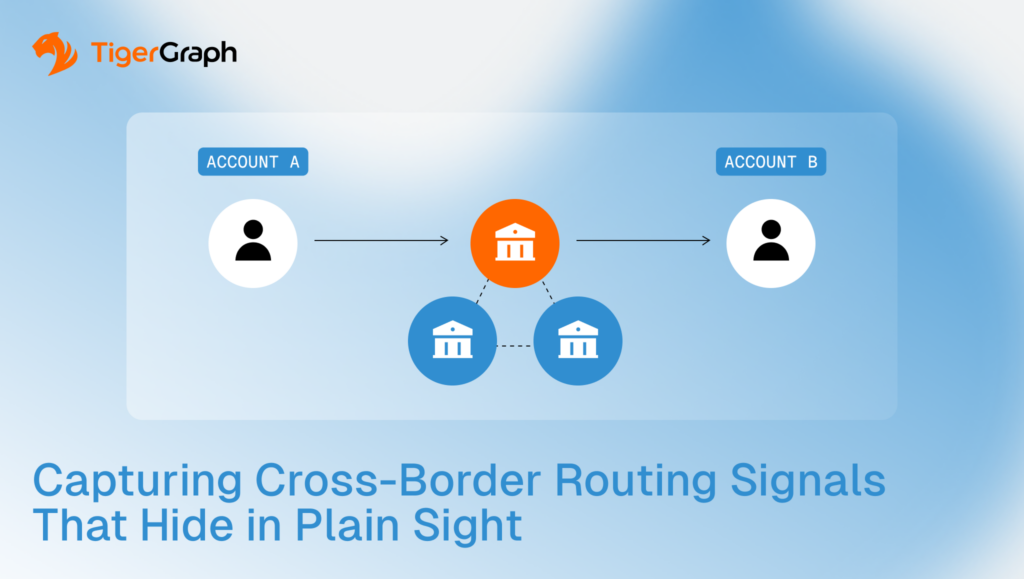
Cross-border routing risk usually shows up in the route choices, not the transfer amount. The same corridor, meaning the same route between two countries or jurisdictions, keeps reappearing. The same intermediary, which is the institution or account used as a middle step, shows up in the middle. And the same multi-step path repeats across connected activity.
Graph analytics makes routing behavior visible by returning the full path, the chain of steps from origin to destination, as a reviewable output.
Key takeaways
- Cross-border risk often shows up in the route, not in any single transfer.
• Graph traversal follows connections step by step, tracing a payment route through intermediaries and surfacing repeat corridors, exposing cross-border loop patterns that are easy to miss in transaction-only review.
• Routing through secrecy jurisdictions matters more when the same choice repeats across connected accounts and the same route structure keeps reappearing.
Why Cross-border Monitoring Fails When it is Transaction-centric
A single cross-border transfer can be legitimate. A transaction-centric view focused on individual transfers rather than connected routing patterns can still miss risk when the behavior is distributed across accounts, intermediaries and time windows.
In cross-border routing, the pattern often emerges across repeated routes. The same corridor appears repeatedly, with the same intermediary institutions or entities appearing in the middle. The sequence of jurisdictions also repeats with a similar structure.
Those signals are difficult to validate when the workflow cannot return the full path as a reviewable result. As a result, the team ends up reviewing fragments instead of routing behavior.
The signals below focus on routing structure. Each becomes more meaningful when it repeats across connected activity.
Cross-border Routing Signals that Matter
The signals below are rarely decisive in isolation. They become more meaningful when they repeat as a structure across connected entities, recurring routes and reused intermediaries.
Transaction loops across jurisdictions
Looping routes occur when a value moves across borders and returns to an earlier point in the network. The operational question is whether the loop structure repeats, whether it reuses the same intermediaries, and whether it concentrates in a connected group rather than appearing as one-off noise.
Shift from domestic to international activity
A shift to international activity can reflect normal growth or a new business pattern. The signal strengthens when the shift is abrupt, repeats across linked entities, or coincides with new routing choices that reuse the same intermediaries or corridors.
Routing through high-risk jurisdictions
Treat jurisdiction risk as a program-defined input. This signal strengthens when routing repeatedly passes through jurisdictions your program flags, especially when the same corridor and intermediaries recur across connected activity.
Funds passing through secrecy jurisdictions
Secrecy jurisdictions are not automatically suspicious. The signal becomes more meaningful when routing through secrecy jurisdictions repeats as a routing choice across connected entities and appears as part of a recurring route structure that relies on the same intermediaries.
What Graph adds to Routing Analysis
Graph analytics changes both detection and explanation of an analysis, because relationships are stored directly and routing paths can be returned for review.
Graph workflows can define corridors as repeated routes between jurisdictions and institutions. They can detect cross-border loop motifs as structure rather than as isolated events. They can also surface repeated intermediary choices by showing where the same intermediary appears across many paths.
Graph workflows support practical comparison. Teams can compare the routes in a given case to routes that show up for the same customer, connected group, or corridor in the same time window. This helps separate common routing behavior from routing that is unusual for the network context.
Most importantly, as noted, graph workflows preserve the path. Reviewers can see how exposure accumulated across hops, which is one relationship step from one entity to the next. This prevents guessing based on partial evidence.
How to Keep High-risk Language Accurate
Treat high-risk jurisdictions as a program decision, not a universal fact. Different organizations use different thresholds and definitions.
Start with your program’s inputs. Use your jurisdiction ratings and policy thresholds. Then describe what you actually observed in plain routing terms. The same route repeated. The same corridor showed up again. The same intermediaries appeared in the middle. A loop pattern reappeared.
This keeps the write-up focused on structure and evidence. It avoids implying intent or certainty that the data cannot prove.
How TigerGraph Supports Investigation-grade Routing Outputs
In general, a graph supports routing analysis because it represents connections directly and can return the connecting paths for review.
TigerGraph fits routing workflows when teams need deep relationship analysis at investigation depth and need results that are consistent and reviewable as the path expands across multiple hops.
TigerGraph supports traversal and pattern queries in-platform, so teams can run multi-step routing analysis and return the full path as a reviewable output without exporting work to other tools.
When the platform can return the route as evidence, investigators spend less time reconstructing the story and more time validating what the route means in context.
Use this implementation checklist to get started:
- Build path views by customer, connected group, and corridor.
- Track repeated intermediaries and repeated routing choices inside defined time windows.
- Return explainable outputs. Store the entities involved and the connecting paths so results are reviewable and reproducible.
- Keep outcome language disciplined. Routing structures support prioritization and investigation. They do not, on their own, prove intent.
Consider selecting three recent cross-border cases where routing affected the decision. Document the evidence your reviewers needed to see. Then assess whether your workflow can return it without manual reconstruction.
- Can the workflow return the full routing path across multiple hops?
- Can it show corridor reuse and intermediary recurrence inside a defined time window?
- Can a second reviewer reproduce the same routing view and the same connecting path evidence?
If the evidence chain still depends on manual stitching across tools, the workflow has a routing visibility gap.
Conclusion
Cross-border risk appears as repeated routing choices, corridor reuse and looping patterns that become visible when teams can follow paths across intermediaries.
Graph-based routing analysis turns international activity into reviewable evidence. It helps teams prioritize and escalate based on structure and reproducible paths rather than isolated fragments.
When your program needs repeatable routing analysis with reviewable path outputs at investigation depth, TigerGraph should be on your vendor shortlist. Reach out today to learn more.
Frequently Asked Questions
1. What are Cross-border Routing Patterns in Anti-money Laundering Investigations?
Cross-border routing patterns describe how funds move through multiple countries, institutions, and intermediaries before reaching their final destination. In AML investigations, risk signals often appear in the structure of the route, such as repeated corridors between jurisdictions, recurring intermediary banks, or looping paths that move funds across borders and back again.
2. Why can Transaction-level Monitoring Miss Cross-border Laundering Signals?
Transaction-level monitoring typically evaluates transfers one at a time based on amount, origin, or destination. When suspicious behavior is distributed across multiple transactions, intermediaries, and accounts, each transfer may appear legitimate on its own. The risk only becomes visible when investigators analyze how these transactions connect across a broader payment network.
3. What is a Transaction Corridor in Cross-border Payment Analysis?
A transaction corridor refers to a repeated route that funds take between two jurisdictions or financial systems. For example, payments may consistently move through the same intermediary bank or sequence of countries. When the same corridor appears repeatedly across connected accounts or entities, it may indicate coordinated routing behavior that warrants further review.
4. How does Graph Analytics Improve Cross-border Routing Analysis?
Graph analytics models financial entities, accounts, and transactions as a network of relationships. Investigators can follow these connections step by step to reconstruct payment routes and identify recurring intermediaries, jurisdiction sequences, or loop patterns. This network perspective helps analysts detect routing structures that are difficult to identify using traditional transaction-based analysis.
5. Why is Path Evidence Important When Investigating Cross-border Financial Activity?
Path evidence shows the full chain of institutions, accounts, and jurisdictions involved in moving funds across borders. Instead of reviewing isolated transactions, investigators can see the exact sequence of connections linking origin and destination. This evidence helps compliance teams explain escalation decisions and ensures that routing behavior can be reviewed consistently by auditors and regulators.
