Graph Algorithms: The Secret Engine Behind Faster, Smarter Business Growth
Every enterprise has tons of data, but most struggle to use it in ways that drive strategy. Graph algorithms are the hidden engines that bring those dots to life, revealing how people, accounts, devices, or products interact. Instead of isolated records, they uncover the relationships and pathways that matter most—from PageRank to community detection—surfacing insights traditional analytics miss and translating them into faster fraud detection, efficient operations, and higher ROI.
Expanded: What Are Graph Algorithms?
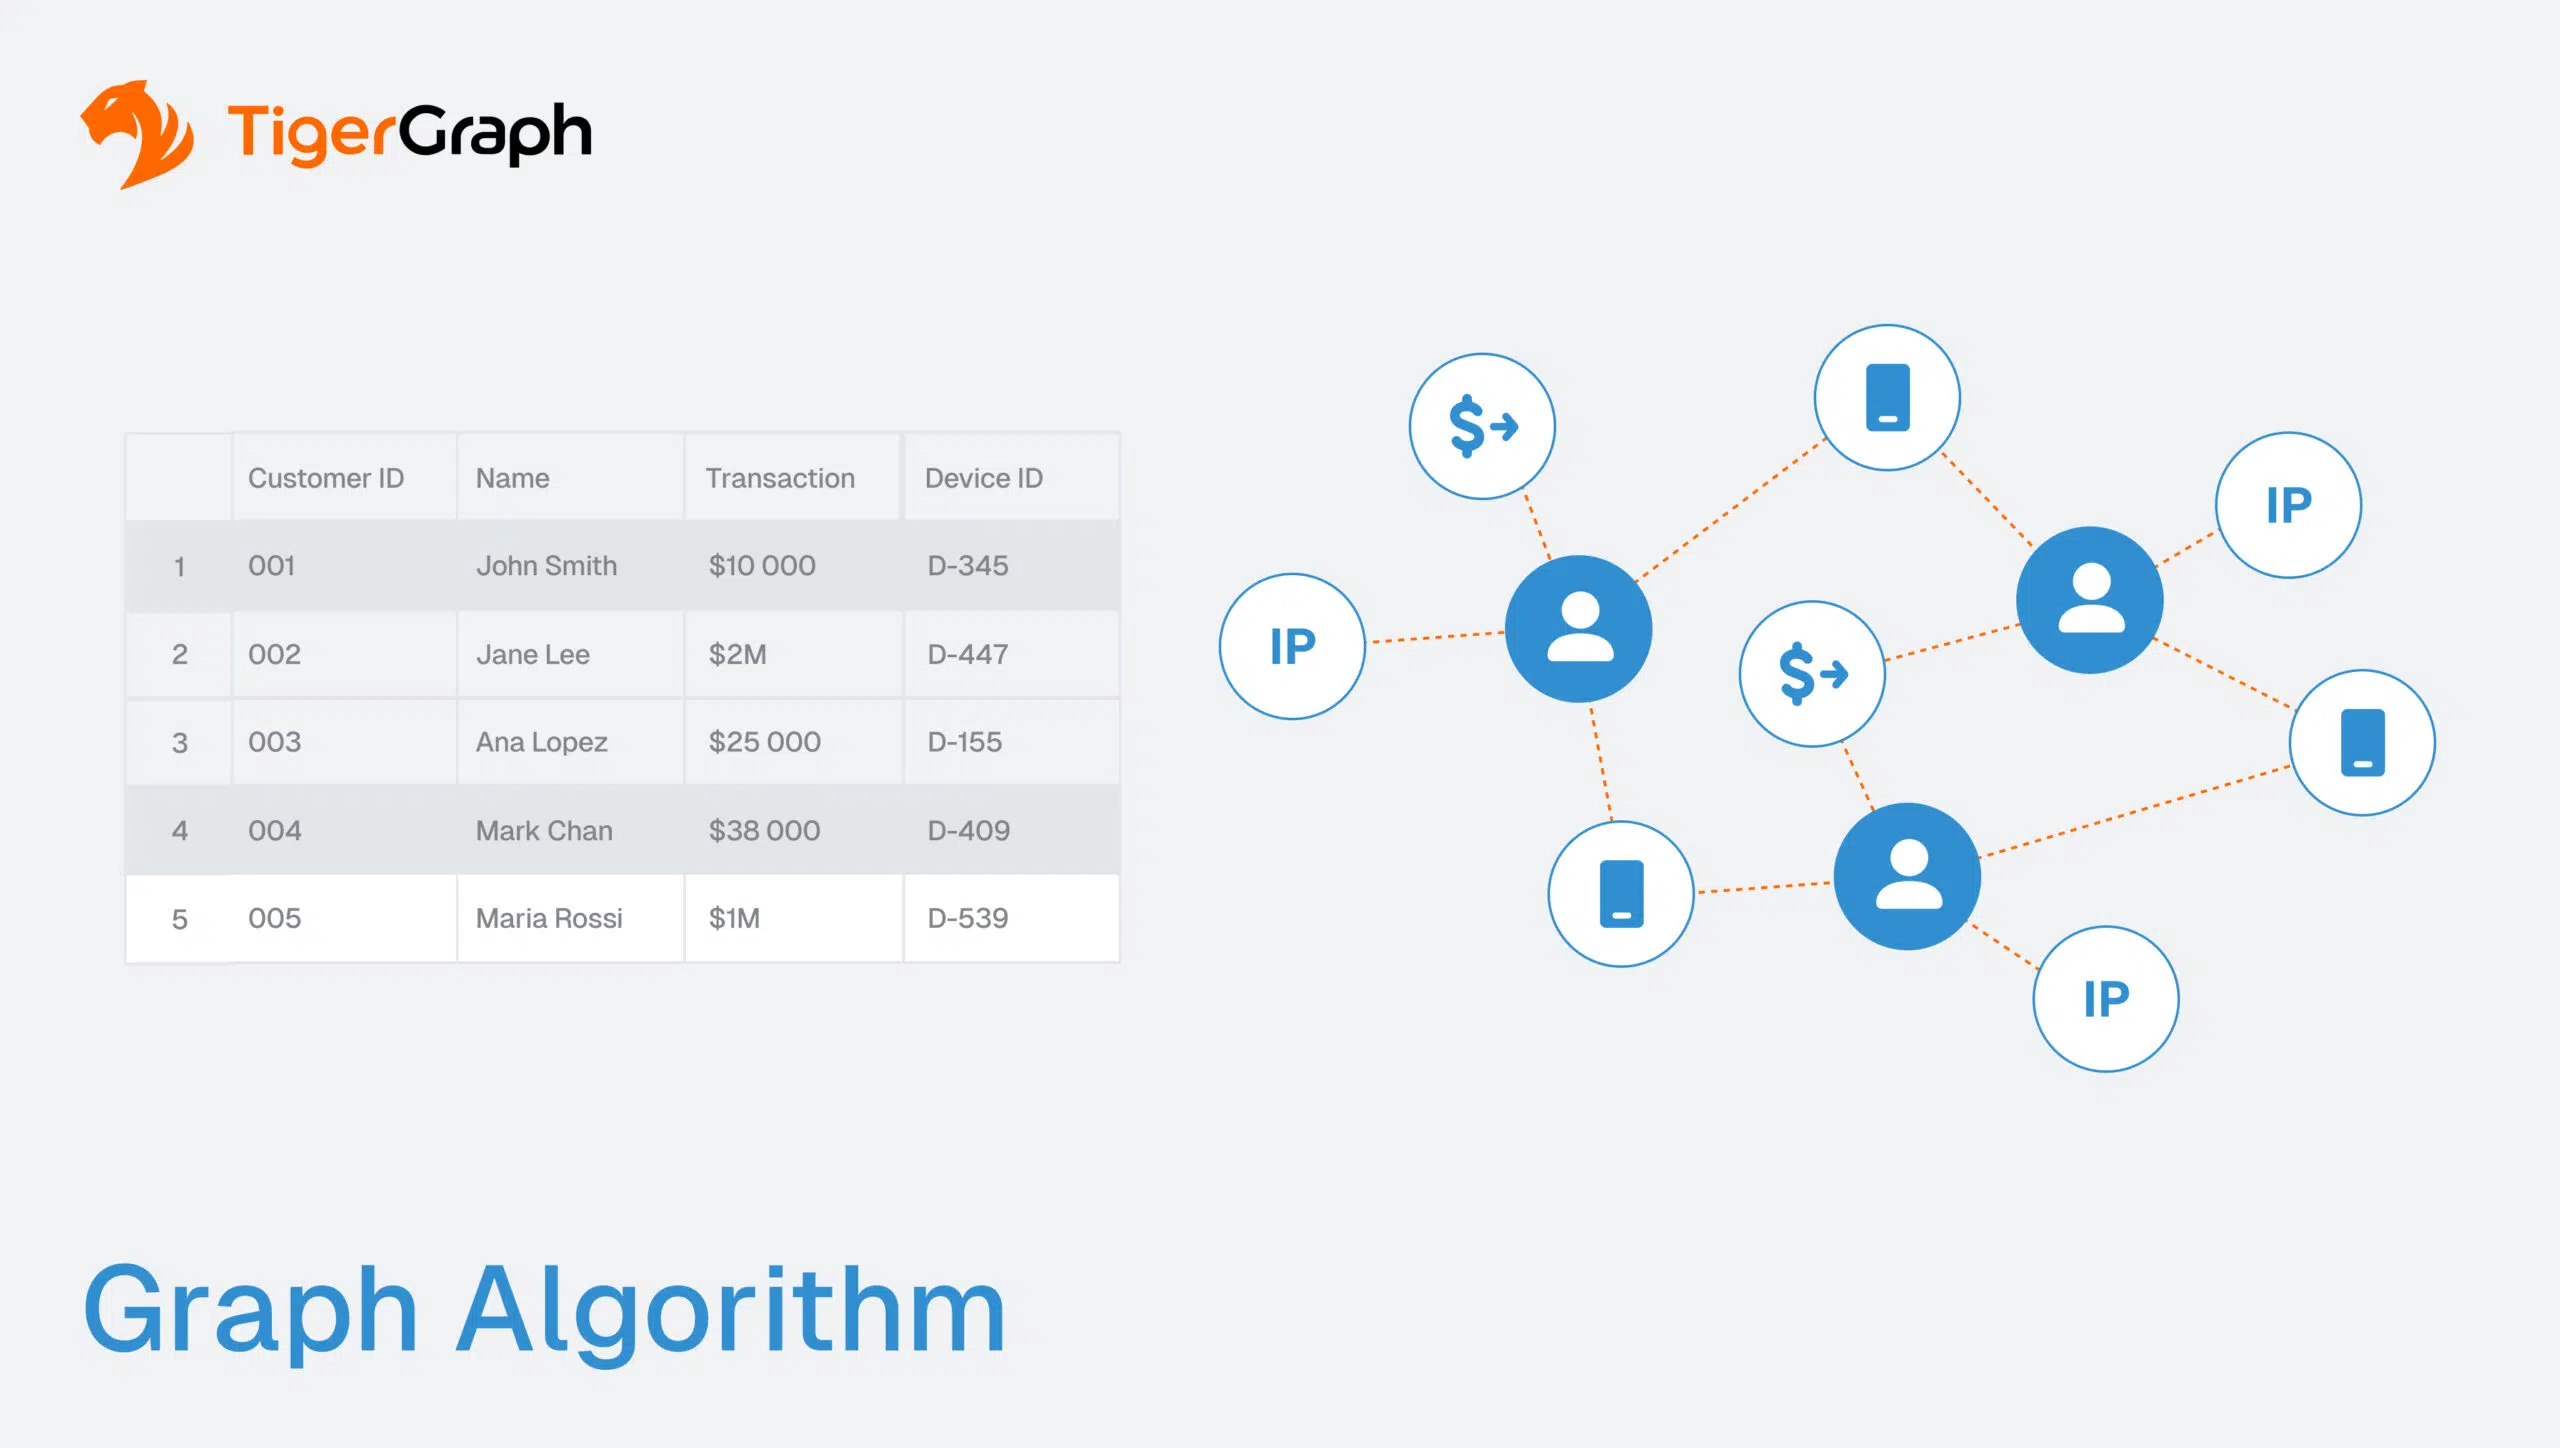
A graph algorithm is a packaged set of instructions designed to analyze a network of data, known as a graph. In a graph, the data points are called nodes (such as customers, accounts, or suppliers) and the connections between them are called edges (such as transactions, contracts, or device usage). By studying how nodes are connected, these algorithms help answer complex business questions that would be invisible in flat data tables.
For example:
- Influence: Which customer has the greatest impact on referrals or adoption?
- Pathways: What is the fastest or cheapest or most reliable route between suppliers in a global chain?
- Risk: Which clusters of accounts exhibit suspicious activity that may signal fraud rings or collusion?
Unlike traditional analytics, which excel at summarizing rows of data, graph algorithms specialize in patterns of interaction. They highlight central hubs that play outsized roles, detect anomalies that don’t fit normal behavior, and uncover hidden communities that standard dashboards can’t show.
Comparison at a glance:
| Traditional Analytics | Graph Algorithms |
|---|---|
| Focuses on isolated rows | Focuses on relationships and paths |
| Performs well only on one table at a time | Connects across multiple data sources |
| Provides reactive alerts | Proactively detects evolving patterns |
| Struggles to scale with multi-table tasks | Built for deep, multi-hop analysis on billions of records |
By making connections the centerpiece of analysis, enterprises have the ability to move beyond “what happened” and start asking “why it happened” and “what will happen next”—often easiest to communicate via a graph visualization.
Enterprise Value of Graph Algorithms
When enterprises apply graph algorithms to their data, they unlock value far beyond what rows and tables can deliver. There’s a shift from isolated records to connected intelligence that creates measurable impact in multiple areas of business.
- Efficiency in operations
In a global logistics network, the routes, warehouses, and vehicles create an interconnected system. Any delays are felt across the chain.
So, identifying the most efficient routes, reducing delivery times, and cutting costs is essential. What once took weeks of manual planning can be solved in seconds, keeping supply chains resilient even under stress. This is why graph algorithms for supply chain optimization are becoming a board-level priority.
- Fraud prevention
Fraud detection is one of the most powerful applications of graph algorithms. In banking, PageRank and betweenness centrality identify high-risk nodes—mule accounts, collusive merchants, or devices quietly connecting fraud rings. With TigerGraph, customers have reported a 20% improvement in fraud detection accuracy and 300% faster investigations by using these graph features. Instead of chasing anomalies in isolation, risk teams dismantle entire fraud networks as they form. Many top banks are already using graph algorithms for fraud detection at scale.
- Customer insights
In retail and consumer services, community detection graph algorithms uncover clusters of customers with shared behaviors, purchases, or interests. These communities represent opportunities—for cross-selling, upselling, and loyalty-building programs.
By targeting clusters rather than individuals, businesses market more effectively and achieve higher ROI. Graph algorithms for customer community detection are transforming segmentation strategies.
- Innovation and forecasting
Beyond detection, graph algorithms fuel innovation. Influence-spread models simulate information, behaviors, or products movement through a network. Marketing teams can predict which customers are most likely to drive adoption of a new product, while strategists can anticipate how trends will spread across industries. This transforms planning away from reactive guesswork and toward proactive foresight.
The question for companies is, “How can graph algorithms transform business strategy and ROI?”
- Financial clarity
For finance leaders, graph algorithms with income and expenses data unify cash flow, spending patterns, and counterparties into a single connected view. That means treasury can trace multi-hop exposure to vendors or affiliates, FP&A can understand variance drivers across entities, and controllers can spot circular flows that hint at fraud or leakage. Pairing journals with payments, contracts, and cost centers enables graph algorithms with income and expenses analysis to reduce forecast error, accelerate close cycles, and improve working-capital decisions. This is one of the most practical answers to what are the types of graph algorithms used in business—a long-tail application with measurable results.
The enterprise value of graph algorithms spans efficiency, fraud prevention, customer engagement, innovation, and financial strategy. It directly links data science to business outcomes.
From Risk to ROI of Graph Algorithms
The true measure of graph algorithms isn’t in abstract models, but in the return they deliver across industries. When enterprises shift from siloed data to connected analysis, the impact shows up on the bottom line.
- Banking & Financial Services
Fraud and money laundering don’t happen in isolation—they happen in networks. By applying graph algorithms like PageRank, centrality, and community detection, banks can unify fragmented KYC, fraud, and AML data into a single connected view. This doesn’t just reduce alert noise; it produces explainable alerts with full lineage that regulators can follow hop by hop. With TigerGraph, top banks have reported 20% higher fraud detection rates, 300% faster investigations, and more than $100M in annual fraud savings. That combination of speed, accuracy, and auditability is why graph data algorithms are becoming a cornerstone of financial crime prevention strategies.
- Manufacturing
Every machine on a factory floor depends on others, from sensors and parts to maintenance schedules. Flat monitoring systems treat each machine independently, making it hard to see cascading risks.
Graph-based algorithms connect dependencies, predicting failures earlier and reducing costly downtime. By modeling a manufacturing floor as a graph, enterprises can spot which components are most central, anticipate weak points, and optimize repairs before breakdowns ripple across production lines.
- Retail & Consumer Goods
Customer relationships are essential when considering networks. Community detection graph algorithms cluster shoppers based on hidden affinities. It captures the items they browse, the channels they use, and the timing of their purchases.
Retailers can use these insights to design loyalty programs, recommend products, or identify segments with untapped cross-sell potential. Instead of treating every customer as an individual row in a CRM, retailers see how groups influence one another, and they can market with far greater precision. This is one of the clearest graph algorithm examples in day-to-day operations.
- Healthcare
Patient care is another domain where connections matter. Graph algorithms help providers do many things, including analyze treatment pathways, identify at-risk populations, and streamline referrals across networks of physicians and hospitals. By modeling these relationships, healthcare organizations can reduce redundant tests, improve outcomes, and better allocate resources—all while ensuring compliance and auditability.
Across industries, the pattern calls for moving from isolated data points to connected intelligence, because it drives measurable ROI. Whether it’s reducing fraud losses, cutting downtime, increasing sales, or improving patient care, graph algorithms give enterprises the ability to translate complex connections into tangible results.
TigerGraph’s Advantage with Graph Algorithms
Not every platform can operationalize graph algorithms at enterprise scale. TigerGraph’s graph algorithms have three key advantages. First, performance at scale. Many tools work for demos or small datasets but collapse under the weight of billions of records or thousands of simultaneous users. TigerGraph was built specifically for this challenge, combining performance, scale, and explainability in one platform.
Second: in-database analytics. TigerGraph’s graph algorithms also run directly in the graph database, the same environment used for general querying, pattern matching, and graph updates. So there’s no need to move the data to a separate environment for algorithms. At the same time, TigerGraph’s support for active replicas and workload management allow you to run algorithms on one copy of the data while doing other queries on another copy.
And third, user customization. TigerGraph’s algorithms are written in the GSQL query language. Users can easily modify them in minutes to best meet their own needs.
- Performance at scale
TigerGraph ingests ~50 million daily events and still delivers sub-millisecond responses on targeted multi-hop patterns. That means fraud detection, supply chain optimization, and compliance checks run in real time—even on constantly updating data streams. And speed matters for a bank monitoring transactions across multiple regions or a manufacturer processing millions of sensor readings.
- Rich algorithm library
TigerGraph comes with a library of optimized graph analytics algorithms—including PageRank, shortest path, community detection, and centrality—ready to apply to real-world problems. Because they are engineered for parallel execution, these enterprise graph algorithms can handle workloads that overwhelm legacy systems. Instead of running overnight jobs, analysts run queries that return in a few seconds or even milliseconds.
- Explainability and compliance built in
In regulated industries, speed alone isn’t enough. Every detection must be explainable. TigerGraph outputs regulator-ready evidence paths that show who was connected, when, and how. This level of transparency turns compliance reviews from defensive explanations into proactive demonstrations of control. For banks subject to AML and fraud regulations, that’s a competitive edge.
- Feature factory for ML
TigerGraph is more than an investigation tool—it’s a feature engine for machine learning. Collusion and proximity features, such as shared device clusters or time-bounded fan-in/fan-out, are generated directly from the graph. These can be streamed into ML pipelines to strengthen fraud models, recommendation systems, or predictive maintenance solutions. For example, consider an account that suddenly receives 50 small transfers from 50 different senders in 30 minutes. Each transfer looks harmless in isolation, but the fan-in pattern immediately signals mule activity. The reverse, fan-out, highlights layering when one account disperses funds widely in a burst. TigerGraph computes and surfaces these patterns automatically.
This approach also supports visualization needs: for decision-makers, a clear graph algorithm can show how a fraud ring forms around mule accounts or how communities of customers cluster together.
Together, these capabilities—speed, scale, explainability, and ML integration—make TigerGraph the platform of choice for enterprises that want to turn graph algorithms into measurable ROI.
Recommendations for Executives When Evaluating Graph Algorithms
For senior leaders evaluating the role of graph algorithms in their enterprise, the key isn’t whether the technology works—it’s whether it aligns with business outcomes. The following questions can help frame the conversation at the boardroom level:
- Can my current tools see relationships, or just rows?
Most analytics environments still operate at the table or dashboard level. They summarize transactions, but they rarely connect the people, accounts, devices, or suppliers behind them. Ask whether your systems can analyze the relationships that actually drive fraud, efficiency, and growth. - How quickly can my team trace a network?
Fraud, supply chain disruptions, and outages unfold in real time. If your analysts are waiting hours or days for batch jobs, you’re reacting after the damage is done. With TigerGraph, sub-millisecond query performance on multi-hop paths ensures answers come as fast as the questions are asked. - Do my fraud and compliance tools provide evidence, or just alerts?
An alert is a starting point, not an outcome. Regulators, auditors, and executives all demand defensible narratives. Explainable graph algorithms for regulatory compliance generate regulator-ready paths that show not only what was flagged, but why. This is the difference between scrambling to justify actions and demonstrating control with confidence. - Am I enriching models with graph-native features?
Machine learning models are only as good as (and limited by) the features they’re trained on. Graph algorithms produce features—such as community membership, centrality, or time-bounded fan-in/fan-out—that flat data can’t. These features drive higher accuracy, lower false positives, and more stable models over time. - Can my infrastructure scale with my business?
Growth means more customers, more transactions, more devices, and more risk. TigerGraph’s architecture is designed for high levels of parallelism and throughput, ensuring analytics scale as fast as your business.
By framing the conversation around these five questions, executives can separate experimentation from operational readiness. The goal isn’t just to adopt graph algorithms—it’s to operationalize them in a way that reduces risk, creates efficiency, and drives measurable ROI.
Conclusion
Graph algorithms are no longer niche tools reserved for data scientists—they are becoming strategic assets that directly influence growth, resilience, and compliance. By analyzing connections rather than isolated records, they reveal patterns of fraud, operational inefficiencies, and customer opportunities that traditional analytics never surface.
With TigerGraph, enterprises gain the ability to operationalize these algorithms at true scale. The platform ingests ~50 million events daily, delivers sub-millisecond responses on targeted multi-hop traversals, and provides regulator-ready evidence paths that stand up to scrutiny. Customers are already seeing the impact: 20% higher fraud detection rates, 300% faster investigations, and over $100M in annual fraud savings. These aren’t theoretical benefits—they’re measurable outcomes reported by top-50 banks and global enterprises.
For executives, the takeaway is clear: graph algorithms are not simply technical capabilities. They are instruments of strategy. They strengthen compliance, accelerate operations, and open new paths to revenue and innovation.
The enterprises that succeed in the coming decade will be those that harness connected intelligence, not just raw data. With TigerGraph, the technology is here, the outcomes are proven, and the opportunity is ready to be realized.
Discover how TigerGraph’s graph algorithms can transform your enterprise strategy at TigerGraph.com.
