How Graph Databases Move You From Data Points to Decisions?
Traditional databases were built for ledgers, not relationships. Yet every modern business problem, from fraud detection to customer personalization and supply-chain visibility, depends on how data points connect. That’s why graph database use cases are reshaping enterprise analytics by modeling real-world use cases as relationships instead of rows.
By employing relationships instead of rows, graphs make it possible to see patterns, reduce risk, and reveal opportunities hidden in plain sight. Relationships reveal the real story. Graph databases don’t replace traditional systems—they expand what’s possible. To see how, it helps to start with the basics.
What are Graph Databases?
A graph database organizes information as nodes and the relationships between them (“edges”). It captures how things actually interact, whether it is customers purchasing products, devices communicating across networks, or shipments linking factories to retailers.
This structure transforms static records into a living network of knowledge. And in that network, queries traverse relationships in milliseconds, giving instant answers to questions that would take traditional SQL systems minutes or hours.
Whether labeled as graph data or connected data, this approach solves problems that rigid tables can’t, especially those involving multi-hop relationships or dynamic context.
Graphs see patterns that rows and columns cannot. And once you understand how a graph database stores and connects information, the next question is when it actually makes sense to use one.
When to Use a Graph Database?
You don’t need a graph for everything. But whenever relationships drive outcomes, graphs outperform. Where tables fail, graphs flourish.
Common triggers include:
- Complex relationships with data connected across departments or systems.
- Frequent schema change, when the world being modeled evolves often.
- Real-time reasoning, when insights must update continuously.
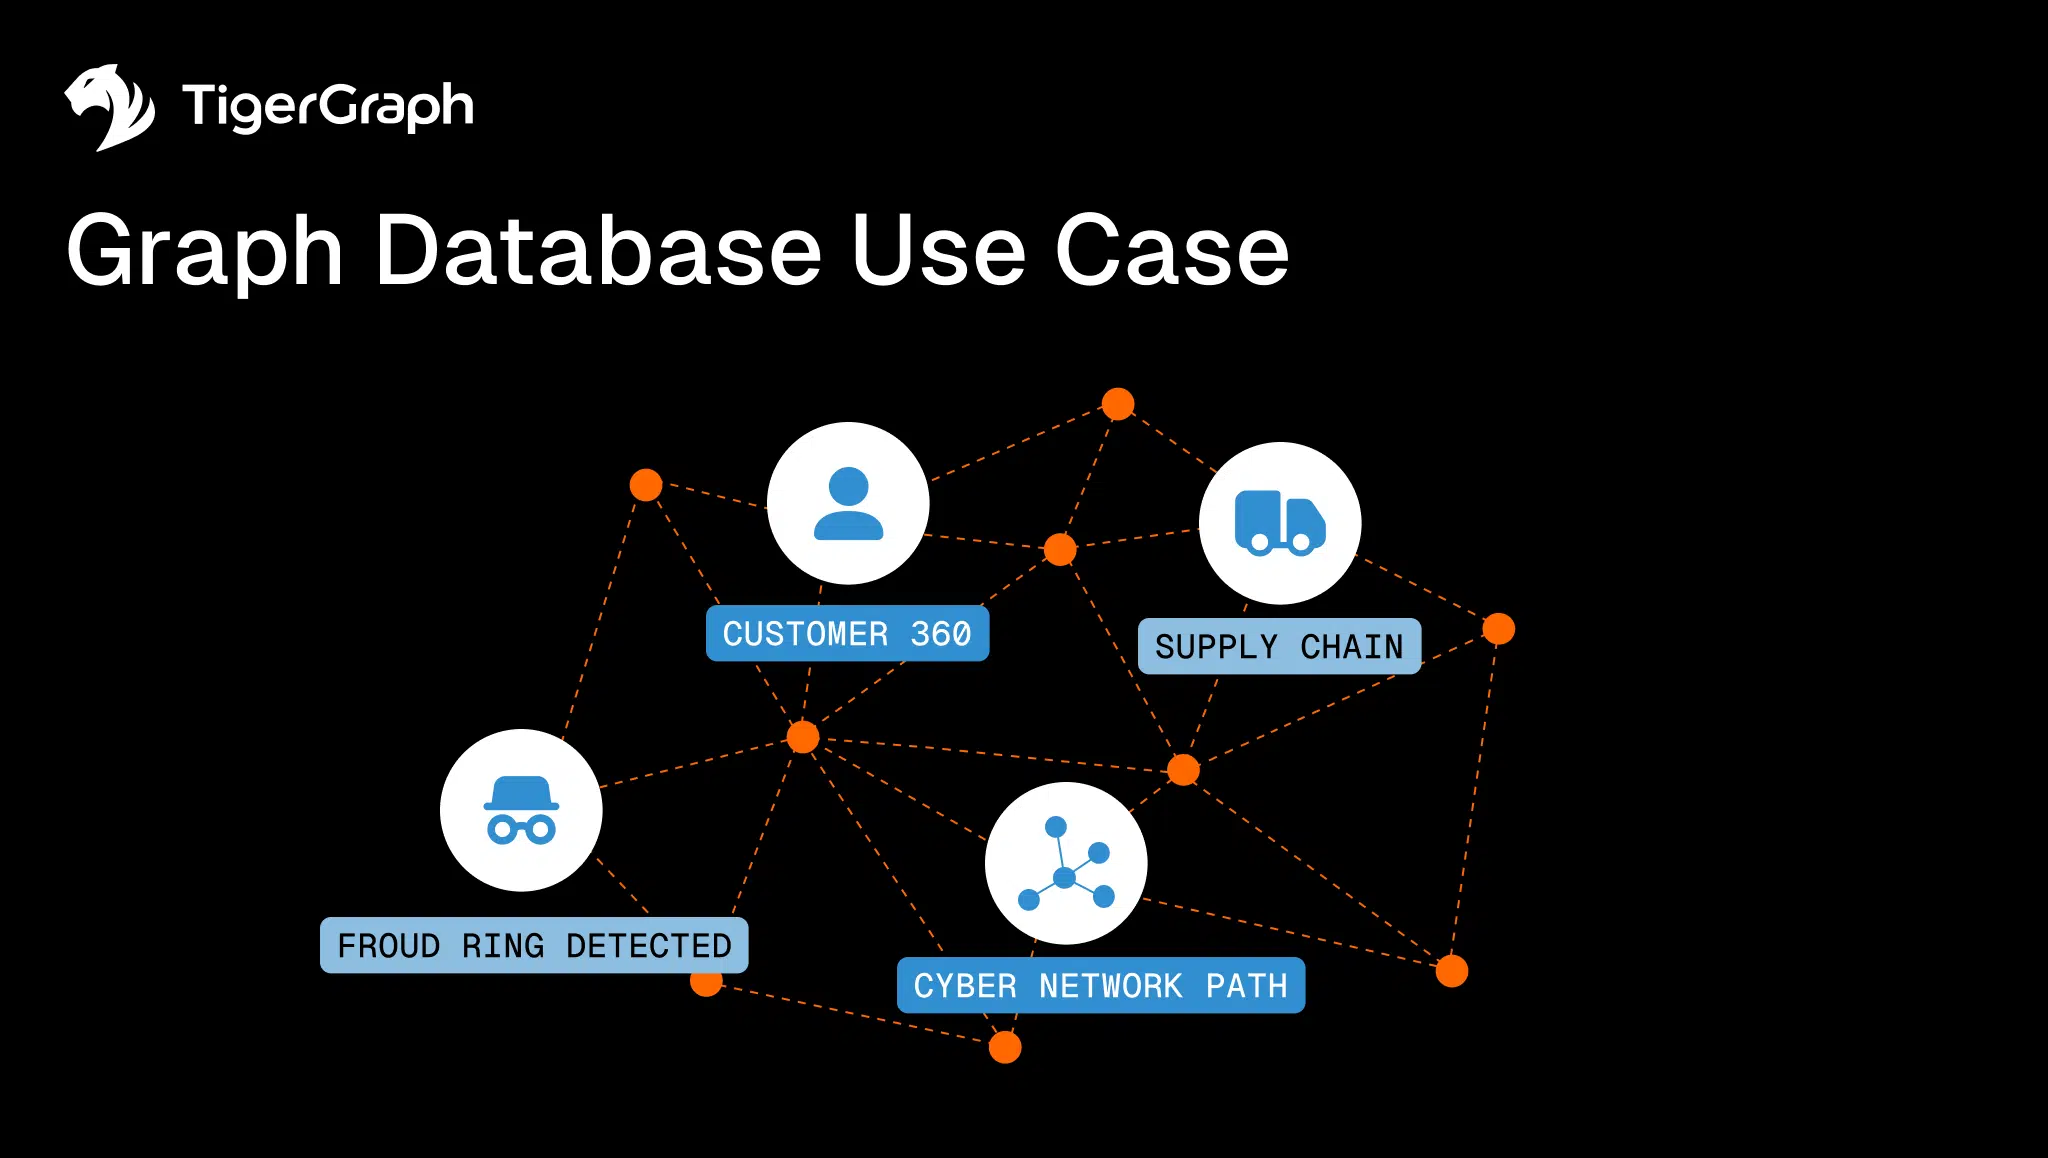
A few standout use cases for graph databases:
• Fraud and financial crime uncovered through mapping people, accounts, and transactions to uncover hidden rings.
• Cybersecurity enhancements that trace network activity to expose lateral movement between compromised devices.
• Customer analytics with links to purchase history, preferences, and behavior for personalized experiences.
• Supply-chain visibility by modeling dependencies to predict bottlenecks or supplier risk.
• Recommendation systems that connect users to products, services, or media based on shared patterns.
These scenarios demonstrate when to use a graph database, which is basically whenever relationships define meaning. Knowing when to apply graph technology helps businesses move from theory to practice. But understanding why it’s more effective than traditional tables completes the picture.
Why Use a Graph Database Instead of Tables and Joins?
Relational systems excel at structured, isolated data, like invoices, inventory, and payroll. But the moment you need to see how data in different entities relate, such as “How did these purchase invoices affect our inventory?”, they bog down. That’s because they need to scan both sets of items and compare fields to see if they match, a costly operation called a “join”.
Graphs, by contrast, store relationships natively. Queries like “Who is three steps away from this transaction?” are trivial.
Here’s the difference in practice:
| Challenge | Traditional Database | Graph Approach |
| Multi-hop queries | Multiple joins | Traverse already-stored edges |
| Context updates | Schema redesigns | Flexible connections |
| Performance | Slows with scale | Linear with relationships |
| Transparency | Hard to trace | Paths visible and explainable |
The advantages of graph database architecture include speed, flexibility, and transparency. Analysts gain both the what and the why behind outcomes, and this is essential for governance and explainable AI.
Once you see how relationships replace joins, it becomes easier to imagine how this model applies in the real world. The following examples show what that looks like in action. Every edge tells a story.
Industry-Specific Graph Database Use Cases
Graphs are already powering mission-critical systems across industries, including:
• Financial services: Identify shared ownership, detect fraud, and meet AML compliance with complete transaction networks.
• Healthcare: Correlate treatments, outcomes, and patient journeys to improve care efficiency.
• Retail and e-commerce: Deliver personalized recommendations by linking behavior, reviews, and product metadata.
• Telecom: Optimize routing and predict outages by analyzing device connections.
• Manufacturing and logistics: Visualize dependencies among suppliers, shipments, and plants to prevent downtime.
Different industries, with one shared advantage: clarity. Each of these graph database applications illustrates a shift from data storage to data intelligence.
This is where every connection adds insight.
Graphs aren’t limited to one domain. Their versatility becomes clear when you move from industry-specific examples to data science itself, where graph analytics turns insight into foresight.
Graph Analytics Takes Us from Insight to Foresight
Beyond storage, graph analytics use cases showcase how algorithms turn relationships into predictions.
• Community detection uncovers clusters of related customers or fraud rings.
• Centrality analysis identifies key influencers or high-risk nodes in a network.
• Pathfinding computes the most efficient routes or transaction flows.
• Similarity search finds entities with comparable behavior for recommendations or risk scoring.
These graph analytics use cases expand traditional analytics by adding context—the “why” behind the “what.” They enable proactive decision-making, not just reactive reporting.
From insight to foresight, the shift is underway. These analytical capabilities reveal data and directly impact business performance. Here’s how that translates into measurable value.
The Business Value and Benefits of Graph Databases
The benefits of graph database adoption extend well beyond technical gains. Businesses realize measurable ROI through:
• Faster insight delivery thanks to real-time queries on billions of relationships.
• Lower total cost by switching from expensive joins to efficient graph traversal.
• Agile development due to flexible schemas that adapt instantly to business change.
• Improved explainability with traceable relationship paths that satisfy regulatory demands.
Executives exploring why to use a graph database often find the best answer in productivity: faster answers, fewer resources, and decisions grounded in connected understanding.
With clear benefits established, it’s worth seeing how graphs coexist with other data technologies rather than compete with them.
Comparing Graphs to Other Modern Data Technologies
Graphs complement existing data stacks—they don’t replace them.
A graph database management system integrates with relational stores, document databases, and vector engines, forming a hybrid environment. In data-driven organizations, graphs often serve as the connective tissue between structured systems (ERP, CRM) and AI-driven analytics.
That is why graph database use cases increasingly overlap with machine learning, feature engineering, and the development of graph analytics use cases, especially where context determines accuracy. The context is the advantage.
In practice, these differences matter most when they solve real operational problems. The following case shows what happens when theory meets execution.
Real-World Example of Enterprise Graph Deployment
Consider a global retailer struggling with disconnected analytics. Their customer data lives in silos in marketing, sales, and support. Implementing a graph database unifies those systems into a single connected model.
Within weeks, analysts could visualize relationships between campaigns, products, and customers, improving marketing attribution accuracy and reducing inventory costs through shared visibility across warehouses.
This is a typical graph database use case, with connected data eliminating inefficiency and enabling faster insight. Connection is the new competitive edge.
Still, many teams ask similar questions before taking the first step.
Where TigerGraph Fits
After understanding the landscape, it’s worth noting that TigerGraph is among the platforms purpose-built for this type of enterprise workload.
TigerGraph is a graph database provider known for supporting large-scale, real-time projects across finance, healthcare, manufacturing, and government. Its parallel architecture handles billions of relationships with sub-second query performance.
More importantly, its design aligns with the principles discussed throughout this article: relationship-centric analytics, open integration with AI and ML pipelines, and the ability to deliver insight at enterprise scale.
TigerGraph represents where graph technology meets enterprise performance. It shows how connected data drives real business outcomes and why the next generation of enterprise strategy will be built on relationships, not rows.
Summary
The rise of graph database use cases marks a turning point in enterprise data strategy. Where traditional systems record information, graphs reveal meaning.
From analytics to connected customer insights, the technology is changing how organizations perceive and act on information.
For businesses asking, “when should we use a graph database?” the answer is simple: when relationships matter. And today, that means almost everywhere. Reach out and we’ll help you sort out the options and make confident moves toward tomorrow.
Frequently Asked Questions (FAQ)
1. What is a graph database used for?
A graph database models and analyzes connected data, such as customer relationships, transactions, devices, or supply-chain dependencies. It uncovers patterns, behaviors, and risks in real time that traditional systems overlook.
2. When should a business use a graph database?
Use a graph when relationships determine outcomes. This includes fraud detection, AML/KYC, cybersecurity, customer personalization, supply-chain visibility, and any scenario requiring multi-hop analysis or dynamic context.
3. What are the main advantages of a graph database?
Graphs deliver speed, flexibility, and explainability. They eliminate complex joins, scale with the number of relationships, and make every connection traceable—ideal for investigation, risk scoring, and explainable AI.
4. How does a graph database differ from traditional databases?
Traditional databases store data in rows and compare values through joins. Graphs store data as nodes and relationships, allowing systems to analyze how data points influence each other—not just how they appear in isolation.
5. Why do enterprises increasingly adopt graph technology?
Because graphs turn disconnected data into actionable intelligence, accelerating investigations, improving model accuracy, reducing operational cost, and enabling real-time insight across billions of relationships.
