How Knowledge Graphs Reveal Meaning Hidden in Enterprise Data
Traditional analytics systems focus on isolated data points, but context gives information meaning. From customer insight to fraud detection, every decision depends on understanding relationships across systems. That’s why knowledge graph use cases are transforming enterprise data strategy. They connect people, processes, and events to reveal insights hidden in plain sight.
Knowledge graphs unify scattered data into structured intelligence. They allow teams to find answers and also the reasoning behind the answers. In fast-moving industries, that difference determines whether a company reacts or anticipates.
What Is a Knowledge Graph?
A knowledge graph represents data as entities and relationships, creating a network of connected meaning. Each node corresponds to a concept, such as a product, customer, or event—while edges describe how those entities relate.
This connected structure mirrors how humans think about information. It links data from across sources, forming a shared framework that both people and machines can query intuitively.
A knowledge graph example might map how customers engage with products, marketing, and support systems to create a unified view of interactions that were once siloed. In practice, this makes it possible to ask business-ready questions like, “Which customers are most likely to respond to an upsell campaign?” or “Which suppliers connect to our highest-risk regions?”—and get immediate, explainable answers.
Knowledge graphs organize data the way the world actually works—through connections.
Why Knowledge Graphs Matter for Modern Enterprises
Organizations rely on knowledge to operate efficiently, yet traditional databases treat facts as separate pieces. A knowledge graph bridges those gaps, connecting data into a coherent whole.
This integration produces measurable benefits—faster analytics, higher data quality, and shared understanding across business units. It shortens time-to-insight for data scientists and builds confidence for decision-makers. Each can see that recommendations are rooted in verified context.
That’s why knowledge graph applications are gaining traction in financial services, healthcare, telecom, retail, and government. Wherever complexity and change intersect, graphs reveal what matters most.
When relationships drive value, graphs deliver insight that scales.
Knowledge Graph Use Cases Across Industries
The versatility of knowledge graphs allows them to serve almost any data-rich domain. Below are the most impactful enterprise knowledge graph use cases, spanning both business and AI contexts.
Finance and Financial Crime Detection
In financial services, connected data saves time, cuts losses, and ensures compliance. A knowledge graph connects accounts, transactions, and identities to expose hidden relationships that flat databases miss. Fraud detection models use these links to identify suspicious clusters and uncover multi-hop money flows.
Banks use knowledge graphs to trace beneficial ownership, strengthen AML and KYC processes, and visualize how entities interact over time. The result: fewer false positives, faster investigations, and improved auditability for regulators.
Customer Experience and Personalization
Customer data lives across marketing systems, CRMs, and e-commerce platforms. A customer knowledge graph unifies these silos—connecting preferences, interactions, and purchase history into one dynamic profile.
This enables hyper-personalized recommendations, more relevant product suggestions, and real-time segmentation. Retailers and service providers can track evolving customer behavior while preserving explainability and compliance.
Healthcare and Life Sciences
Knowledge graphs link clinical records, genomics, and outcomes in healthcare. Hospitals use them to correlate treatments and conditions, improving care quality and supporting precision medicine.
Pharma and research organizations rely on knowledge graph examples for drug discovery—mapping compounds, side effects, and protein interactions. This approach accelerates research, reduces redundancy, and enables explainable AI for clinical validation.
Supply Chain and Manufacturing
Modern supply chains demand visibility across global ecosystems. A supply chain knowledge graph connects suppliers, logistics routes, materials, and risk indicators in real time.
Manufacturers identify bottlenecks, predict disruptions, and assess supplier reliability by modeling dependencies. Equipment and maintenance graphs power predictive maintenance, reduce downtime and optimize production.
Retail and Commerce
Retailers use knowledge graph applications to merge product catalogs, customer data, reviews, and supply-chain metrics. With connected data, they can dynamically adjust pricing, predict inventory needs, and enhance cross-sell performance.
When an e-commerce platform integrates graph analytics, every product and customer interaction adds intelligence—driving conversions while reducing returns and waste.
Telecom and Network Operations
Telecommunications networks contain billions of interconnected devices. A telecom knowledge graph maps relationships between users, routers, and infrastructure. It makes real-time monitoring and predictive insights possible.
With these connections visible, operators can detect failures before customers notice, optimize routing, and proactively balance network loads. This directly translates into higher uptime and improved customer satisfaction.
Cybersecurity and Threat Intelligence
In cybersecurity, knowledge graphs model access patterns, credentials, and data flows across an enterprise. Security teams can see relationships between compromised accounts, shared devices, or privileged users, identifying lateral movement before breaches occur.
Context-rich detection replaces siloed alerts with a holistic view of threat networks. This is essential for zero-trust environments.
Public Sector and Government
Government agencies and NGOs use enterprise knowledge graphs to connect policy data, public records, and citizen services. By breaking down departmental silos, knowledge graphs reveal how policies interact, improve response coordination, and ensure transparent decision-making.
Knowledge graphs turn bureaucracy into connected intelligence.
Knowledge Graphs for AI and RAG Workflows
Knowledge graphs are also essential for retrieval-augmented generation (RAG) and GraphRAG systems that feed large language models (LLMs). They act as a source of truth, providing verified, structured data to ground AI reasoning.
In enterprise AI, this means fewer hallucinations, faster responses, and explainable outcomes. For agentic AI systems, knowledge graphs act as dynamic memory. They allow models to reason, adapt, and learn continuously.
And when relationships become visible, decisions become smarter.
How Knowledge Graphs Improve Business Performance
The business value of a knowledge graph stems from its ability to clarify relationships at scale. Compared with conventional systems, the difference is dramatic.
| Challenge | Traditional Data Systems | Knowledge Graph Approach |
|---|---|---|
| Data Integration | Manual joins and rigid ETL pipelines | Seamless connections among entities |
| Adaptability | Frequent schema redesigns | Flexible models that evolve with new data |
| Query Speed | Degrades as relationships multiply | Maintains near-linear performance |
| Transparency | Hidden logic in code or joins | Directly traceable relationships |
This transparency enables analysts to explain results, auditors to verify logic, and executives to act with confidence. By translating complexity into clarity, a knowledge graph becomes both a technical and strategic asset.
Knowledge Graphs and Artificial Intelligence
In advanced analytics and machine learning, context determines accuracy. Knowledge graphs enrich AI models with structured relationships, grounding predictions in verified context rather than coincidence.
When paired with LLMs or agentic AI, knowledge graphs are a memory layer that evolves with new data. They help systems reason, verify, and explain—capabilities critical for enterprise-grade intelligence.
Teams deploying knowledge graph RAG use cases report higher model reliability, fewer hallucinations, and faster retrieval speeds. In essence, graphs give AI something it has always lacked: situational awareness.
Business Benefits of Knowledge Graph Adoption
Once organizations implement knowledge graphs, they see measurable improvements across the enterprise, including:
- Faster decisions powered by real-time graph queries.
- Lower operational costs through simplified data pipelines.
- Higher accuracy from context-driven analytics.
- Enhanced governance and traceability.
- Improved agility as data and business models evolve.
- Stronger collaboration between teams through shared visual understanding.
A knowledge graph turns data management from reactive maintenance to proactive intelligence.
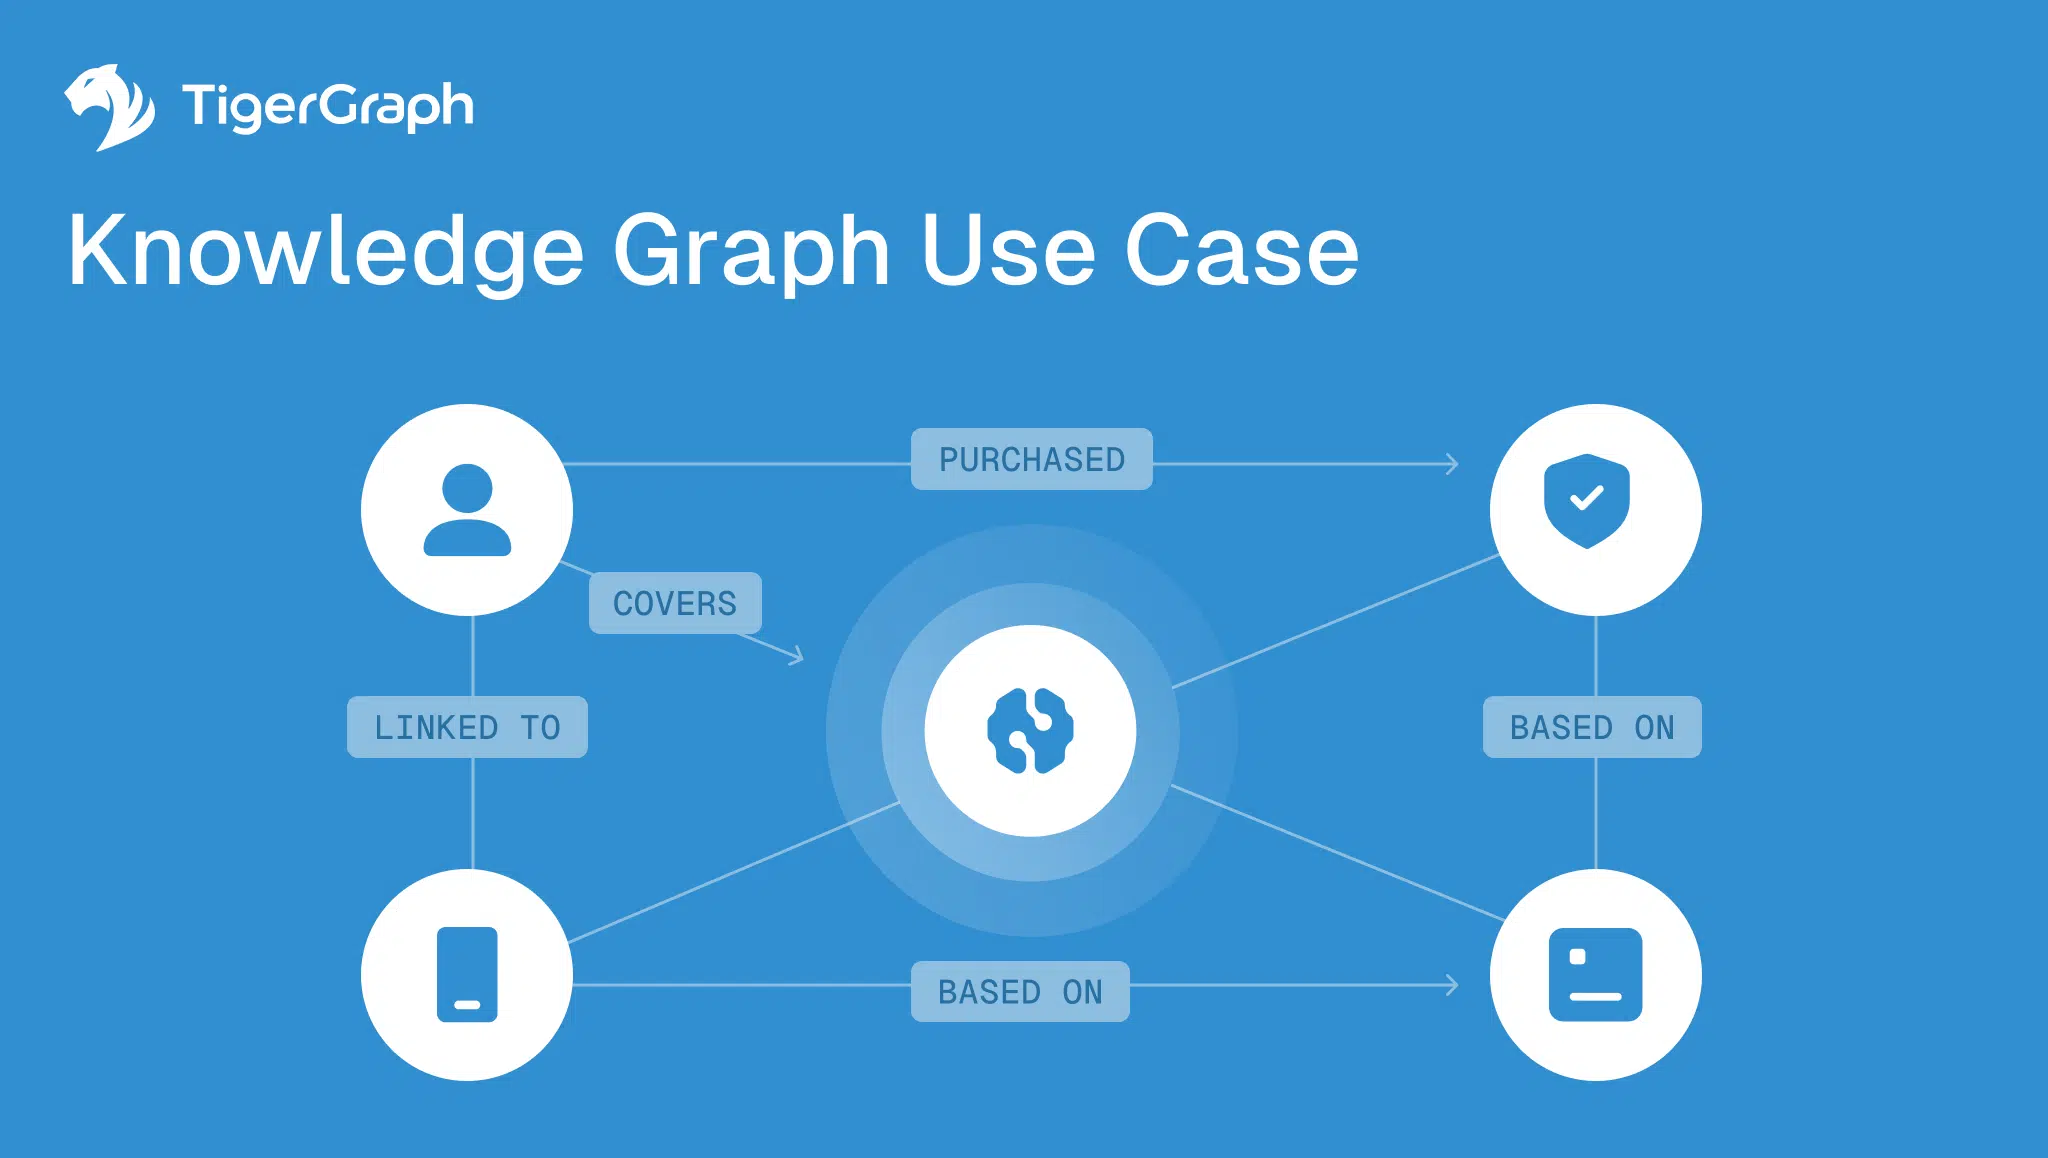
Enterprise Case Study: Connected Data in Action
For example, consider a global insurer seeking to consolidate data across policy, claims, and underwriting divisions. Implementing a knowledge graph could produce a unified model linking people, locations, coverages, and events.
Analysts would be able to visualize dependencies in real time, simulate “what-if” risk scenarios, and pinpoint potential losses before they occur. Report turnaround could drop from days to minutes, while compliance audits become easier to manage.
This connected approach illustrates how knowledge graphs improve efficiency and can even change how an organization thinks about risk itself.
Where TigerGraph Fits in Delivering a Scalable foundation for Knowledge Graphs
TigerGraph provides a high-performance, scalable foundation for knowledge graph applications in complex, data-intensive industries. Its native parallel architecture supports billions of relationships with sub-second query response, making it ideal for real-time analytics and reasoning.
As a graph database provider, TigerGraph powers enterprise knowledge graphs for finance, healthcare, manufacturing, and telecom—helping teams uncover relationships, strengthen AI pipelines, and act with data-driven confidence.
Summary
Knowledge graphs redefine how enterprises understand their world. They connect facts, context, and logic into a single, navigable network, accelerating insight while ensuring transparency.
From knowledge graph examples in healthcare to enterprise use cases in finance, organizations are discovering that the best decisions come from connected understanding.
Ready to move beyond disconnected data? The path forward is clear. Reach out to explore how TigerGraph can help you build the connected intelligence foundation that tomorrow’s enterprises demand.
