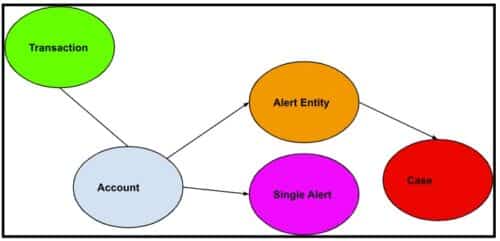
Figure 1: AML generic workflow.
Financial accounts are linked to many transactions. Alert entities are suspicious accounts that are presented to fraud analysts, who can further put alert entities into a case study container.
Introduction
In the world of finance, preventing money laundering is of paramount importance. This blog aims to provide insights into how financial institutions implement Anti-Money Laundering (AML) practices using graph databases. By examining the relationship between commercial accounts, consumer accounts, and their associated financial transactions, we can better understand the steps involved in combating money laundering.
We also observe that although AML software is subject to compliance regulations, its impact on the financial institutions’ overall revenue may not be direct. However, it is worth mentioning that the same techniques and frameworks employed in AML software can be effectively utilized to identify instances of fraud and minimize the number of false positives encountered by fraud analysts. This, in turn, alleviates the workload on analysts and leads to significant operational cost savings for financial institutions.
Accounts and Transactions
Financial institutions serve both commercial and consumer customers, each having their respective accounts (blue node). These accounts are linked to numerous financial transactions (green node), including deposits, withdrawals, money transfers, and more. By analyzing these transactions, institutions can identify suspicious activities indicative of money laundering.
Steps to Combat Money Laundering
1.Run an entity resolution algorithm on all accounts based on common address, common phone, common ssn etc. to detect identical or similar accounts and merge them into one entity.
Note: This step is easy in TigerGraph GSQL, but not easy by relational database or Neo4j Cypher. This is a graph clustering algorithm problem, GSQL’s accumulator makes it easy.
2. After grouping all accounts, the transactions of each account group will be used to generate single alerts (pink node). Each alert means some rules are violated. Common rules are:
- Does the account have a transaction that has been marked as fraudulent?
- Does the account reside in a group whose group size is 100 or above? Looks like a non-human natural setup!
- Does the account have international wire transfer (inbound or outbound) passing a threshold? Red flag!
Note: This is a 1-hop aggregate query, it check each account’s transactions, and insert into the graph a “single alert” node, and connect the newly created node with the account node. GSQL supports insertion of nodes and edges.
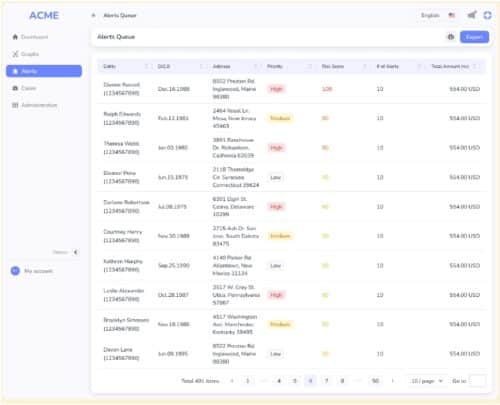
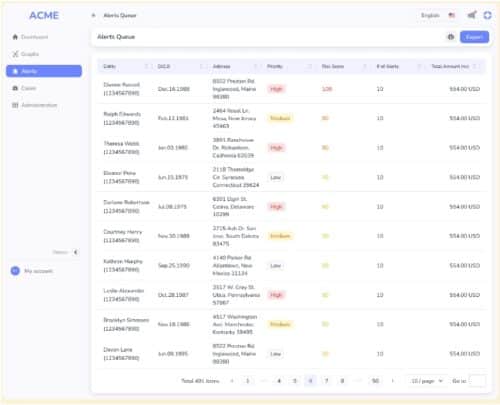
3. Based on the generated alerts, risk scores are calculated for each account group. These risk scores provide an overall indication of the associated risk level. If an account group’s risk score exceeds a predefined threshold, an “Alert Entity” node is created. Such entities are subjected to thorough scrutiny by alert analysts. Alert analysts can further create a “case” node to group a set of related alert entities.
Note: This is a 1-hop aggregate query, it check and aggregate each account’s single alerts, and insert into the graph “Alert entity” node, and connect the newly created node with the account node. GSQL supports insertion of node and edges.


4. Case analysts can further examine the case for further fraud study.
Why Graph Database
Entity resolution is easier. Fraudulent users have finite physical resources– IP, device, residential address, SSN etc. By grouping accounts based on those finite resources, we can find suspicious account groups that are artificially manipulated by fraudsters. Graph database can naturally run a weakly connected component algorithm or other unsupervised cluster algorithms to find such account groups, which is hard in relational database.
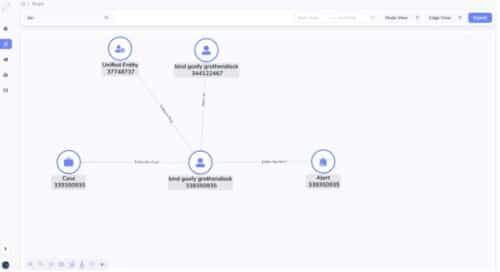
Avoid ad hoc joins. Graph storage format is just a better way to manage data. Why? Essentially, unlike relational databases which do runtime join to connect table rows at a per query basis, graph database obviate the runtime join for all queries. Instead, graph database materialize all joins at loading time. When you finish the initial data ingestion, or you do incremental data ingestion, each insertion materialize a relationship. At runtime, you just traverse the edge (relationship) for a source to a target, you never need to do a join for two vertices that you know they have a relationship. For example, in step 2 above, if you use a graph database, you just aggregate all transactions following the edges from the transactions to their linked accounts. But in relational databases, you need to join the transaction table with the account table to achieve this. In step 3 and 4 above, when alert entity or case are presented to the fraud analysts, they will double click the alert entity or the case, which brings them to a graph (network) exploration panel, the alert entity’s 1-hop neighborhood will be unfold on the screen (no join for graph database here, but will trigger a runtime join for relational database query engine), and the analysts can continue her ad hoc double click to investigate the traces of the alert entity, 3-hop, 4-hop etc., all have not join cost for graph database, but a join cost for relational database. In other words, graph database storage is just smarter, in that it can avoid repetitive runtime joins by materializing joins as edges. It is just greener for the planet.

Why TigerGraph
Scalability: transactions are large, can be 500G to 10T. TigerGaph has been proven to be capable to handle 100T challenging multi-hop queries.
Performance: MPP architecture can do this AML flow parallelly for all accounts. It’s a data mining problem involves both unsupervised clustering and semi-supervised rule filters. You need to examine each account and its transactions.
Advanced Aggregation support from Query Language: GSQL query language’s accumulator ingredient makes this ad-hoc vertex-centric aggregation easy. I don’t see how other query languages can do this. The closest one may be SQL stored procedure, but it’s not as good as an accumulator since graph query is vertex oriented, we need to leave side-effects (runtime attributes) on vertices for later iteration examination.
Mutability: TigerGraph allows queries to insert nodes and edges. This makes alert and case generation possible.
Contact
If you need to see an AML demo, please contact us here info@localhost.


