Skip to content
START FOR FREE
START FOR FREE
  • SUPPORT
  • COMMUNITY
Menu
  • SUPPORT
  • COMMUNITY
MENUMENU
  • Products
    • The World’s Fastest and Most Scalable Graph Platform

      LEARN MORE

      Watch a TigerGraph Demo

      TIGERGRAPH CLOUD

      • Overview
      • TigerGraph Cloud Suite
      • FAQ
      • Pricing

      USER TOOLS

      • GraphStudio
      • Insights
      • Application Workbenches
      • Connectors and Drivers
      • Starter Kits
      • openCypher Support

      TIGERGRAPH DB

      • Overview
      • GSQL Query Language
      • Compare Editions

      GRAPH DATA SCIENCE

      • Graph Data Science Library
      • Machine Learning Workbench
  • Solutions
    • The World’s Fastest and Most Scalable Graph Platform

      LEARN MORE

      Watch a TigerGraph Demo

      Solutions

      • Solutions Overview

      INCREASE REVENUE

      • Customer Journey/360
      • Product Marketing
      • Entity Resolution
      • Recommendation Engine

      MANAGE RISK

      • Fraud Detection
      • Anti-Money Laundering
      • Threat Detection
      • Risk Monitoring

      IMPROVE OPERATIONS

      • Supply Chain Analysis
      • Energy Management
      • Network Optimization

      By Industry

      • Advertising, Media & Entertainment
      • Financial Services
      • Healthcare & Life Sciences

      FOUNDATIONAL

      • AI & Machine Learning
      • Time Series Analysis
      • Geospatial Analysis
  • Customers
    • The World’s Fastest and Most Scalable Graph Platform

      LEARN MORE

      CUSTOMER SUCCESS STORIES

      • Ford
      • Intuit
      • JPMorgan Chase
      • READ MORE SUCCESS STORIES
      • Jaguar Land Rover
      • United Health Group
      • Xbox
  • Partners
    • The World’s Fastest and Most Scalable Graph Platform

      LEARN MORE

      PARTNER PROGRAM

      • Partner Benefits
      • TigerGraph Partners
      • Sign Up
      TigerGraph partners with organizations that offer complementary technology solutions and services.​
  • Resources
    • The World’s Fastest and Most Scalable Graph Platform

      LEARN MORE

      BLOG

      • TigerGraph Blog

      RESOURCES

      • Resource Library
      • Benchmarks
      • Demos
      • O'Reilly Graph + ML Book

      EVENTS & WEBINARS

      • Graph+AI Summit
      • Graph for All - Million Dollar Challenge
      • Events &Trade Shows
      • Webinars

      DEVELOPERS

      • Documentation
      • Ecosystem
      • Developers Hub
      • Community Forum

      SUPPORT

      • Contact Support
      • Production Guidelines

      EDUCATION

      • Training & Certifications
  • Company
    • Join the World’s Fastest and Most Scalable Graph Platform

      WE ARE HIRING

      COMPANY

      • Company Overview
      • Leadership
      • Legal Terms
      • Patents
      • Security and Compliance

      CAREERS

      • Join Us
      • Open Positions

      AWARDS

      • Awards and Recognition
      • Leader in Forrester Wave
      • Gartner Research

      PRESS RELEASE

      • Read All Press Releases
      TigerGraph Recognized in 2022 Gartner® Critical Capabilities for Cloud Database Management Systems for Analytical Use Cases
      January 12, 2023
      Read More »

      NEWS

      • Read All News

      A Shock to the System: ShockNet Predicts How Economic Shocks Could Affect the World Economy

      TigerGraph Recognized for the First Time in the 2022 Gartner® Magic Quadrant™ for Cloud Database Management Systems

  • START FREE
    • The World’s Fastest and Most Scalable Graph Platform

      GET STARTED

      • Request a Demo
      • CONTACT US
      • Try TigerGraph
      • START FREE
      • TRY AN ONLINE DEMO

MinHash Based Fuzzy Match on Graph

  • Xinyu Chang
  • September 6, 2022
  • blog, TigerGraph
  • Blog >
  • MinHash Based Fuzzy Match on Graph

Many graph use cases require fuzzy matching, a method used to find similar, but not exactly matching, phrases in a database. Some examples of fuzzy matching include inputting a string of characters, searching records with similar string attribute values, or finding a set of data records that have similar string values. Fuzzy matching is valuable in entity resolution, where data like first and last names needs to be identified and matched. In anti-fraud use cases, fuzzy matching can be used to match unstandardized addresses on credit card applications.

In a graph data structure, performing string fuzzy matches is challenging because:

  • With the graph data structure, it’s simple to perform an exact match with vertices created using the string values as their ID; however, it’s challenging to introduce a connection for a fuzzy match
  • Introducing additional components to the architecture using some indexing and search engines would solve the problem. This approach increases the system maintenance workload and the complexity of updating and querying the data.

By utilizing the MinHash approach during the graph loading process, vertices with similar string attribute values can be indirectly connected through common intermediary vertices whose IDs are the MinHash signature values. This approach has the following advantages:

  1. It doesn’t rely on additional architecture
  2. Performance is maintained by only scanning the relevant vertices without having to scan a large population of vertices
  3. Values are stored natively in the graph database in the form of vertices and edges, so the required data structure is automatically partitioned and distributed
  4. Search is done through graph traversal, which means we can adopt different algorithms to evaluate the string distance. 
  5. All searches are automatically parallelized.

What is MinHash?

MinHash is a technique for evaluating string similarities. MinHash can reduce each string into fixed dimensions, which is a set of MinHash signatures. By calculating the Jaccard Similarity of the MinHash signature sets of different strings, we can get the string similarity. 

It takes the following steps to calculate the MinHash Signatures:

  1. Calculate the k-shingle of a given size k of a string. The k-shingle of a string is all possible consecutive substrings of length k. For example, the k-shingle with k value equals 4 of string, “James Smith” is {“Jame”, “ames”, “mes ”, “es S”, “s Sm”, “ Smit”, “mith”}
  2. Hash each substring into j integer hash codes with j different hash functions. For example, if j equals 4:
    Minhash values
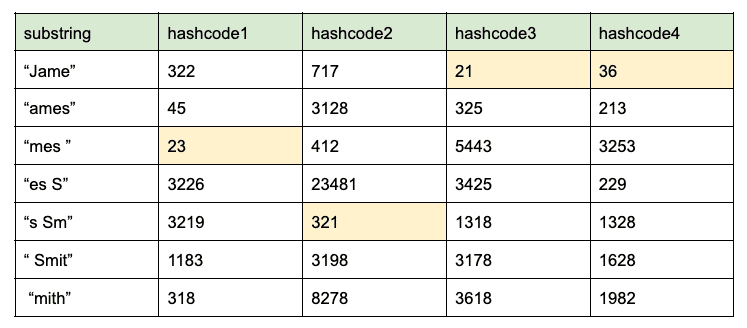
  3. The set minimum hashcode value for each hash code is 23, 321, 21, and 36. Therefore, the MinHash signature of string “James Smith” is {23, 321, 21, 36} 

How Does MinHash Work on Graph?

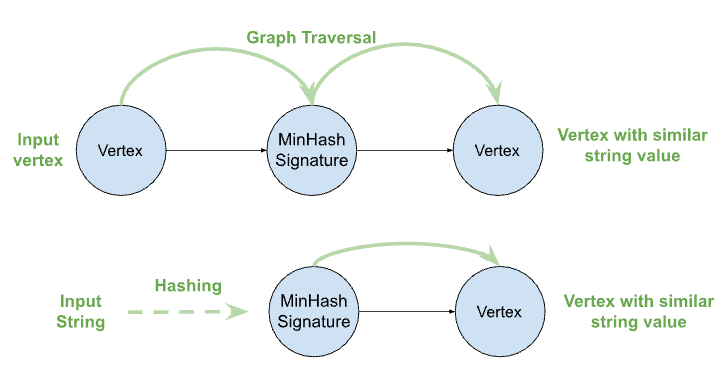
In the graph-based solution, for any given strings that will be used for the fuzzy match, we will first calculate the MinHash signatures, then create vertices using the Minhash signatures as the vertex ID. From there, we’ll connect the vertices that own the string values to those corresponding MinHash signature vertices.

This way, the MinHash signature vertices can be used to match the vertices having similar string values. For example, given a vertex, to find the vertices with similar string values, we just need to traverse to the intermediary MinHash signature vertices first, then from the MinHash signature vertices to the other connected vertices. This way without having to scan all the vertex populations, the vertices with similar string values can be found through graph traversal through the Minhash signature vertices.

In the same way, we can also convert any input string into MinHash signatures to allocate the MinHash signature vertices in order to find the vertices with similar string values to the input string.

Minhash traversal

The Workflow on TigerGraph

TigerGraph is a massively parallel processing graph analytical platform. Implementing the MinHash fuzzy match on TigerGraph is possible by taking the following steps.
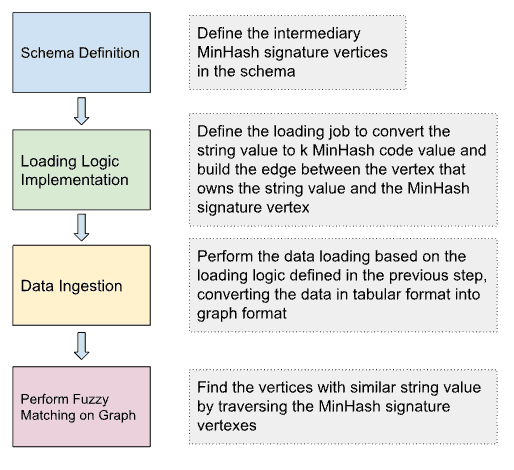
Minhash workflow

Schema Definition

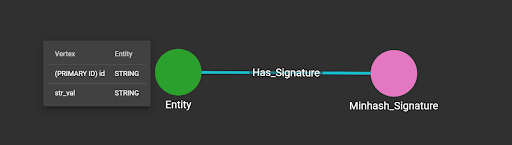
In the graph schema, define the vertex type for MinHash signature and edge type between the entity that owns the string attribute and the MinHash signature vertex.

MinHash schema

Loading Jobs

The loading job converts the strings to be matched into k MinHash signatures values, the number k is a configurable number of hash functions that will be used in the MinHash process. To do this, a TokenBank function is used. 

The input to the TokenBank function is the string value for the fuzzy matching and the value of k and j. In our example, k=3 and j=10. The output of the TokenBank function is the MinHash signature delimited by “|”. With the output, the flatten function of the loading job is used to load the split string into a temp_table.

PUT TokenBank FROM "TokenBank.cpp"

use graph MinHash
drop job load_hash
CREATE LOADING JOB load_hash FOR GRAPH MinHash {
     DEFINE FILENAME MyDataSource;
     LOAD MyDataSource TO TEMP_TABLE t1(vertexID, signature, stringvalue) VALUES($0, FLATTEN(minHash($1,"3","10"), "|", 1), $1) USING SEPARATOR=",", HEADER="false", EOL="\n";
     LOAD TEMP_TABLE t1 TO EDGE Has_Signature VALUES($"vertexID", $"signature"),
                        TO VERTEX Entity VALUES($"vertexID", $"stringvalue");
}

run loading job load_hash using MyDataSource="data.csv"

By executing the script above, the data below is ingested.

1,TigerGraph
2,Tiger Grph
3,TiiigerGraph
4,Sheila M. Swinton
5,Sheila Swinton
6,Beverly Farmer
7,Bev Farmer
8,Crystal Pablo
9,Chrissy Pablo

Data Loading

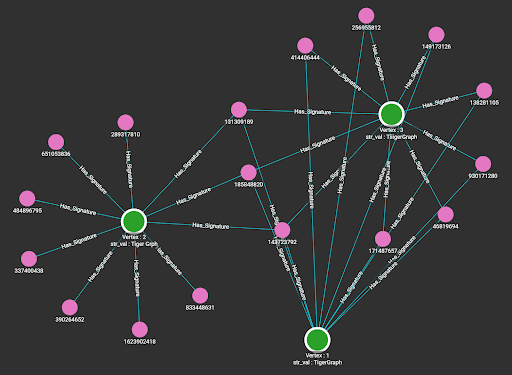
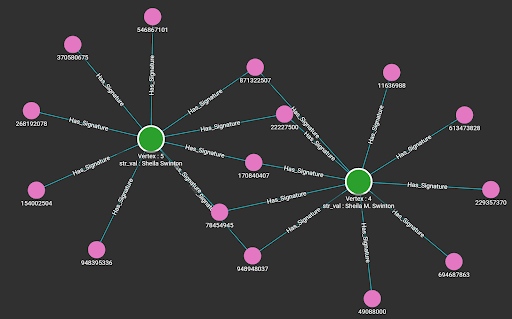
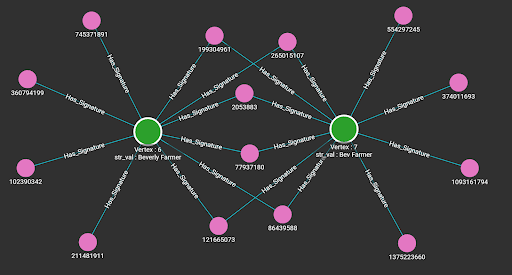
By running the loading jobs, the edges between the entity that owns the string attribute and the MinHash signatures of the string value are connected. Below are the visualization results from the Explore Graph page.

MinHash Data Loading

MinHash Data Loading

MinHash Data Loading

Queries

To perform the fuzzy match between vertices, either apply Jaccard Similarity or directly use the Jaro–Winkler distance expression function. The Jaccard Similarity approach will calculate the topological similarity based on the number of common MinHash signature vertices between the vertices to be matched. Because we only have a limited number of MinHash signatures, the result of the Jaccard Similarity will be approximate. To obtain an accurate string similarity, the string distance function is recommended.

Below is the query utilizing the string distance function that takes a vertex as input and returns the vertices that have similar strings, ordered by the similarity.

CREATE QUERY string_distance(VERTEX input) FOR GRAPH MinHash { 

 SumAccum @similarity;
  STRING val;

 start = {input};

 signatures = SELECT t FROM start:s-(Has_Signature)-:t
                       POST-ACCUM val = s.str_val;

 matches = SELECT t FROM signatures:s-(Has_Signature)-:t
                   WHERE t != input
                   ACCUM [email protected] += jaroWinklerDistance(val, t.str_val)
                    ORDER BY [email protected] DESC;

 print matches;
}

Result when taking vertex 1 as input.

[
 {
   "matches": [
     {
       "attributes": {
         "@similarity": 9.55556,
         "str_val": "TiiigerGraph"
       },
       "v_id": "3",
       "v_type": "Entity"
     },
     {
       "attributes": {
         "@similarity": 2.88,
         "str_val": "Tiger Grph"
       },
       "v_id": "2",
       "v_type": "Entity"
     }
   ]
 }
]

Below is the single source Jaccard Similarity query from the Graph Data Science Library.

CREATE QUERY tg_jaccard_nbor_ss (VERTEX source, STRING e_type, STRING rev_e_type, 
 INT top_k = 100, BOOL print_accum = TRUE, STRING similarity_edge_type = "", STRING file_path = "")  SYNTAX V1 {

/*
Calculates the Jaccard Similarity between a given vertex and every other vertex.
 Jaccard similarity = intersection_size / (size_A + size_B - intersection_size)
Parameters:
source: start vertex                           top_k: #top scores to report
e_type: directed edge types to traverse        print_accum: print JSON output
rev_e_type: reverse edge types to traverse     file_path: file to write CSV output to
similarity_edge_type: edge type for storing vertex-vertex similarity scores

 This query current supports only a single edge type (not a set of types) - 8/13/20
*/

 SumAccum @sum_intersection_size, @@sum_set_size_A, @sum_set_size_B;
 SumAccum @sum_similarity;
 FILE f (file_path);

 Start (ANY) = {source};
 Start = SELECT s
   FROM Start:s
   ACCUM @@sum_set_size_A += s.outdegree(e_type);

 Subjects = SELECT t
      FROM Start:s-(e_type:e)-:t;

 Others = SELECT t
    FROM Subjects:s -(rev_e_type:e)- :t
    WHERE t != source
    ACCUM 
        [email protected]_intersection_size += 1,
        [email protected]_set_size_B = t.outdegree(e_type)
    POST-ACCUM 
        [email protected]_similarity = [email protected]_intersection_size*1.0/(@@sum_set_size_A + [email protected]_set_size_B - [email protected]_intersection_size)
    ORDER BY [email protected]_similarity DESC
    LIMIT top_k;

 IF file_path != "" THEN
     f.println("Vertex1", "Vertex2", "Similarity");
 END;

 Others = SELECT s
    FROM Others:s
    POST-ACCUM 
        IF similarity_edge_type != "" THEN
            INSERT INTO EDGE similarity_edge_type VALUES (source, s, [email protected]_similarity)
        END,
        IF file_path != "" THEN 
            f.println(source, s, [email protected]_similarity) 
        END; 

 IF print_accum THEN
     PRINT Others[[email protected]_similarity];
 END;
}

Result when taking vertex 1 as input.

[
 {
   "Others": [
     {
       "attributes": {
         "[email protected]_similarity": 0.17647
       },
       "v_id": "2",
       "v_type": "Entity"
     },
     {
       "attributes": {
         "[email protected]_similarity": 1
       },
       "v_id": "3",
       "v_type": "Entity"
     }
   ]
 }
]

Below is the query that takes a query string as input, and returns the vertices that have a similar string value.

CREATE QUERY query_by_string(string query_str) FOR GRAPH MinHash { 
  
 SetAccum @@min_hash_signatures;
 SetAccum @@signatures_vertex;
 SumAccum @similarity;

@@min_hash_signatures = minHash(query_str,3,10);

@@signatures_vertex = to_vertex_set(@@min_hash_signatures, "Minhash_Signature");

  start = @@signatures_vertex;

  start = SELECT t FROM start:s-(Has_Signature)-:t
            POST-ACCUM [email protected] += jaroWinklerDistance(query_str, t.str_val)
            ORDER BY [email protected] DESC;

  print start;
}

Below is the result of running the query above with input ‘tigergraph.’

{
   "start": [
     {
       "attributes": {
         "@similarity": 0.86667,
         "str_val": "TigerGraph"
       },
       "v_id": "1",
       "v_type": "Entity"
     },
     {
       "attributes": {
         "@similarity": 0.82222,
         "str_val": "TiiigerGraph"
       },
       "v_id": "3",
       "v_type": "Entity"
     },
     {
       "attributes": {
         "@similarity": 0.8,
         "str_val": "Tiger Grph"
       },
       "v_id": "2",
       "v_type": "Entity"
     }
   ]
 }

Conclusion

This blog introduced a way of running string fuzzy matches on graphs that is very performant, storage efficient, and easy to implement. The proposed approach doesn’t have to rely on additional infrastructure and can fulfill the need for both similar string value matching between vertices and fuzzy searching of vertex attribute values.

If you have any questions about this approach or using other graph algorithms or functions, we encourage you to join our TigerGraph Developer Community. On the community, you’ll find a collection of your peers, TigerGraph users from around the world, and our own graph experts, all of whom are committed to sharing their knowledge in an open, interactive forum.

You Might Also Like

TigerGraph Showcases Unrivaled Performance at Scale

TigerGraph Showcases Unrivaled Performance at Scale

January 12, 2023
How to Create a Visual Graph Analytics Application Using TigerGraph Insights in 30 mins

How to Create a Visual Graph...

November 14, 2022
Turbocharge your business intelligence with TigerGraph’s ML Workbench on TigerGraph Cloud

Turbocharge your business intelligence with TigerGraph’s...

November 14, 2022

Introducing TigerGraph 3.0

July 1, 2020

Everything to Know to Pass your TigerGraph Certification Test

June 24, 2020

Neo4j 4.0 Fabric – A Look Behind the Curtain

February 7, 2020

TigerGraph Blog

  • Categories
    • blogs
      • About TigerGraph
      • Benchmark
      • Business
      • Community
      • Compliance
      • Customer
      • Customer 360
      • Cybersecurity
      • Developers
      • Digital Twin
      • eCommerce
      • Emerging Use Cases
      • Entity Resolution
      • Finance
      • Fraud / Anti-Money Laundering
      • GQL
      • Graph Database Market
      • Graph Databases
      • GSQL
      • Healthcare
      • Machine Learning / AI
      • Podcast
      • Supply Chain
      • TigerGraph
      • TigerGraph Cloud
    • Graph AI On Demand
      • Analysts and Research
      • Customer 360 and Entity Resolution
      • Customer Spotlight
      • Development
      • Finance, Banking, Insurance
      • Keynote
      • Session
    • Video
  • Recent Posts

    • It’s Time to Harness the Power of Graph Technology [Infographic]
    • TigerGraph Showcases Unrivaled Performance at Scale
    • TigerGraph 101 An Introduction to Graph | Jan 26th @ 9am PST
    • Data Science Salon New York
    • Tech For Retail
    TigerGraph

    Product

    SOLUTIONS

    customers

    RESOURCES

    start for free

    TIGERGRAPH DB
    • Overview
    • Features
    • GSQL Query Language
    GRAPH DATA SCIENCE
    • Graph Data Science Library
    • Machine Learning Workbench
    TIGERGRAPH CLOUD
    • Overview
    • Cloud Starter Kits
    • Login
    • FAQ
    • Pricing
    • Cloud Marketplaces
    USEr TOOLS
    • GraphStudio
    • TigerGraph Insights
    • Application Workbenches
    • Connectors and Drivers
    • Starter Kits
    • openCypher Support
    SOLUTIONS
    • Why Graph?
    industry
    • Advertising, Media & Entertainment
    • Financial Services
    • Healthcare & Life Sciences
    use cases
    • Benefits
    • Product & Service Marketing
    • Entity Resolution
    • Customer 360/MDM
    • Recommendation Engine
    • Anti-Money Laundering
    • Cybersecurity Threat Detection
    • Fraud Detection
    • Risk Assessment & Monitoring
    • Energy Management
    • Network & IT Management
    • Supply Chain Analysis
    • AI & Machine Learning
    • Geospatial Analysis
    • Time Series Analysis
    success stories
    • Customer Success Stories

    Partners

    Partner program
    • Partner Benefits
    • TigerGraph Partners
    • Sign Up
    LIBRARY
    • Resources
    • Benchmark
    • Webinars
    Events
    • Trade Shows
    • Graph + AI Summit
    • Million Dollar Challenge
    EDUCATION
    • Training & Certifications
    Blog
    • TigerGraph Blog
    DEVELOPERS
    • Developers Hub
    • Community Forum
    • Documentation
    • Ecosystem

    COMPANY

    Company
    • Overview
    • Careers
    • News
    • Press Release
    • Awards
    • Legal
    • Patents
    • Security and Compliance
    • Contact
    Get Started
    • Start Free
    • Compare Editions
    • Online Demo - Test Drive
    • Request a Demo

    Product

    • Overview
    • TigerGraph 3.0
    • TIGERGRAPH DB
    • TIGERGRAPH CLOUD
    • GRAPHSTUDIO
    • TRY NOW

    customers

    • success stories

    RESOURCES

    • LIBRARY
    • Events
    • EDUCATION
    • BLOG
    • DEVELOPERS

    SOLUTIONS

    • SOLUTIONS
    • use cases
    • industry

    Partners

    • partner program

    company

    • Overview
    • news
    • Press Release
    • Awards

    start for free

    • Request Demo
    • take a test drive
    • SUPPORT
    • COMMUNITY
    • CONTACT
    • Copyright © 2023 TigerGraph
    • Privacy Policy
    • Linkedin
    • Facebook
    • Twitter

    Copyright © 2020 TigerGraph | Privacy Policy

    Copyright © 2020 TigerGraph Privacy Policy

    • SUPPORT
    • COMMUNITY
    • COMPANY
    • CONTACT
    • Linkedin
    • Facebook
    • Twitter

    Copyright © 2020 TigerGraph

    Privacy Policy

    • Products
    • Solutions
    • Customers
    • Partners
    • Resources
    • Company
    • START FREE
    START FOR FREE
    START FOR FREE
    TigerGraph
    PRODUCT
    PRODUCT
    • Overview
    • GraphStudio UI
    • Graph Data Science Library
    TIGERGRAPH DB
    • Overview
    • Features
    • GSQL Query Language
    TIGERGRAPH CLOUD
    • Overview
    • Cloud Starter Kits
    TRY TIGERGRAPH
    • Get Started for Free
    • Compare Editions
    SOLUTIONS
    SOLUTIONS
    • Why Graph?
    use cases
    • Benefits
    • Product & Service Marketing
    • Entity Resolution
    • Customer Journey/360
    • Recommendation Engine
    • Anti-Money Laundering (AML)
    • Cybersecurity Threat Detection
    • Fraud Detection
    • Risk Assessment & Monitoring
    • Energy Management
    • Network Resources Optimization
    • Supply Chain Analysis
    • AI & Machine Learning
    • Geospatial Analysis
    • Time Series Analysis
    industry
    • Advertising, Media & Entertainment
    • Financial Services
    • Healthcare & Life Sciences
    CUSTOMERS
    read all success stories


    PARTNERS
    Partner program
    • Partner Benefits
    • TigerGraph Partners
    • Sign Up
    RESOURCES
    LIBRARY
    • Resource Library
    • Benchmark
    • Webinars
    Events
    • Trade Shows
    • Graph + AI Summit
    • Graph for All - Million Dollar Challenge
    EDUCATION
    • TigerGraph Academy
    • Certification
    Blog
    • TigerGraph Blog
    DEVELOPERS
    • Developers Hub
    • Community Forum
    • Documentation
    • Ecosystem
    COMPANY
    COMPANY
    • Overview
    • Leadership
    • Careers  
    NEWS
    PRESS RELEASE
    AWARDS
    START FREE
    Start Free
    • Request a Demo
    • SUPPORT
    • COMMUNITY
    • CONTACT
    Dr. Jay Yu

    Dr. Jay Yu | VP of Product and Innovation

    Dr. Jay Yu is the VP of Product and Innovation at TigerGraph, responsible for driving product strategy and roadmap, as well as fostering innovation in graph database engine and graph solutions. He is a proven hands-on full-stack innovator, strategic thinker, leader, and evangelist for new technology and product, with 25+ years of industry experience ranging from highly scalable distributed database engine company (Teradata), B2B e-commerce services startup, to consumer-facing financial applications company (Intuit). He received his PhD from the University of Wisconsin - Madison, where he specialized in large scale parallel database systems

    Todd Blaschka | COO

    Todd Blaschka is a veteran in the enterprise software industry. He is passionate about creating entirely new segments in data, analytics and AI, with the distinction of establishing graph analytics as a Gartner Top 10 Data & Analytics trend two years in a row. By fervently focusing on critical industry and customer challenges, the companies under Todd's leadership have delivered significant quantifiable results to the largest brands in the world through channel and solution sales approach. Prior to TigerGraph, Todd led go to market and customer experience functions at Clustrix (acquired by MariaDB), Dataguise and IBM.