Why Detecting Fraud Rings and Collusion Requires a Graph-First Approach
Fraud today isn’t a single stolen card or a suspicious wire. It’s organized, adaptive, sprawling, and hard to spot. Networks of mule accounts, synthetic identities, complicit merchants, and cross-border facilitators work together in carefully orchestrated rings. By the time a traditional detection system flags a suspicious transaction, the money has already crossed jurisdictions and vanished.
For top banks, this represents a financial loss as well as reputational damage, regulatory exposure, and a drain on analysts.
These professionals spend too much time chasing false positives while the real fraudsters slip through. And it’s all because flat models can’t keep up.
Flat Models Can’t Keep Up
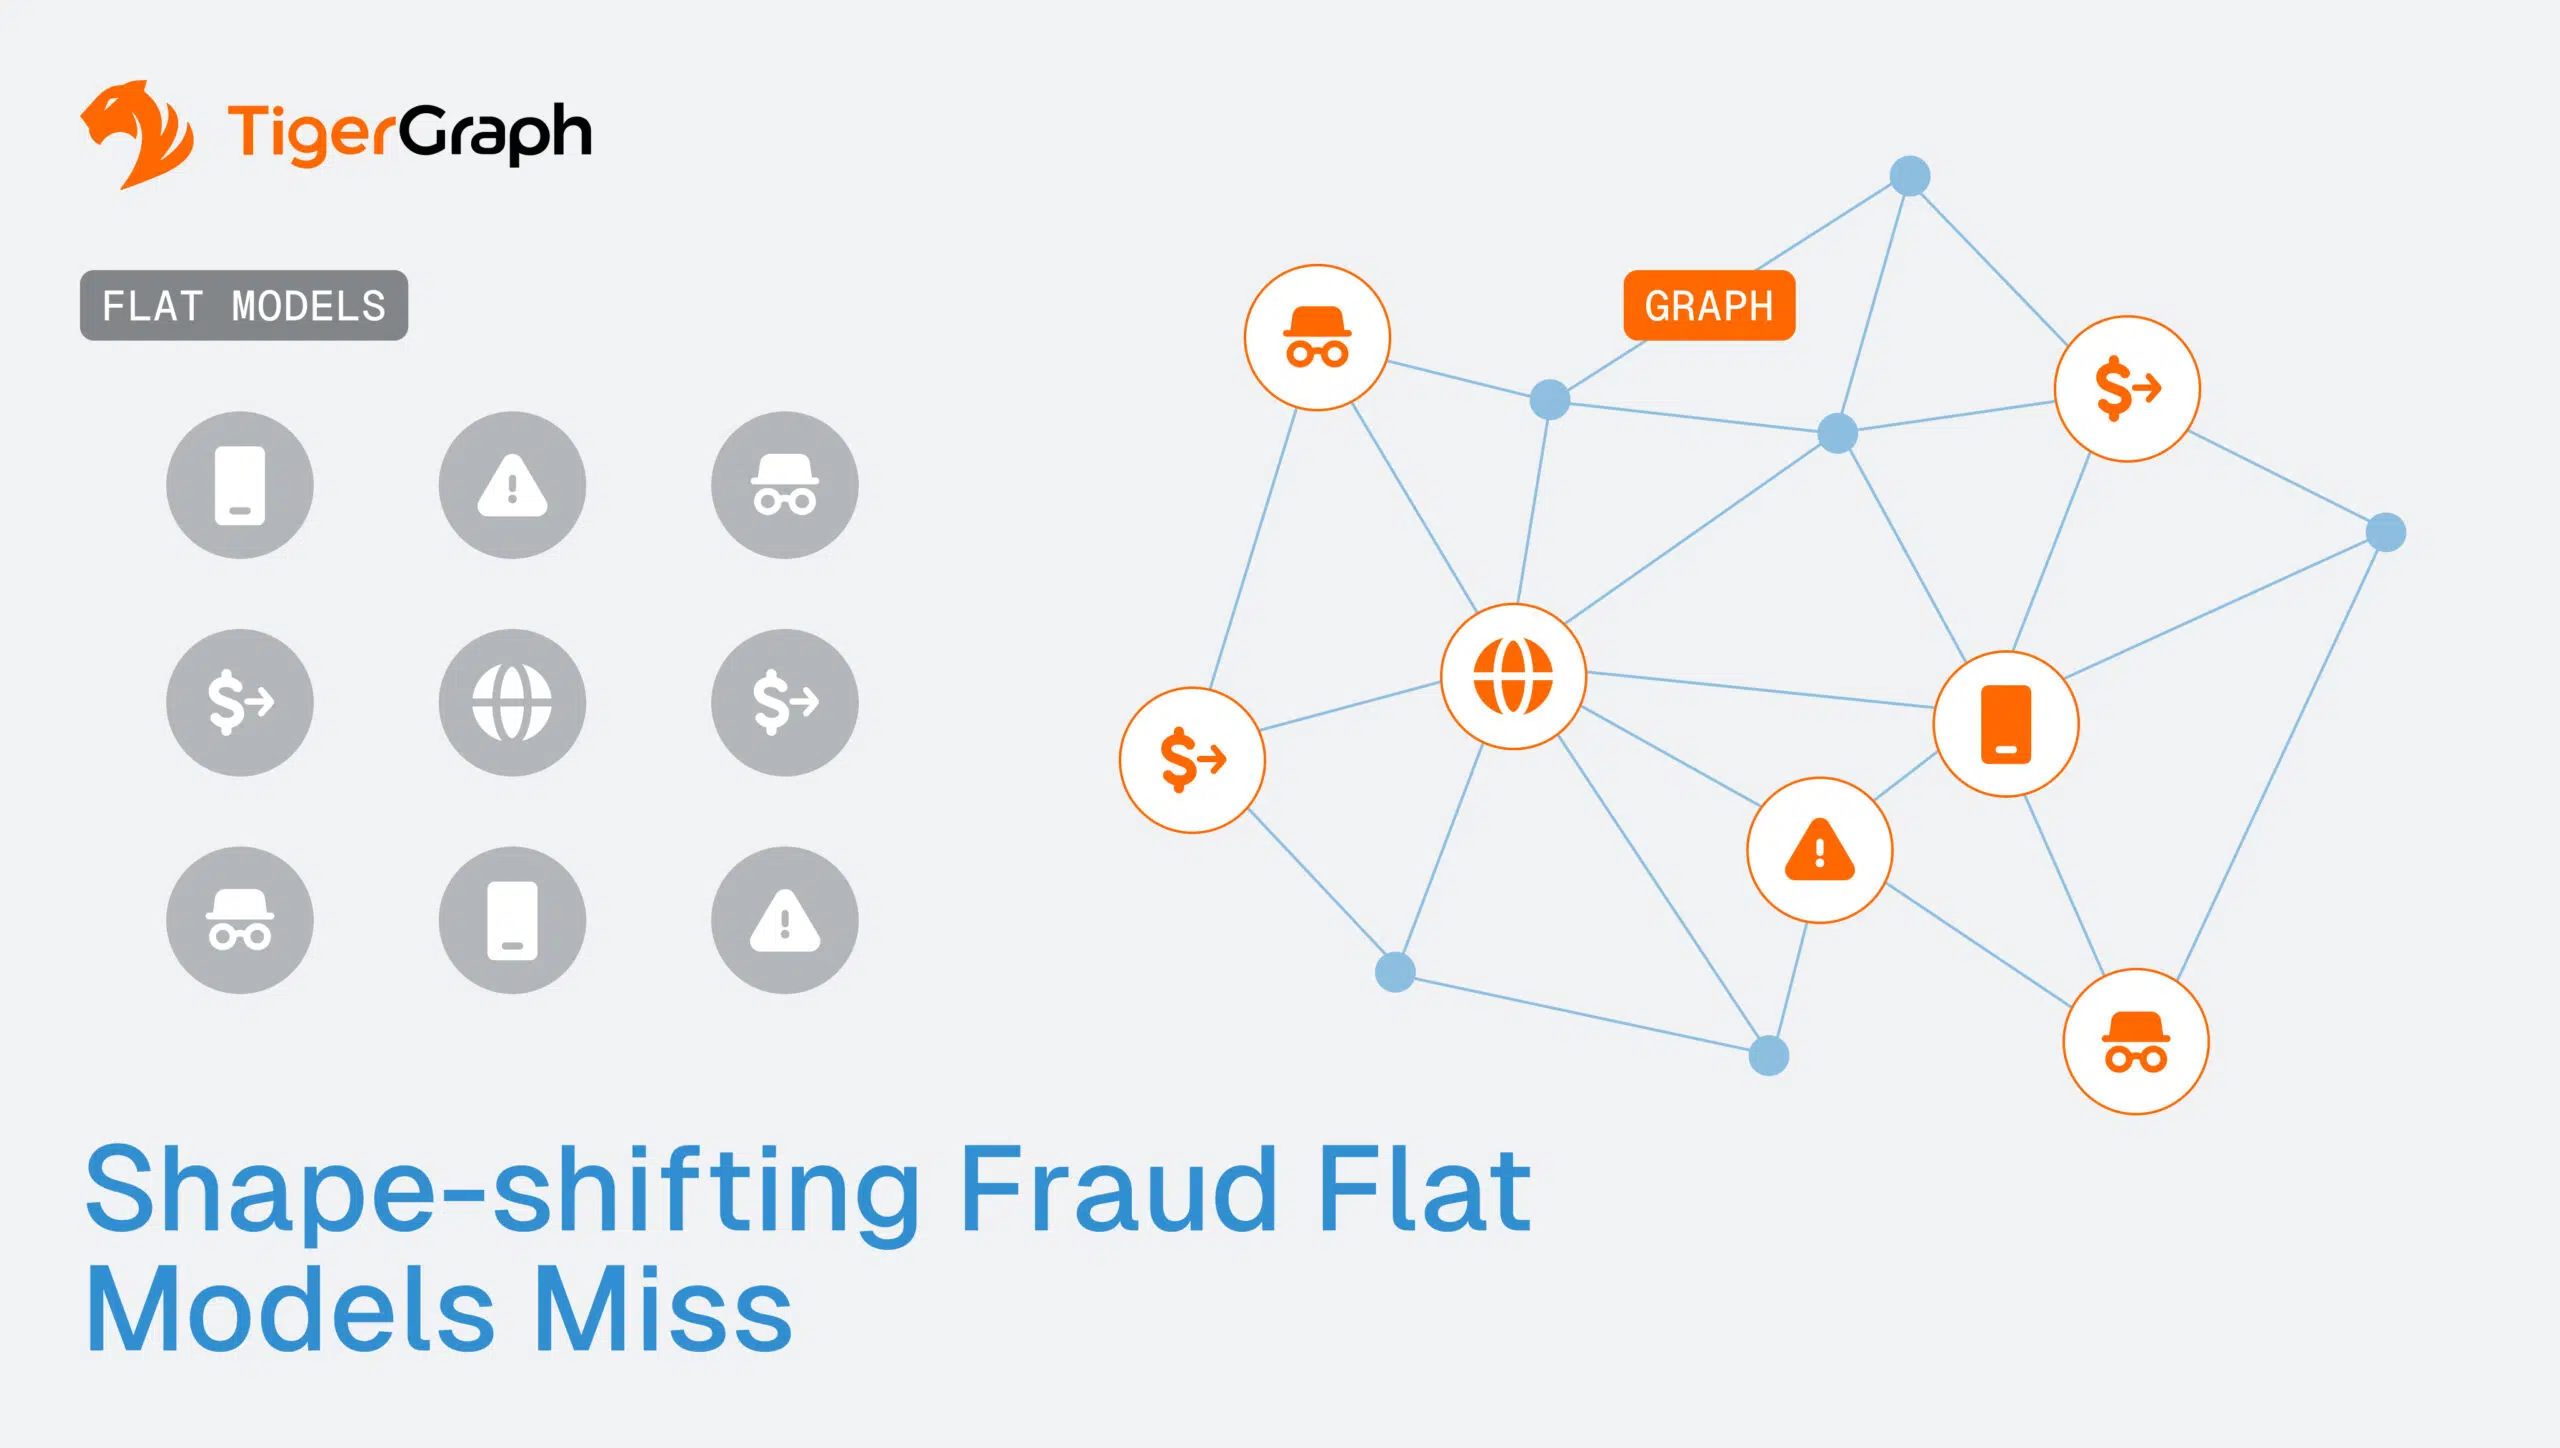
Most banks still rely on flat, tabular models for fraud detection. These models treat each transaction, account, or merchant as an isolated row in a database, disconnected from the broader web of activity around it. This row-by-row logic is efficient for simple anomaly detection—catching a sudden spike in transaction size, an unexpected geolocation, or a login from a flagged IP.
But fraud has outgrown these models.
Organized rings thrive in the hidden patterns across individual data points. Flat models can’t easily connect the dots across multiple accounts, channels, or time periods. They struggle when fraud is collective, coordinated, and designed to look normal in isolation.
That’s why today’s most damaging schemes slip past detection until it’s too late. Consider:
- Dozens of mule accounts funneling money to a central hub. Flat models see a set of small, ordinary accounts. A graph model instantly reveals the hub-and-spoke structure connecting them, as this is the hallmark of a mule network.
- Merchants quietly cooperating with buyers. One-off transactions look normal in isolation. A graph view shows the unusually dense connections between certain merchants and a cluster of suspicious buyers, surfacing collusion.
- Synthetic identities built from stolen data. Flat models let fake identities pass KFC screening because each identity checks out on its own. Graph exposes the overlap: multiple “unique” customers tied to the same phone number, device, or address.
- Funds layered through ten intermediaries. Tabular systems log ten ordinary transfers. A graph traversal uncovers the entire chain, showing how money was laundered across accounts and jurisdictions.
Flat models reduce fraud to scattered anomalies. Graph connects the dots, exposing the network
Fraud Rings in Motion
The most dangerous thing about modern fraud is its ability to mutate. Shut down one set of accounts, and new ones appear within hours. Flag one pattern, and fraudsters rapidly switch tactics, moving money through new intermediaries, testing different transaction types, or shifting to another merchant channel.
This isn’t random improvisation. It’s coordinated adaptation.
Fraud rings operate more like living systems than isolated events. They monitor banks’ defenses, adjust in real time, and use redundancy so that no single takedown cripples the network. The result is fraud that doesn’t just scale, but actively learns how to survive.
Static detection methods leave banks permanently one step behind because they:
- Treat each incident as a reset. Once a flagged account is closed, flat systems don’t preserve the history of relationships or tactics used.
- Miss the ripple effects. When fraudsters pivot, related accounts, merchants, or synthetic IDs often resurface elsewhere, but without network visibility, those links remain hidden.
- Overwhelm analysts. Each mutation generates new alerts that look different on the surface but are variations of the same underlying scheme. Analysts are left chasing symptoms instead of addressing the system.
To stop fraud that moves and adapts like this, banks need detection models that recognize patterns as they shift, not just when they first appear. That means understanding how people, accounts, merchants, and devices are connected, and how those connections evolve over time.
Why Graph Fills the Gap
If fraud mutates like a living system, it’s not enough to have the most recent data. Many tabular systems can deliver real-time updates, but they still treat each transaction as an isolated event. What’s missing is the ability to see how patterns evolve.
That’s exactly what graph delivers. Unlike flat models, a graph-based model connects every account, transaction, merchant, or device into a living, queryable map. It captures what happened, and it shows how those relationships change over time and what that reveals about the fraudsters’ intent. By analyzing those evolving patterns, investigators gain foresight into coordinated activity that would stay hidden in tables.
With TigerGraph’s real-time scalable graph, fraud teams can:
- Detect collusion and multi-hop patterns: Spot when hundreds of accounts share devices, IPs, or merchants, even as fraudsters switch identities.
- Expose hidden facilitators: Surface the merchants or service providers that consistently reappear in different fraud schemes, even after old accounts are shut down.
- Track mutations in real time: See how fraud rings adapt, with models that evolve along with the behavior, not weeks later, but as transactions stream in.
- Operate at enterprise scale: TigerGraph supports 1B+ transactions per day and runs queries in 80 milliseconds, giving fraud teams actionable answers before losses escalate.
This gives banks a fraud model that evolves as quickly as the fraud itself—one that turns mutation from an advantage for criminals into an opportunity for earlier, more decisive intervention.
Real Results at Leading Banks
When top banks apply graph to fraud detection, the impact is tangible and measurable:
- $100M+ in annual fraud losses prevented. By detecting mule networks earlier, banks have been able to stop money before it disappears across accounts and jurisdictions.
- Operational efficiency gains. Fraud SVPs and operations teams report faster triage cycles, with analysts spending less time on false positives and more time pursuing confirmed threats.
- Enterprise-grade compliance. Graph models built on TigerGraph support FinCEN, AML, and KYC requirements, giving risk leaders confidence that their detection systems align with regulatory expectations and auditability standards.
- Proven scale and performance. TigerGraph powers fraud workloads handling 1B+ transactions per day, with queries returning in as little as 80 milliseconds, making real-time detection and intervention a reality for Tier-1 banks.
There are fewer misses, fewer wasted investigations, and more fraud stopped in motion.
With fraud evolving faster than flat models ever can, graph gives banks the structural visibility and real-time performance to keep pace. And TigerGraph transforms fraud prevention into a dynamic, network-first capability that sees fraud for what it is: a shape-shifting, relational problem.
Reach out for more info on how to use graph to outpace fraud rings, and you can experience graph analytics in minutes—launch your free TigerGraph instance at tgcloud.io.
