Structuring and Evasion Patterns Become Clearer With Graph Context
Thresholds can create blind spots. Structuring is a common example. Structuring means splitting activity into smaller transactions to avoid attention tied to thresholds.
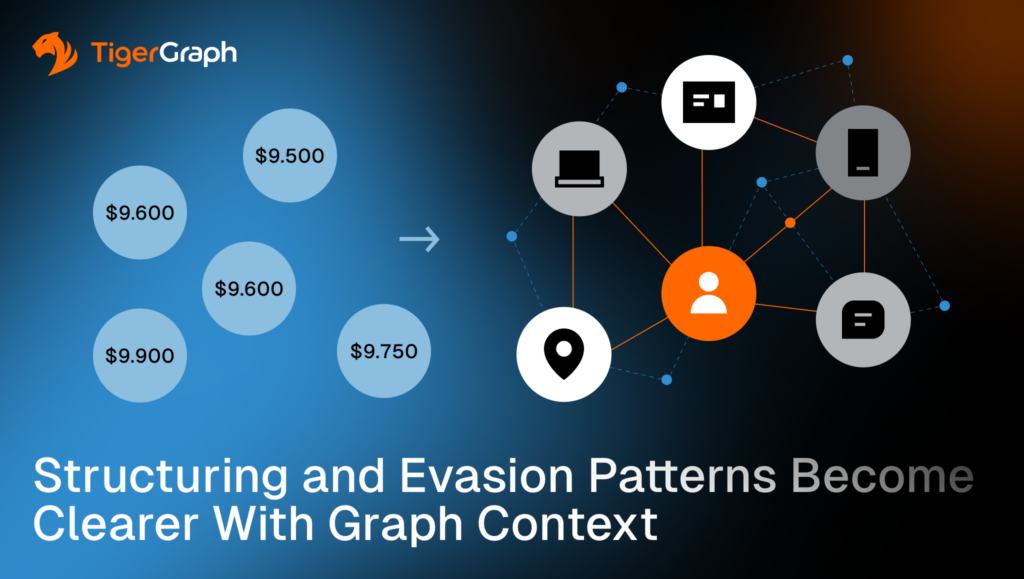
When activity is split across linked accounts, shared devices, and repeated destinations, each piece can look compliant while the combined behavior suggests coordination. Graph analytics helps teams connect those fragments into a single view that supports triage and review.
In this post, graph analytics means analyzing accounts and parties as a network of connections, not isolated records.
Key takeaways
- Threshold evasion becomes clearer when you connect activity across linked accounts and shared infrastructure.
- Alternating sizes and round-dollar patterns can look like noise in isolation. They become more meaningful when the same variation repeats across a connected cluster.
- Graph outputs can preserve connecting paths, meaning the chain of links that explains how the accounts and parties connect. That supports escalation rationale, review, and governance.
Why Structuring Looks Smaller Than it is
Account-level monitoring can flag small transactions and quick transfers after money hits an account, such as after a cash deposit. That approach misses the bigger pattern when activity is spread out.
Structuring often works by splitting deposits across multiple accounts, people and channels so each piece looks normal on its own. The signals below become more meaningful when you connect the activity and look at it as a network.
Structuring Signals that Matter
These signals below are rarely decisive on their own. They carry more weight when they repeat across connected accounts or reuse the same access or routing infrastructure.
- Repeated sub-threshold transactions
A single customer making frequent smaller deposits can be benign. The risk increases when the same behavior repeats with similar timing and similar counterparties, or when deposits quickly feed the same destinations. - Distributed sub-threshold deposits across linked accounts
The key is dispersion. Many smaller deposits across connected accounts can add up to a coordinated evasion pattern, especially when the accounts share deposit locations, devices, addresses or beneficiaries. - Rapid funding, then transfer
Speed matters when it is repeatable. Funding activity followed by rapid movement to other accounts, new beneficiaries, or external corridors becomes more meaningful when the same sequence appears across a connected group. - Alternating sizes to defeat pattern rules
Alternating amounts can look random. The signal strengthens when the same variation repeats across linked accounts and parties, or when amounts consistently stay just under thresholds while still reaching the same destinations. - Round-dollar repetition across accounts or or payment corridors
Round-dollar behavior is common. The signal strengthens when round-dollar amounts repeat across linked accounts, the same corridor, meaning the same route between origin and destination (often across geographies or institutions), or the same destination structure, especially when paired with shared infrastructure or rapid movement.
What Graph Adds to Structuring and Evasion Detection
Graphs treat relationships as first-class data. That changes what can be tested quickly and what can be explained during escalation.
Graph context helps teams do the following.
- Connect depositors, channels, devices, locations and beneficiaries so related activity is evaluated as a single pattern.
- Determine whether the behavior is concentrated within a single connected group or appears scattered across unrelated accounts.
- Identify bridge accounts and shared infrastructure, meaning shared access or routing clues such as devices, logins, addresses, or deposit locations that distribute or aggregate activity across groups.
- Preserve the connecting paths used to assemble context so the escalation rationale is traceable and reviewable.
How to Model Structuring for Investigation-Grade Context
Structuring is easier to detect when your data lets you connect three things. How money comes in, how it moves, and where it ends up. You should be able to do the following.
- Keep the deposit details. Record where and how a deposit happened when that information is available. Examples include a branch, an ATM, a merchant location, a terminal, or the deposit channel.
- Make shared clues easy to connect. Track identifiers that tie activity together across accounts. Examples include devices, phone numbers, addresses, and login information. Do not bury these in notes or free text if you want to use them reliably.
- Use consistent time windows. Define the time period you are analyzing and keep it consistent for the product or channel. Structuring patterns often become clearer when you apply the same window across related accounts.
- Keep the order of events. Some patterns depend on sequence. It matters whether deposits are followed quickly by transfers and how much time passes between those steps.
Results also depend on how well your data links the same real-world entity across systems, such as accounts, devices, and addresses.
At this point, a common question comes up. If the data already lives in tables, why not connect it there?
Why Not just Connect Across Tables?
You can, and plenty of teams do. In a traditional database, connecting data across tables typically involves a “join.” A join links rows by matching fields such as customer IDs, account numbers, device IDs, or addresses.
When the question requires several steps across accounts and parties, joins can get expensive because the system may need to scan sets of records and compare fields repeatedly to find matches. Graphs store relationships directly, so expanding from one entity to its connected entities follows already-stored links and can return the connection paths needed for review.
That approach works well when the relationships you need are simple, the depth is fixed and the questions are predictable. You write the query, connect two or three tables and pull the results.
Structuring investigations is often messier.
Analysts start with one alert and then keep expanding to see what else is connected. The depth changes depending on what they find. They also need to explain how entities connect; they are not just showing a list of records.
Graph analysis supports that workflow by treating relationships as first-class data. It makes it easier to expand step by step and return the actual connection paths that justify treating separate-looking activities as one pattern.
Implementation checklist:
- Define thresholds and time windows by product and channel.
- Look for repeated patterns across connected groups, not only per-account counts.
- Save connected evidence. Include the accounts and parties involved and the paths that link them so another analyst can reproduce the rationale.
Once teams can see a connected pattern, the next requirement is operational. The workflow needs to expand context quickly and preserve the evidence used for the decision. This is where TIgerGraph comes in.
How TigerGraph Supports Investigation-Grade Outputs
TigerGraph fits when AML teams need connected context that stays fast, consistent and explainable as investigations move from one alert to a wider network. It adds value in three practical ways.
- Expand context as the investigation grows. Analysts can start with one alert and pull in related accounts, people, shared infrastructure and destinations through multiple connection steps.
- Keep relationship rules consistent. Teams can define how connections are evaluated and reuse that logic across workflows, so analysts and analytics are working from the same definition of “connected.”
- Keep the evidence reviewable. When a case escalates, teams can return and store the connection paths used in analysis. That makes the rationale easier to review and reproduce.
Structuring rarely shows up as one customer acting oddly. It often shows up as coordination across accounts, shared access infrastructure, and destinations. Graph context makes those connections visible.
TigerGraph is built for investigation-grade graph workloads where teams need to expand that visibility across multiple connection steps, while keeping logic consistent across workflows, and preserving the exact connection paths that justify escalation.
A practical next step
Run a structuring readiness drill. Pick three recent threshold-related alerts and confirm whether your workflow can do the following:
- Connect related activity across linked accounts and shared access clues, such as deposit channels, devices, addresses, or locations.
- Detect whether small deposits and follow-on transfers repeat as a recognizable pattern across a connected group, not only inside one account.
- Save the connected evidence, including the accounts and parties involved and the connection paths that explain why the activity was treated as one pattern.
If your team still has to stitch this together by hand, you have a connected-context gap. When structuring detection depends on connected context and reviewable evidence paths, include TigerGraph in the evaluation.
Frequently Asked Questions
1. What is Structuring in Anti-money Laundering (AML) Detection?
Structuring is a financial crime technique where individuals split large transactions into smaller amounts to avoid reporting thresholds or automated monitoring rules. Instead of one large deposit, multiple smaller deposits may be made across accounts or channels. These transactions may appear compliant individually, but when analyzed together they can reveal coordinated activity designed to evade detection.
2. Why do Traditional Transaction Monitoring Systems Miss Structuring Patterns?
Traditional monitoring systems often evaluate transactions at the individual account level or against fixed thresholds. When suspicious activity is distributed across multiple accounts, devices, or locations, each transaction may appear normal in isolation. Without connecting these activities across related accounts and shared infrastructure, the broader pattern of threshold evasion can remain hidden.
3. How does Graph Analytics Improve Detection of Structuring and Evasion Patterns?
Graph analytics models accounts, individuals, devices, and transactions as a connected network. By analyzing these relationships together, investigators can detect patterns such as repeated sub-threshold deposits, shared infrastructure across accounts, or coordinated transfers to the same destination. This network-based analysis helps identify behavior that appears legitimate at the individual transaction level but suspicious at the group level.
4. What Types of Connections Help Reveal Coordinated Financial Activity?
Connections that often reveal coordinated activity include shared devices, phone numbers, addresses, deposit locations, login credentials, or repeated beneficiaries. When multiple accounts use the same infrastructure or follow similar transaction sequences, these relationships can indicate that separate-looking activities are part of a coordinated pattern.
5. Why is Explainable Evidence Important When Escalating Structuring Investigations?
Explainable evidence helps investigators show how different accounts, transactions, and entities are connected within a suspicious activity pattern. Instead of relying only on alerts or scores, analysts can present the relationship paths linking accounts, devices, and destinations. This evidence makes escalation decisions easier to review, reproduce, and justify during compliance audits or regulatory examinations.
